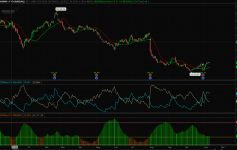
The below indicator is a replica of the ADX system that Chris Moody coded for TradingView at the link below. Feel free to edit and use as you wish. He uses the Gann Swing Hi Low indicator, I used the PSAR indicator as an alternate. Some images attached below.


ADXDMIGannHiLow code below.
Video illustration: https://vimeopro.com/user32804960/tradingview-indicators/video/112194301
ADXMod code https://tos.mx/PRaxsci
DMIMod code below https://tos.mx/CUaFybK
Incorporated the GannHiLow study to stay true to the original system.
Thanks @BenTen for pointing me to the GannHiLo study on this site.
ADXDMIGannHiLow code below.
Code:
#
# This study attempts to replicate Chris Moody's ADX System for TOS. All credit goes to him. This study incorporates the GannHiLo study to determine the swing hi's and lows.

# Take a look at the video here where he explains this system.
# https://vimeopro.com/user32804960/tradingview-indicators/video/112194301

# This study attempts to catch the beginning of a swing move in a trending underlying. What you want to do is waiting for crossovers of the DI+/DI- respectively while the ADX is beginning to Trend above 20 while the ParabolicSAR is in a supportive Swing High or Low. The buy/sell signals will alert you to this. Use your own discretion.

# When the ADX is over 40, the trend is exhausted and you should be looking at exiting your positions.

# Load this indicator along with the ADXMod and DMIMod indicators.

# Gann High Low
# Converted by theelderwand
# Original https://in.tradingview.com/script/XNQSLIYb-Gann-High-Low/

input HPeriod= 13;
input LPeriod= 21;

def HLd = if close > SimpleMovingAvg(high, HPeriod)[1]
          then 1
          else (if close< SimpleMovingAvg(low, LPeriod)[1]
                then -1
                else 0);

def HLv = if HLd != 0 then HLd else 0;

plot HiLo = if HLv == -1
           then SimpleMovingAvg(high, HPeriod)
           else SimpleMovingAvg(low, LPeriod);

HiLo.AssignValueColor(if HLv==-1 then Color.Red else Color.Green);

#Below code is for ADX and DMI confirmation

input length = 14;
input averageType = AverageType.WILDERS;

def hiDiff = high - high[1];
def loDiff = low[1] - low;

def plusDM = if hiDiff > loDiff and hiDiff > 0 then hiDiff else 0;
def minusDM =  if loDiff > hiDiff and loDiff > 0 then loDiff else 0;

def ATR = MovingAverage(averageType, TrueRange(high, close, low), length);
def "DI+" = 100 * MovingAverage(averageType, plusDM, length) / ATR;
def "DI-" = 100 * MovingAverage(averageType, minusDM, length) / ATR;

def DX = if ("DI+" + "DI-" > 0) then 100 * AbsValue("DI+" - "DI-") / ("DI+" + "DI-") else 0;
def ADX = MovingAverage(averageType, DX, length);


#Defines buy and sell setups


def buy = ADX > 20 && ADX > ADX[1] && "DI+" crosses above "DI-" && HLv<>-1;

def sell = ADX > 20 && ADX > ADX[1] && "DI-" crosses above "DI+" && HLv==-1;


# Plot Signals
plot buysignal = buy;
buysignal.SetPaintingStrategy(PaintingStrategy.BOOLEAN_ARROW_UP);
buysignal.SetDefaultColor(Color.CYAN);
buysignal.SetLineWeight(1);
plot sellsignal = sell;
sellsignal.SetPaintingStrategy(PaintingStrategy.BOOLEAN_ARROW_DOWN);
sellsignal.SetDefaultColor(Color.CYAN);
sellsignal.SetLineWeight(1);
Video illustration: https://vimeopro.com/user32804960/tradingview-indicators/video/112194301
ADXMod code https://tos.mx/PRaxsci
DMIMod code below https://tos.mx/CUaFybK
Incorporated the GannHiLow study to stay true to the original system.
Thanks @BenTen for pointing me to the GannHiLo study on this site.
Attachments
Last edited:

