Supertrend Indicator by Mobius for ThinkorSwim

BenTen

Administrative
Staff member
Staff
VIP
Lifetime
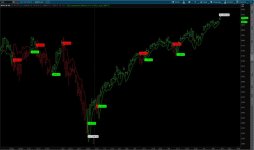
This is a Supertrend indicator for ThinkorSwim created by Mobius.

Supertrend Indicator: shows trend direction and gives buy or sell signals according to that. It is based on a combination of the average price rate in the current period along with a volatility indicator. The ATR indicator is most commonly used as volatility indicator. The values are calculated as follows:

Up = (HIGH + LOW) / 2 + Multiplier * ATR
Down = (HIGH + LOW) / 2 – Multiplier * ATR
When the change of trend occurs, the indicator flips

The complete set of discussions from prior to 2021 can be found:
https://usethinkscript.com/threads/archived-supertrend-indicator-by-mobius-for-thinkorswim.12346/

N3y7JFY.png


thinkScript Code for Supertrend

Code:
# Mobius
# SuperTrend
# Chat Room Request
input AtrMult = 1.0;
input nATR = 4;
input AvgType = AverageType.HULL;
input PaintBars = yes;
def ATR = MovingAverage(AvgType, TrueRange(high, close, low), nATR);
def UP = HL2 + (AtrMult * ATR);
def DN = HL2 + (-AtrMult * ATR);
def ST = if close < ST[1] then UP else DN;
plot SuperTrend = ST;
SuperTrend.AssignValueColor(if close < ST then Color.RED else Color.GREEN);
AssignPriceColor(if PaintBars and close < ST

                 then Color.RED

                 else if PaintBars and close > ST

                      then Color.GREEN

                      else Color.CURRENT);

AddChartBubble(close crosses below ST, low[1], low[1], color.Dark_Gray);
AddChartBubble(close crosses above ST, high[1], high[1], color.Dark_Gray, no);
# End Code SuperTrend

SuperTrend Scanner for ThinkorSwim

Code:
# SuperTrend Scan
# Mobius
# V01.10.2015
# Comment out (#) the direction NOT to use for a scan

input AtrMult = .70;
input nATR = 4;
input AvgType = AverageType.HULL;
def h = high;
def l = low;
def c = close;
def v = volume;
def ATR = MovingAverage(AvgType, TrueRange(h, c, l), nATR);
def UP = HL2 + (AtrMult * ATR);
def DN = HL2 + (-AtrMult * ATR);
def ST = if c < ST[1]
         then Round(UP / tickSize(), 0) * tickSize()
         else Round(DN / tickSize(), 0) * tickSize();
#plot SuperTrendUP = if ST crosses below close then 1 else 0;
plot SuperTrendDN = if ST crosses above close then 1 else 0;
# End Code SuperTrend

Shareable Link

https://tos.mx/mK9Vgg

For anyone looking for the mobile version of this indicator, here is the link to that.

Video Tutorial

 
Last edited by a moderator:
Screenshot (179).png

Everything You Want To Know About SuperTrend Indicators And Were Afraid To Ask.
Study and scanner found in Post#1 https://usethinkscript.com/threads/supertrend-indicator-by-mobius-for-thinkorswim.7/#post-12
Install instructions: https://usethinkscript.com/threads/how-to-import-existing-thinkscript-code-on-thinkorswim.10/
Start out with extended hours off.

Screenshot (85).png


What Is The Supertrend Indicator
Screenshot (175).png
1. How can you tell if you are in a trending market and avoid false signals?​
Use three time frames to decipher the long, medium, and short-term trends.​
2. Which timeframes you ask? Here is a summary of how to determine what timeframes to use:​
Screenshot (177).png
The indicator does well with the default multiplier setting. There is no best setting for any trading indicator.​
  • Smaller settings can make the indicator more reactive to the price which means, more signals
  • Higher settings will remove the noise from the market at the risk of less trading signals
Read through this thread to see the various ways members have adjusted this setting to fit their strategy.​


How Does It Work?
Screenshot (178).png
Video Tutorial:


Best Time Frame for SuperTrend is:
5Min – 15Min – 30Min – 1Hr ( 5- 10 days Charts )
Aggregations under 5min have more false signals due to noise.
Sell signals on aggregations 4hr and higher can result in giving back profit.

What Indicators Pair Best With The SuperTrend Indicator
All trending strategies work best when combined with:
  • Trend/Momentum study: RSI or MACD, etc
  • Support & Resistance (can be hand-drawn or a study)
  • Volume
 
Last edited:
Its working great.. U always rocking...

"Paris: Here's SuperTrend MTF for those interested, from my archives - complete with notes posted at the time the study was released"

Code:
# SuperTrend Multiple Time Frames
# Mobius
# V03.01.2016

# I pulled this study down from MyTrade for a reason. It wasn't
# plotting correctly with the multiple aggregations. And like
# all studies with secondary aggregations it tends to replot the
# higher ones. I decided to think about it some more and this is
# where I am with the ST MTF study now.
#
# It's still squirrely and blinks a lot. Using declare Once_Per_Bar
# does some bad things to it. I was considering making intra
# aggregation higher time frames. A pain to do but it gives more
# control over how it plots.
#
# Row 6 is supposed to be the output for all aggregations and the
# signal line. After hours when data isn't moving it's steady and
# has good signals. But since it's after hours, totally useless
# for any intraday trading.

declare lower;

input agg1 = AggregationPeriod.Five_Min;
input agg2 = AggregationPeriod.Ten_Min;
input agg3 = AggregationPeriod.Fifteen_Min;
input agg4 = AggregationPeriod.Thirty_Min;
input agg5 = AggregationPeriod.Hour;
input AtrMult = .70;
input nATR = 4;
input AvgType = AverageType.HULL;

script ST{
input agg = AggregationPeriod.Five_Min;
input AtrMult = .70;
input nATR = 4;
input AvgType = AverageType.HULL;
def Fh = FundamentalType.High;
def Fl = FundamentalType.Low;
def Fc = FundamentalType.Close;
def Fhl2 = FundamentalType.HL2;
def h = Fundamental(Fh, period = agg);
def l = Fundamental(Fl, period = agg);
def c = Fundamental(Fc, period = agg);
def hl = Fundamental(Fhl2, period = agg);
def ATR = MovingAverage(AvgType, TrueRange(h, c, l), nATR);
def UP = hl + (AtrMult * ATR);
def DN = hl + (-AtrMult * ATR);
def S = if c < S[1]
        then Round(UP / tickSize(), 0) * tickSize()
        else Round(DN / tickSize(), 0) * tickSize();
plot ST = if c > S then 1 else 0;
}
def cl = close;
def x = isNaN(cl[2]) and !isNaN(cl[3]);
def FirstAgg = ST(agg = agg1, AtrMult = AtrMult, nATR = nATR, AvgType = AvgType);
plot FirstAggPlot = if isNaN(cl)
                    then double.nan
                    else 1;
FirstAggPlot.SetStyle(Curve.Points);
FirstAggPlot.SetLineWeight(3);
FirstAggPlot.AssignValueColor(if FirstAgg == 1
                              then color.green
                              else color.red);
AddChartBubble(x, 1, (agg1/1000/60) + " min", color.white, yes);
def SecondAgg = ST(agg = agg2, AtrMult = AtrMult, nATR = nATR, AvgType = AvgType);
plot SecondAggPlot = if isNaN(cl)
                     then double.nan
                     else 2;
SecondAggPlot.SetStyle(Curve.Points);
SecondAggPlot.SetLineWeight(3);
SecondAggPlot.AssignValueColor(if SecondAgg == 1
                               then color.green
                               else color.red);
AddChartBubble(x, 2, (agg2/1000/60) + " min", color.white, yes);
def ThirdAgg = ST(agg = agg3, AtrMult = AtrMult, nATR = nATR, AvgType = AvgType);
plot ThirdAggPlot = if isNaN(cl)
                    then double.nan
                    else 3;
ThirdAggPlot.SetStyle(Curve.Points);
ThirdAggPlot.SetLineWeight(3);
ThirdAggPlot.AssignValueColor(if ThirdAgg == 1
                              then color.green
                              else color.red);
AddChartBubble(x, 3, (agg3/1000/60) + " min", color.white, yes);
def FourthAgg = ST(agg = agg4, AtrMult = AtrMult, nATR = nATR, AvgType = AvgType);
plot FourthAggPlot = if isNaN(cl)
                     then double.nan
                     else 4;
FourthAggPlot.SetStyle(Curve.Points);
FourthAggPlot.SetLineWeight(3);
FourthAggPlot.AssignValueColor(if FourthAgg == 1
                               then color.green
                               else color.red);
AddChartBubble(x, 4, (agg4/1000/60) + " min", color.white, yes);
def FifthAgg = ST(agg = agg5, AtrMult = AtrMult, nATR = nATR, AvgType = AvgType);
plot FifthAggPlot = if isNaN(cl)
                    then double.nan
                    else 5;
FifthAggPlot.SetStyle(Curve.Points);
FifthAggPlot.SetLineWeight(3);
FifthAggPlot.AssignValueColor(if FifthAgg == 1
                              then color.green
                              else color.red);
AddChartBubble(x, 5, (agg5/1000/60)+ " min", color.white, yes);
plot Six = if isNaN(cl)
           then double.nan
           else 6;
Six.SetStyle(Curve.Points);
Six.SetLineWeight(3);
Six.AssignValueColor(if FirstAgg and
                        SecondAgg and
                        ThirdAgg and
                        FourthAgg and
                        FifthAgg
                     then color.green
                     else if !FirstAgg and
                             !SecondAgg and
                             !ThirdAgg and
                             !FourthAgg and
                             !FifthAgg
                          then color.red
                     else color.black);
# End Code ST MTF
 
Last edited:
I use the scanner each trading day. The code is written to show new signals

#plot SuperTrendUP = if ST crosses below close then 1 else 0;

plot SuperTrendDN = if ST crosses above close then 1 else 0;

If you want to show active signals use the following;

plot SuperTrendUP = if ST < close then 1 else 0;

plot SuperTrendDN = if ST >close then 1 else 0;

 
Last edited:
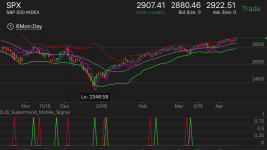
Also - in an attempt to give back. I've ported the supertrend script so that it works on mobile. It involves two scripts - one for the supertrend plot, and one for the signal. As far as I know, you cannot paint the candles like you can on your pc version of TOS. Anyway, screenshots from PC and mobile (to compare) and scripts below for your use.

52yIJN6.jpg


jhioeoy.png


Mobile Plot: https://tos.mx/q2gNki

Mobile Signal: https://tos.mx/72pAl6

Sorry - I left my bollinger bands on in that shot.


Attachments

  • 52yIJN6.jpg
    52yIJN6.jpg
    57.8 KB · Views: 690
  • jhioeoy.png
    jhioeoy.png
    195.6 KB · Views: 664
Last edited:
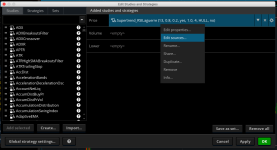
I tried this one but i only want the color candles, not the grey bubbles & plot line. So i unticked both plot & bubbles in settings but only the plot line hides but the bubbles are still present. How do i get rid of them?
 
@zeek Left-click on the name of your indicator > Edit sources

hSVOxRg.png
 

Attachments

  • hSVOxRg.png
    hSVOxRg.png
    114.1 KB · Views: 539
@corello Put this together when I was on the go. See if it works. Add it to the bottom of the indicator.

Code:
def bullish = close crosses below ST;
def bearish = close crosses above ST;

# Alerts
Alert(bullish, " ", Alert.Bar, Sound.Chimes);
Alert(bearish, " ", Alert.Bar, Sound.Bell);
 
@BenTen Are you able to backtest this strategy with ThinkorSwim? Would like to see how it would work with ES future for example over a certain time period.

Unsure of how to make a backtest of this strategy, so any help would be great.

Thanks in advance.
 
@corello Here is the code for that. It comes in 2 parts.

Step 1: Create a new Strategy (not a Study) > Copy and Paste the original code in the first page into it.

Step 2: Add the following code to the end of the script:

Code:
# The following code is for backtesting
def SuperTrendUP = if ST crosses below close then 1 else 0;
def SuperTrendDN = if ST crosses above close then 1 else 0;

Step 3a: If you want to test out bullish strategy then add this code after the code from Step 2:

Code:
# Bullish Orders
AddOrder(OrderType.BUY_TO_OPEN, condition = SuperTrendUp, price = close,100, tickcolor = Color.GREEN, arrowcolor = Color.GREEN, name = "BUY");
AddOrder(OrderType.SELL_TO_CLOSE, condition = SuperTrendDN, price = open,100, tickcolor = Color.RED, arrowcolor = Color.RED, name = "SELL");

Step 3b: If you want to test out bearish strategy then add this code after the code from Step 2:

Code:
# Bearish Orders
AddOrder(OrderType.SELL_TO_OPEN, condition = SuperTrendDN, price = open,100, tickcolor = Color.RED, arrowcolor = Color.RED, name = "SELL");
AddOrder(OrderType.BUY_TO_CLOSE, condition = SuperTrendUp, price = close,100, tickcolor = Color.GREEN, arrowcolor = Color.GREEN, name = "BUY");

Do not place both codes from 3a and 3b into the same script.
 
@San If you want to remove the bubble, delete the following lines from the code:

Rich (BB code):
AddChartBubble(close crosses below ST, low[1], low[1], color.Dark_Gray);
AddChartBubble(close crosses above ST, high[1], high[1], color.Dark_Gray, no);
Hello, BenTen, can you please modify the code for Bubble to move it slightly lower or higher (depending on situation), otherwise its just sits on candle and is hard to read on some charts.
Thanks in advance
 
@Talochka @BenTen I have adjusted the bubbles, fixed the coloring and added a buy/sell description on the bubble
Note that the bubbles can be further moved to your preference by changing the value of the variable "n"
You can do this either in the code directly or via the input selector in the user interface
Hope this would be aesthetically better visually.

EDIT: I have based my modifications based on @BenTen post #1 in this thread

Code:
# SuperTrend
# Mobius
# Chat Room Request
# 11.20.2019 tomsk Enhanced and adjusted bubbles with coloring and description tag

input AtrMult = 1.0;
input nATR = 4;
input AvgType = AverageType.HULL;
input PaintBars = yes;
input n = 0;
def n1  = n + 1;
def ATR = MovingAverage(AvgType, TrueRange(high, close, low), nATR);
def UP = HL2 + (AtrMult * ATR);
def DN = HL2 + (-AtrMult * ATR);
def ST = if close < ST[1] then UP else DN;
plot SuperTrend = ST;
SuperTrend.AssignValueColor(if close < ST then Color.RED else Color.GREEN);
AssignPriceColor(if PaintBars and close < ST
                 then Color.RED
                 else if PaintBars and close > ST
                      then Color.GREEN
                      else Color.CURRENT);

AddChartBubble(close[n] crosses below ST[n], low[n+1] + TickSize() * n, "Sell @ " + low[n1], color.Cyan, yes);
AddChartBubble(close[n] crosses above ST[n], high[n+1] - TickSize() * n, "Buy @ " + high[n1], color.Yellow, no);

# End Code SuperTrend
 
Last edited:
Code:
# SuperTrend - "Strategy"     A Very simple SuperTrend Strategy
# Chat Room Request
# V03.10.2015
#Hint:Supertrend Indicator: shows trend direction and gives buy or sell signals according to that. 

input AtrMult = .70;
input nATR = 4;
input AvgType = AverageType.HULL;
input PaintBars = yes;
input BubbleOn = yes;
input ShowLabel = yes;

def h = high;
def l = low;
def c = close;
def v = volume;
def bar = barNumber();
def EOD = if SecondsTillTime(1545) == 0 and
             SecondsFromTime(1545) == 0
          then 1
          else 0;
def NotActive = if SecondsFromTime(1545) > 0
                then 1
                else 0;
def ATR = MovingAverage(AvgType, TrueRange(h, c, l), nATR);
def UP = HL2 + (AtrMult * ATR);
def DN = HL2 + (-AtrMult * ATR);
def ST = if c < ST[1] 
         then UP 
         else DN;
plot SuperTrend = ST;
SuperTrend.AssignValueColor(if c < ST then Color.RED else Color.GREEN);
SuperTrend.SetPaintingStrategy(PaintingStrategy.Line);
AssignPriceColor(if PaintBars and c < ST 
                 then Color.RED 
                 else if PaintBars and c > ST 
                      then Color.GREEN 
                      else Color.CURRENT);

AddOrder(OrderType.BUY_AUTO, HL2 crosses above ST, price = open[-1], tickcolor = Color.BLACK, arrowcolor = Color.BLACK, name = "");
AddOrder(OrderType.SELL_AUTO, HL2 crosses below ST, price = open[-1], tickcolor = Color.BLACK, arrowcolor = Color.BLACK, name = "");
 
Last edited by a moderator:
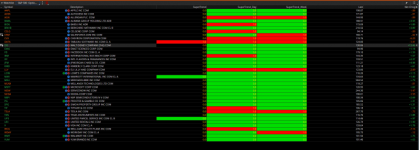
@dougn As you requested, here is the very last version of the SuperTrend Watchlist that Mobius posted

Code:
# SuperTrend for WatchList
# Mobius
# 8.8.2017

input AtrMult = .7;
input nATR = 4;
input AvgType = AverageType.Hull;

def h = high;
def l = low;
def c = close;
def ATR = MovingAverage(AvgType, TrueRange(h, c, l), nATR);
def UP = hl2 + (ATRmult * ATR);
def DN = hl2 + (-ATRmult * ATR);
def ST = if c < ST[1] 
         then Round(UP / TickSize(), 0) * TickSize()
         else Round(DN / TickSize(), 0) * TickSize();
def count = if c crosses below ST
            then 1 
            else if c < ST
                 then count[1] + 1
                 else if c crosses above ST
                      then 1
                      else if c > ST[1]
                           then count[1] + 1
                           else count[1];
AddLabel(1, count, color.black);
AssignBackgroundColor(if c < ST 
                      then Color.Red 
                      else Color.Green);
 
Hello, this indicator is created by morbius; the super trend indicator. I have modified it so that it creates chimes and dots (which can be changed to anything you prefer such as wedges, arrows, or nothing).

The best settings are 0.7 atr multiplier and thats it.

I have been granted 100% permission by morbius himself, the original creator of super trend, to re-release this code for free. This is not my algo.

here is the code.

Code:
# Mobius
# SuperTrend
# Chat Room Request
input AtrMult = 1.0;
input nATR = 4;
input AvgType = AverageType.HULL;
input PaintBars = yes;
def ATR = MovingAverage(AvgType, TrueRange(high, close, low), nATR);
def UP = HL2 + (AtrMult * ATR);
def DN = HL2 + (-AtrMult * ATR);
def ST = if close < ST[1] then UP else DN;
plot SuperTrend = ST;

SuperTrend.AssignValueColor(if close < ST then Color.GREEN else color.RED);

AssignPriceColor(if PaintBars and close < ST

                 then Color.RED

                 else if PaintBars and close > ST

                      then Color.GREEN

                      else Color.CURRENT);

#AddChartBubble(close crosses below ST, low[1], low[1], #color.Dark_Gray);
#AddChartBubble(close crosses above ST, high[1], high[1], #color.Dark_Gray, no);
# End Code SuperTrend# Mobius
# SuperTrend
# Chat Room Request

plot SuperTrendUp = close crosses above ST;
plot SuperTrendDown = close crosses below ST;
SuperTrend.AssignValueColor(if close < ST then Color.RED else Color.GREEN);
SuperTrendUp.SetDefaultColor(Color.YELLOW);
SuperTrendUp.setPaintingStrategy(PaintingStrategy.BOOLEAN_ARROW_UP);
SuperTrendDown.SetDefaultColor(Color.PINK);
SuperTrendDown.setPaintingStrategy(PaintingStrategy.BOOLEAN_ARROW_DOWN);

def bullish = close crosses below ST;
def bearish = close crosses above ST;

# Alerts
Alert(bullish, " ", Alert.Bar, Sound.Chimes);
Alert(bearish, " ", Alert.Bar, Sound.Bell);
 
Screenshot (179).png

Everything You Want To Know About SuperTrend Indicators And Were Afraid To Ask.
Study and scanner found in Post#1 https://usethinkscript.com/threads/supertrend-indicator-by-mobius-for-thinkorswim.7/#post-12
Install instructions: https://usethinkscript.com/threads/how-to-import-existing-thinkscript-code-on-thinkorswim.10/
Start out with extended hours off.

Screenshot (85).png


What Is The Supertrend Indicator
Screenshot (175).png
1. How can you tell if you are in a trending market and avoid false signals?​
Use three time frames to decipher the long, medium, and short-term trends.​
2. Which timeframes you ask? Here is a summary of how to determine what timeframes to use:​
Screenshot (177).png
The indicator does well with the default multiplier setting. There is no best setting for any trading indicator.​
  • Smaller settings can make the indicator more reactive to the price which means, more signals
  • Higher settings will remove the noise from the market at the risk of less trading signals
Read through this thread to see the various ways members have adjusted this setting to fit their strategy.​


How Does It Work?
Screenshot (178).png
Video Tutorial:


Best Time Frame for SuperTrend is:
5Min – 15Min – 30Min – 1Hr ( 5- 10 days Charts )
Aggregations under 5min have more false signals due to noise.
Sell signals on aggregations 4hr and higher can result in giving back profit.

What Indicators Pair Best With The SuperTrend Indicator
All trending strategies work best when combined with:
  • Trend/Momentum study: RSI or MACD, etc
  • Support & Resistance (can be hand-drawn or a study)
  • Volume
@bennyRA
 
Hi everyone, is there a version of supertrend that has the auto buy and sell with the profit/loss floating box , so you can backtest the strategy and see the outcome?

You can try this template I use for my studies, pieced it together and modified it from here and there, most from linus' SuperCombo. Basically, just plug in what triggers your buy and sell signals (and stops if you use them) and it will put a bar on top with your overall p/l for the given timeframe. This isn't a strategy so a report isn't given, but it does give a quick p/l so you can change settings and instantly see the effect. Note, this won't account for any fees or commissions, so if doing futures, have to take off the fees per order.

XB5HSmK.png


Code:
input showSignals = yes;
input showLabels  = yes;
input showBubbles = yes;
input useStops = no;

############################################
##  Create Signals - FILL IN THIS SECTION
############################################


def BuySignal  ; # insert condition to create long position
def SellSignal ; # insert condition to create short position
def BuyStop  = if !useStops then 0 else 0  ; # insert condition to stop in place of the 0 after else
def SellStop = if !useStops then 0 else 0  ; # insert condition to stop in place of the 0 after else


#######################################
##  Maintain the position of trades
#######################################

def CurrentPosition;  # holds whether flat = 0 long = 1 short = -1

if (BarNumber()==1) OR isNaN(CurrentPosition[1]) {
    CurrentPosition = 0;
}else{
        if CurrentPosition[1] == 0 {            # FLAT
            if (BuySignal) {
                CurrentPosition = 1;
            } else if (SellSignal){
                CurrentPosition = -1;
            } else {
                CurrentPosition = CurrentPosition[1];
            }
       } else if CurrentPosition[1] == 1 {      # LONG
            if (SellSignal){
                CurrentPosition = -1;
            } else if (BuyStop){
                CurrentPosition = 0;
            } else {
                CurrentPosition = CurrentPosition[1];
            }
       } else if CurrentPosition[1] == -1 {     # SHORT
            if (BuySignal){
                CurrentPosition = 1;
            } else if (SellStop){
                CurrentPosition = 0;
            } else {
                CurrentPosition = CurrentPosition[1];
            }
       } else {
            CurrentPosition = CurrentPosition[1];
       }
}

def isLong  = if CurrentPosition == 1 then 1 else 0;
def isShort = if CurrentPosition == -1 then 1 else 0;
def isFlat  = if CurrentPosition == 0 then 1 else 0;

#######################################
##  Plot the Signals
#######################################

Plot BuySig = if (!isLong[1] and BuySignal and showSignals) then 1 else 0;
BuySig.AssignValueColor(color.yellow);
BuySig.SetPaintingStrategy(PaintingStrategy.BOOLEAN_ARROW_UP);
BuySig.SetLineWeight(3);

Plot SellSig = if (!isShort[1] and SellSignal and showSignals) then 1 else 0;
SellSig.AssignValueColor(color.white);
SellSig.SetPaintingStrategy(PaintingStrategy.BOOLEAN_ARROW_DOWN);
SellSig.SetLineWeight(3);

Plot BuyStpSig = if (BuyStop and isLong[1] and showSignals) then 1 else 0;
BuyStpSig.AssignValueColor(color.gray);
BuyStpSig.SetPaintingStrategy(PaintingStrategy.BOOLEAN_ARROW_DOWN);
BuyStpSig.SetLineWeight(3);

Plot SellStpSig = if (SellStop and isShort[1] and showSignals) then 1 else 0;
SellStpSig.AssignValueColor(color.gray);
SellStpSig.SetPaintingStrategy(PaintingStrategy.BOOLEAN_ARROW_UP);
SellStpSig.SetLineWeight(3);


#######################################
##  Orders
#######################################

def isOrder = if CurrentPosition == CurrentPosition[1] then 0 else 1; # Status changed so it's a new order
def orderPrice = if (isOrder and (BuySignal or SellSignal)) then open[-1] else orderPrice[1];


#######################################
##  Price and Profit
#######################################

def profitLoss;

if (!isOrder){
    profitLoss = 0;
} else if ((isOrder and isLong[1]) and (SellSig or BuyStpSig)){
    profitLoss = close - orderPrice[1];
} else if ((isOrder and isShort[1]) and (BuySig or SellStpSig)) {
    profitLoss = orderPrice[1] - close;
} else {
    profitLoss = 0;
}

def profitLossSum = compoundValue(1, if isNaN(isOrder) then 0 else if isOrder then profitLossSum[1] + profitLoss else profitLossSum[1], 0);
def profitWinners = compoundValue(1, if isNaN(isOrder) then 0 else if isOrder and profitLoss > 0 then profitWinners[1] + 1 else profitWinners[1], 0);
def profitLosers = compoundValue(1, if isNaN(isOrder) then 0 else if isOrder and profitLoss < 0 then profitLosers[1] + 1 else profitLosers[1], 0);
def profitPush = compoundValue(1, if isNaN(isOrder) then 0 else if isOrder and profitLoss == 0 then profitPush[1] + 1 else profitPush[1], 0);
def TradePL = If isLong then Round(((close - orderprice)/TickSize())*TickValue()) else if isShort then Round(((orderPrice - close)/TickSize())*TickValue()) else 0; # current trade p/l
def dollarProfitLoss = round((profitLoss/Ticksize())*Tickvalue()); # per trade for chart bubbles
def biggestWin = compoundValue(1, if isNaN(isOrder) then 0 else if isOrder and (dollarProfitLoss > 0) and (dollarProfitLoss > biggestWin[1]) then dollarProfitLoss else biggestWin[1], 0);
def biggestLoss = compoundValue(1, if isNaN(isOrder) then 0 else if isOrder and (dollarProfitLoss < 0) and (dollarProfitLoss < biggestLoss[1]) then dollarProfitLoss else biggestLoss[1], 0);

def orderCount = (profitWinners+profitLosers+profitPush);
def PCTWin = round((profitWinners/orderCount)*100,2);

#######################################
##  Create Labels
#######################################

AddLabel(yes, GetSymbol()+" Tick Size: "+TickSize()+" Value: "+TickValue(), color.white);
AddLabel(showSignals and showLabels, "Orders: " + orderCount + " P/L: " + AsDollars(profitLossSum), if profitLossSum > 0 then Color.GREEN else if profitLossSum < 0 then Color.RED else Color.GRAY);
AddLabel(yes, "Winners: "+ PCTWin +"%",if PCTWin > 50 then color.green else if PCTWin > 40 then color.yellow else color.gray);
AddLabel(yes, "MaxUp: "+ AsDollars(biggestWin) +" MaxDown: "+AsDollars(biggestLoss), color.white);
AddLabel(if !IsNan(CurrentPosition) then 1 else 0, "Current: "+ (If isLong then "Bought" else "Sold") + " @ "+orderPrice, color.white);
AddLabel(if !IsNan(orderPrice) then 1 else 0, "Trade P/L: "+ AsDollars(TradePL), if (TradePL > 0) then color.green else if (TradePl < 0) then color.red else color.gray);

#######################################
##  Chart Bubbles for Profit/Loss
#######################################

AddChartBubble(showSignals and showBubbles and isOrder and isLong[1], low, "$"+dollarProfitLoss, if dollarProfitLoss == 0 then Color.LIGHT_GRAY else if dollarProfitLoss > 0 then Color.GREEN else color.Red, 1);
AddChartBubble(showSignals and showBubbles and isOrder and isShort[1], high,  "$"+dollarProfitLoss, if dollarProfitLoss == 0 then Color.LIGHT_GRAY else if dollarProfitLoss > 0 then Color.GREEN else color.Red, 0);
 
Last edited:

Join useThinkScript to post your question to a community of 21,000+ developers and traders.

Similar threads

Not the exact question you're looking for?

Start a new thread and receive assistance from our community.

87k+ Posts
340 Online
Create Post

Similar threads

Similar threads

The Market Trading Game Changer

Join 2,500+ subscribers inside the useThinkScript VIP Membership Club
  • Exclusive indicators
  • Proven strategies & setups
  • Private Discord community
  • ‘Buy The Dip’ signal alerts
  • Exclusive members-only content
  • Add-ons and resources
  • 1 full year of unlimited support

Frequently Asked Questions

What is useThinkScript?

useThinkScript is the #1 community of stock market investors using indicators and other tools to power their trading strategies. Traders of all skill levels use our forums to learn about scripting and indicators, help each other, and discover new ways to gain an edge in the markets.

How do I get started?

We get it. Our forum can be intimidating, if not overwhelming. With thousands of topics, tens of thousands of posts, our community has created an incredibly deep knowledge base for stock traders. No one can ever exhaust every resource provided on our site.

If you are new, or just looking for guidance, here are some helpful links to get you started.

What are the benefits of VIP Membership?
VIP members get exclusive access to these proven and tested premium indicators: Buy the Dip, Advanced Market Moves 2.0, Take Profit, and Volatility Trading Range. In addition, VIP members get access to over 50 VIP-only custom indicators, add-ons, and strategies, private VIP-only forums, private Discord channel to discuss trades and strategies in real-time, customer support, trade alerts, and much more. Learn all about VIP membership here.
How can I access the premium indicators?
To access the premium indicators, which are plug and play ready, sign up for VIP membership here.
Back
Top