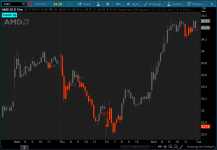
People seem to really like the RSI Laguerre that @markos shared and SuperTrend is another popular indicator on our site. Why not combine both into a single indicator?
The indicator you see below isn't just about adding SuperTrend and RSI Laguerre into one script to save space. They actually work together to produce buy and sell signals.

The indicator you see below isn't just about adding SuperTrend and RSI Laguerre into one script to save space. They actually work together to produce buy and sell signals.
thinkScript Code
Code:
# CSA Nube (RSI Laguerre, SuperTrend)
# Nube
# 8.28.2016

# When RSI Laguerre is combined with SuperTrend, if this study plots a
# line and ST changes that bar or the next one, then it seems to be a
# decent entry.
#
# After making this observation, I'm tentatively going to scrap the momentum
# study (VACD) and just use the Laguerre RSI to decide trend and the
# Supertrend for entry. I think something along the lines of attaching that
# to RSI will be enough to decide direction and then just flag the switchover
# between up and down in ST

# RSI in Laguerre Time Self Adjusting With Fractal Energy
# Mobius
# V02.07.2014
# V03.06.15.2016
# Both Fractal Energy and RSI are plotted. RSI in cyan and FE in yellow. Look for trend exhaustion in the FE and a reversal of RSI or Price compression in FE and an RSI reversal.

#Inputs:
input nFE = 13;#hint nFE: length for Fractal Energy calculation.
input Overbought = 0.80;
input Oversold = 0.20;
Input Label = Yes;
# Variables:
def o;
def h;
def l;
def c;
def CU1;
def CU2;
def CU;
def CD1;
def CD2;
def CD;
def L0;
def L1;
def L2;
def L3;
def RSI;
def OS;
def OB;

# Calculations
o = (open + close[1]) / 2;
h = Max(high, close[1]);
l = Min(low, close[1]);
c = (o + h + l + close) / 4;
def gamma = Log(Sum((Max(high, close[1]) - Min(low, close[1])), nFE) /
        (Highest(high, nFE) - Lowest(low, nFE)))
            / Log(nFE);

L0 = (1 – gamma) * c + gamma * L0[1];
L1 = -gamma * L0 + L0[1] + gamma * L1[1];
L2 = -gamma * L1 + L1[1] + gamma * L2[1];
L3 = -gamma * L2 + L2[1] + gamma * L3[1];
if L0 >= L1
then {
    CU1 = L0 - L1;
    CD1 = 0;
} else {
    CD1 = L1 - L0;
    CU1 = 0;
}
if L1 >= L2
then {
    CU2 = CU1 + L1 - L2;
    CD2 = CD1;
} else {
    CD2 = CD1 + L2 - L1;
    CU2 = CU1;
}
if L2 >= L3
then {
    CU = CU2 + L2 - L3;
    CD = CD2;
} else {
    CU = CU2;
    CD = CD2 + L3 - L2;
}

RSI = if CU + CD <> 0 then CU / (CU + CD) else 0;
OS = if IsNaN(close) then Double.NaN else Oversold;
OB = if IsNaN(close) then Double.NaN else Overbought;


# Mobius
# SuperTrend
# Chat Room Request
# V03.10.2015

input AtrMult = 1.0;
input nATR = 4;
input AvgType = AverageType.HULL;
input PaintBars = no;

def ATR = MovingAverage(AvgType, TrueRange(high, close, low), nATR);
def UP = HL2 + (AtrMult * ATR);
def DN = HL2 + (-AtrMult * ATR);
def ST = if close < ST[1] then UP else DN;
def SuperTrend = ST;

AssignPriceColor(if PaintBars and close < ST
                then GetColor(5)
                else if PaintBars and close > ST
                     then GetColor(7)
                     else Color.CURRENT);

# End Code SuperTrend

def UT = sum(RSI>OB,20);
def DT = sum(RSI<OS,20);

plot Buy = if UT>DT and close > ST and close[1] < ST[1] then close else Double.Nan;
Buy.SetDefaultColor(GetColor(7));
Buy.SetPaintingStrategy(PaintingStrategy.VALUES_BELOW);

plot Sell = if UT<DT and close < ST and close[1] > ST[1] then close else Double.Nan;
Sell.SetDefaultColor(GetColor(5));
Sell.SetPaintingStrategy(PaintingStrategy.VALUES_ABOVE);

AddLabel(Label, "Trend: " + if UT>DT then "Up" else if UT<DT then "Down" else "None", if UT>DT then GetColor(1) else if UT<DT then GetColor(5) else GetColor(3));

# End Study
