shared scan link: http://tos.mx/ettTzEc Click here for --> Easiest way to load shared linkscan you share a link to this scanner?
shared scan link: http://tos.mx/ettTzEc Click here for --> Easiest way to load shared linkscan you share a link to this scanner?
Join useThinkScript to post your question to a community of 21,000+ developers and traders.
1-4-1 so far, Mikey likes itIts working great.. U always rocking...
"Paris: Here's SuperTrend MTF for those interested, from my archives - complete with notes posted at the time the study was released"
Code:# SuperTrend Multiple Time Frames # Mobius # V03.01.2016 # I pulled this study down from MyTrade for a reason. It wasn't # plotting correctly with the multiple aggregations. And like # all studies with secondary aggregations it tends to replot the # higher ones. I decided to think about it some more and this is # where I am with the ST MTF study now. # # It's still squirrely and blinks a lot. Using declare Once_Per_Bar # does some bad things to it. I was considering making intra # aggregation higher time frames. A pain to do but it gives more # control over how it plots. # # Row 6 is supposed to be the output for all aggregations and the # signal line. After hours when data isn't moving it's steady and # has good signals. But since it's after hours, totally useless # for any intraday trading. declare lower; input agg1 = AggregationPeriod.Five_Min; input agg2 = AggregationPeriod.Ten_Min; input agg3 = AggregationPeriod.Fifteen_Min; input agg4 = AggregationPeriod.Thirty_Min; input agg5 = AggregationPeriod.Hour; input AtrMult = .70; input nATR = 4; input AvgType = AverageType.HULL; script ST{ input agg = AggregationPeriod.Five_Min; input AtrMult = .70; input nATR = 4; input AvgType = AverageType.HULL; def Fh = FundamentalType.High; def Fl = FundamentalType.Low; def Fc = FundamentalType.Close; def Fhl2 = FundamentalType.HL2; def h = Fundamental(Fh, period = agg); def l = Fundamental(Fl, period = agg); def c = Fundamental(Fc, period = agg); def hl = Fundamental(Fhl2, period = agg); def ATR = MovingAverage(AvgType, TrueRange(h, c, l), nATR); def UP = hl + (AtrMult * ATR); def DN = hl + (-AtrMult * ATR); def S = if c < S[1] then Round(UP / tickSize(), 0) * tickSize() else Round(DN / tickSize(), 0) * tickSize(); plot ST = if c > S then 1 else 0; } def cl = close; def x = isNaN(cl[2]) and !isNaN(cl[3]); def FirstAgg = ST(agg = agg1, AtrMult = AtrMult, nATR = nATR, AvgType = AvgType); plot FirstAggPlot = if isNaN(cl) then double.nan else 1; FirstAggPlot.SetStyle(Curve.Points); FirstAggPlot.SetLineWeight(3); FirstAggPlot.AssignValueColor(if FirstAgg == 1 then color.green else color.red); AddChartBubble(x, 1, (agg1/1000/60) + " min", color.white, yes); def SecondAgg = ST(agg = agg2, AtrMult = AtrMult, nATR = nATR, AvgType = AvgType); plot SecondAggPlot = if isNaN(cl) then double.nan else 2; SecondAggPlot.SetStyle(Curve.Points); SecondAggPlot.SetLineWeight(3); SecondAggPlot.AssignValueColor(if SecondAgg == 1 then color.green else color.red); AddChartBubble(x, 2, (agg2/1000/60) + " min", color.white, yes); def ThirdAgg = ST(agg = agg3, AtrMult = AtrMult, nATR = nATR, AvgType = AvgType); plot ThirdAggPlot = if isNaN(cl) then double.nan else 3; ThirdAggPlot.SetStyle(Curve.Points); ThirdAggPlot.SetLineWeight(3); ThirdAggPlot.AssignValueColor(if ThirdAgg == 1 then color.green else color.red); AddChartBubble(x, 3, (agg3/1000/60) + " min", color.white, yes); def FourthAgg = ST(agg = agg4, AtrMult = AtrMult, nATR = nATR, AvgType = AvgType); plot FourthAggPlot = if isNaN(cl) then double.nan else 4; FourthAggPlot.SetStyle(Curve.Points); FourthAggPlot.SetLineWeight(3); FourthAggPlot.AssignValueColor(if FourthAgg == 1 then color.green else color.red); AddChartBubble(x, 4, (agg4/1000/60) + " min", color.white, yes); def FifthAgg = ST(agg = agg5, AtrMult = AtrMult, nATR = nATR, AvgType = AvgType); plot FifthAggPlot = if isNaN(cl) then double.nan else 5; FifthAggPlot.SetStyle(Curve.Points); FifthAggPlot.SetLineWeight(3); FifthAggPlot.AssignValueColor(if FifthAgg == 1 then color.green else color.red); AddChartBubble(x, 5, (agg5/1000/60)+ " min", color.white, yes); plot Six = if isNaN(cl) then double.nan else 6; Six.SetStyle(Curve.Points); Six.SetLineWeight(3); Six.AssignValueColor(if FirstAgg and SecondAgg and ThirdAgg and FourthAgg and FifthAgg then color.green else if !FirstAgg and !SecondAgg and !ThirdAgg and !FourthAgg and !FifthAgg then color.red else color.black); # End Code ST MTF
Is it possible to change the chart bubbles to arrows instead?
#/ This source code is subject to the terms of the Mozilla Public License 2.0 at https://mozilla.org/MPL/2.0/
#// © wielkieef
#study("Smart SuperTrend", overlay = true)
# Converted by Sam4Cok@samer800 - 01/2023
#//INPUTS
input BarColor = no;
input CloudLines = yes;
input src = hl2;
input ppPeriod = 2; # "PP period"
input atrFactor = 3; # "ATR Factor"
input atrPeriod = 10; # "ATR Period"
input CloudLength = 12; # "Cloud Length"
input ADX_options = {default CLASSIC, MASANAKAMURA}; # "ADX OPTION"
input adxLenght = 14;# "ADX Lenght"
input adxThreshold = 20;# "ADX Treshold"
input closeBars = 2; # Closed bars that have to exceed the ST value before the trend reversal is confirmed

#//INDICATORS
def na = Double.NaN;
def bar = BarNumber();
def h = high;
def l = low;
def c = close;
def adxOps = ADX_options == ADX_options.CLASSIC;

script nz {
input data = close;
input rep = 0;
def repl = rep;
def ret_val = if (isNaN(data) or !data) then repl else data;
plot return = ret_val;
}
script fixnan {
input source = close;
def fix = if !IsNaN(source) then source else fix[1];
plot result = fix;
}
script FindPivots {
input dat = close; # default data or study being evaluated
input HL = 0; # default high or low pivot designation, -1 low, +1 high
input lbL = 5; # default Pivot Lookback Left
input lbR = 1; # default Pivot Lookback Right
##############
def _nan; # used for non-number returns
def _BN; # the current barnumber
def _VStop; # confirms that the lookforward period continues the pivot trend
def _V; # the Value at the actual pivot point
##############
_BN = BarNumber();
_nan = Double.NaN;
_VStop = if !IsNaN(dat) and lbR > 0 and lbL > 0 then
fold a = 1 to lbR + 1 with b=1 while b do
if HL > 0 then dat > GetValue(dat, -a) else dat < GetValue(dat, -a) else _nan;
if (HL > 0) {
_V = if _BN > lbL and dat == Highest(dat, lbL + 1) and _VStop
then dat else _nan;
} else {
_V = if _BN > lbL and dat == Lowest(dat, lbL + 1) and _VStop
then dat else _nan;
}
plot result = if !IsNaN(_V) and _VStop then _V else _nan;
}
#calcADX(_len) =>
script calcADX {
input _len = 10;
def na = Double.NaN;
def tr = TrueRange(high, close, low);
def up = (high - high[1]);
def down = -(low - low[1]);
def plusDM = if IsNaN(up) then na else (if up > down and up > 0 then up else 0);
def minusDM = if IsNaN(down) then na else (if down > up and down > 0 then down else 0);
def truerange = WildersAverage(tr, _len);
def _plus = fixnan(100 * WildersAverage(plusDM, _len) / truerange);
def _minus = fixnan(100 * WildersAverage(minusDM, _len) / truerange);
def sum = _plus + _minus;
def _adx = 100 * WildersAverage(AbsValue(_plus - _minus) / (if sum == 0 then 1 else sum), _len);
plot plus = _plus;
plot minus = _minus;
plot adx = _adx;
}
#calcADX_Masanakamura(_len) =>
script calcADX_Masanakamura {
input _len = 10;
def SmoothedTrueRange;
def SmoothedDirectionalMovementPlus;
def SmoothedDirectionalMovementMinus;
def tr = TrueRange(high, close, low);
def DirectionalMovementPlus = if (high - high[1]) > (low[1] - low) then Max((high - high[1]), 0) else 0;
def DirectionalMovementMinus = if (low[1] - low) > (high - high[1]) then Max((low[1] - low), 0) else 0;
SmoothedTrueRange = nz(SmoothedTrueRange[1]) - (nz(SmoothedTrueRange[1]) / _len) + tr;
SmoothedDirectionalMovementPlus = nz(SmoothedDirectionalMovementPlus[1]) - (nz(SmoothedDirectionalMovementPlus[1])
/ _len) + DirectionalMovementPlus;
SmoothedDirectionalMovementMinus = nz(SmoothedDirectionalMovementMinus[1]) - (nz(SmoothedDirectionalMovementMinus[1])
/ _len) + DirectionalMovementMinus;
def DP = SmoothedDirectionalMovementPlus / SmoothedTrueRange * 100;
def DM = SmoothedDirectionalMovementMinus / SmoothedTrueRange * 100;
def DX = AbsValue(DP - DM) / (DP + DM) * 100;
def AX = SimpleMovingAvg(DX, _len);
plot DIP = DP;
plot DIM = DM;
plot ADX = AX;
}
#computeAlpha(src, fastLimit, slowLimit) =>
script computeAlpha {
input src = close;
input fastLimit = 0.5;
input slowLimit = 0.05;
def PI = 2 * ASin(1);
def Period;
def detrender;
def smooth;
def I2;
def Q2;
def phase;
def mesaPeriodMult = 0.075 * nz(Period[2], Period[1]) + 0.54;
# // Calc
smooth = (4 * src + 3 * nz(src[1], src) + 2 * nz(src[2], src) + nz(src[3], src)) / 10;
detrender = (0.0962 * smooth + 0.5769 * nz(smooth[2], smooth) - 0.5769 * nz(smooth[4], smooth) -
0.0962 * nz(smooth[6], smooth)) * (0.075 * nz(Period[1]) + 0.54);
# // Compute InPhase and Quadrature components
def I1 = nz(detrender[3], detrender);
def Q1 = (0.0962 * detrender + 0.5769 * nz(detrender[2], detrender) - 0.5769 * nz(detrender[4], detrender) -
0.0962 * nz(detrender[6], detrender)) * (.075 * nz(Period[1], detrender) + 0.54);
# // Advance the phase of I1 and Q1 by 90 degrees
def jI = (.0962 * I1 + .5769 * nz(I1[2], I1) - .5769 * nz(I1[4], I1) - .0962 * nz(I1[6], I1)) * (.075 * nz(Period[1]) + 0.54);
def jQ = (.0962 * Q1 + .5769 * nz(Q1[2], Q1) - .5769 * nz(Q1[4], Q1) - .0962 * nz(Q1[6], Q1)) * (.075 * nz(Period[1]) + 0.54);
# // Phasor addition for 3 bar averaging
def I22 = I1 - jQ;
def Q22 = Q1 + jI;
# // Smooth the I and Q components before applying the discriminator
I2 = if IsNaN(I2[1]) then I22 else 0.2 * I2[1] + 0.8 * nz(I2[2], I2[1]);
Q2 = if IsNaN(Q2[1]) then Q22 else 0.2 * Q2[1] + 0.8 * nz(Q2[2], Q2[1]);
# // Homodyne Discriminator
def Re1 = I2 * nz(I2[1], I2) + Q2 * nz(Q2[1], Q2);
def Im1 = I2 * nz(Q2[1], Q2) - Q2 * nz(I2[1], I2);
def Re = if IsNaN(Re[1]) then Re1 else 0.2 * Re[1] + 0.8 * nz(Re[2], Re[1]);
def Im = if IsNaN(Im[1]) then Im1 else 0.2 * Im[1] + 0.8 * nz(Im[2], Im[1]);
#def mesaPeriod1;
if Re != 0 and Im != 0 {
Period = 2 * PI / ATan(Im / Re);
} else {
if Period[1] <= 1.5 * nz(Period[2], Period[1]) {
Period = Period[1];
} else {
if Period[1] >= 0.67 * nz(Period[2], Period[1]) {
Period = Period[1];
} else
if Max(Period[1], 6) < 50 {
Period = Max(Period[1], 6);
} else {
Period = 0.2 * Period[1] + 0.8 * nz(Period[2], Period[1]);
;
}
}
}
phase = if I1 != 0 then (180 / PI) * ATan(Q1 / I1) else phase[1];

def deltaPhase = nz(phase[1]) - phase;
def alpha1 = fastLimit / If(deltaPhase < 1, 1, deltaPhase);

def alpha = If(alpha1 < slowLimit, slowLimit, alpha1);
plot MAMA = alpha;
plot FAMA = alpha / 2;
}
def er = AbsValue(src - nz(src[CloudLength], src[1])) / Sum(AbsValue(src - src[1]), CloudLength);
def a = computeAlpha(src, er, er * 0.1).MAMA;
def b = computeAlpha(src, er, er * 0.1).FAMA;
def mama;
def fama;
def kama;
mama = a * src + (1 - a) * nz(mama[1], ExpAverage(src, CloudLength)[1]);
fama = b * mama + (1 - b) * nz(fama[1], ExpAverage(src, CloudLength)[1]);
def alpha = Power((er * (b - a)) + a, 2);
kama = alpha * src + (1 - alpha) * nz(kama[1]);
def L_cloud = kama > kama[1];
def S_cloud = kama < kama[1];
def n_cloud = kama == kama[1];
def CLOUD_COLOR = if L_cloud then 1 else if S_cloud then -1 else 0;

def mama_p = if n_cloud then na else mama;
def fama_p = if n_cloud then na else fama;

AddCloud(mama_p, fama_p, CreateColor(41, 98, 255), CreateColor(156, 39, 176), CloudLines);

#---//PRICE POSITION

def ph = if bar > ppPeriod then findpivots(h, 1, ppPeriod, ppPeriod) else Highest(h, ppPeriod);
def pl = if bar > ppPeriod then findpivots(l, -1, ppPeriod, ppPeriod) else Lowest(l, ppPeriod);

def lastpp = if !IsNaN(ph) then ph else if !IsNaN(pl) then pl else na;
#// calculate the Center line using pivot points
def center;
if (lastpp) {
if IsNaN(center[1]) {
center = lastpp;
} else {
center = (center[1] * 2 + lastpp) / 3;
}
} else {
center = center[1];
}
def nATR = ATR(LENGTH = atrPeriod);
def Up = center - (atrFactor * nATR);
def Dn = center + (atrFactor * nATR);

def TUp;
def TDown;
def Trend;
TUp = if close[1] > TUp[1] then Max(Up, TUp[1]) else Up;
TDown = if close[1] < TDown[1] then Min(Dn, TDown[1]) else Dn;
Trend = if close > TDown[1] then 1 else if close < TUp[1] then -1 else nz(Trend[1], 1);
def Trailingsl = if Trend == 1 then TUp else TDown;

#def Trailingsl = if trend == 1 then lastUp else lastDn;

#---ADX
def DIPlusC = calcADX(adxLenght).plus;
def DIMinusC = calcADX(adxLenght).Minus;
def ADXC = calcADX(adxLenght).ADX;
def DIPlusM = calcADX_Masanakamura(adxLenght).DIP;
def DIMinusM = calcADX_Masanakamura(adxLenght).DIM;
def ADXM = calcADX_Masanakamura(adxLenght).ADX;
def DIPlus = if adxOps then DIPlusC else DIPlusM;
def DIMinus = if adxOps then DIMinusC else DIMinusM;
def ADX = if adxOps then ADXC else ADXM;

def L_adx = DIPlus > DIMinus and ADX > adxThreshold;
def S_adx = DIPlus < DIMinus and ADX > adxThreshold;
#------
def bsignal = Trend == 1 and Trend[1] == -1;
def ssignal = Trend == -1 and Trend[1] == 1;

def first_long = if bsignal and !S_cloud then Trailingsl else na;
def first_short = if ssignal and !L_cloud then Trailingsl else na;

def second_long = L_cloud and L_adx and Trend == 1;
def second_short = S_cloud and S_adx and Trend == -1;

def Long = second_long or first_long;
def Short = second_short or first_short;

def long_short;
def long_last = Long and (nz(long_short[1]) == 0 or nz(long_short[1]) == -1);
def short_last = Short and (nz(long_short[1]) == 0 or nz(long_short[1]) == 1);
long_short = if long_last then 1 else if short_last then -1 else long_short[1];

def last_long_cond = Long and long_last;
def last_short_cond = Short and short_last;

def Long_plot = if bsignal and !S_cloud then Trailingsl else na or if last_long_cond then Trailingsl else na;
def Short_plot = if ssignal and !L_cloud then Trailingsl else na or if last_short_cond then Trailingsl else na;

def Long_stop = if ssignal and L_cloud then Trailingsl else na;
def Short_stop = if bsignal and S_cloud then Trailingsl else na;

#// ----Plots-
plot SmartSTup = if Trend == 1 then Trailingsl else na;#, color = CLOUD_COLOR , linewidth = 1, title = "PP line")
SmartSTup.SetDefaultColor(Color.GREEN);
plot SmartSTdn = if Trend == 1 then na else Trailingsl;#, color = CLOUD_COLOR , linewidth = 1, title = "PP line")
SmartSTdn.SetDefaultColor(Color.RED);

AddChartBubble(Long_plot, low, "Long", Color.GREEN, no);
AddChartBubble(Short_plot, high, "Short", Color.RED, yes);

plot LongExit = Long_stop;
LongExit.SetPaintingStrategy(PaintingStrategy.BOOLEAN_WEDGE_DOWN);
LongExit.SetDefaultColor(Color.CYAN);
LongExit.SetLineWeight(3);
plot ShortExit = Short_stop;
ShortExit.SetPaintingStrategy(PaintingStrategy.BOOLEAN_WEDGE_UP);
ShortExit.SetDefaultColor(Color.MAGENTA);
ShortExit.SetLineWeight(3);

#-------barcolor

AssignPriceColor(if !BarColor then Color.CURRENT else
if CLOUD_COLOR > 0 then Color.GREEN else if CLOUD_COLOR<0 then Color.RED else Color.GRAY);


#--- END CODEThis one has arrows:Is it possible to change the chart bubbles to arrows instead?
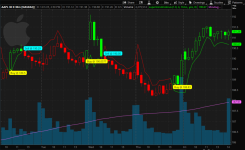
This one has arrows:

#Special Thanks to Morbius who created original super trend indicator. This is a spin off of his work. All credits go to him. This software is free.
#CREATED 09/12/2020


input AtrMult = 0.7;
input nATR = 4;
input AvgType = AverageType.HULL;
input PaintBars = yes;
def ATR = MovingAverage(AvgType, TrueRange(high, close, low), nATR);
def UP = HL2 + (AtrMult * ATR);
def DN = HL2 + (-AtrMult * ATR);
def ST = if close < ST[1] then UP else DN;
plot SuperTrend = ST;

SuperTrend.AssignValueColor(if close < ST then Color.GREEN else color.RED);

AssignPriceColor(if PaintBars and close < ST

then Color.RED

else if PaintBars and close > ST

then Color.GREEN

else Color.CURRENT);

#AddChartBubble(close crosses below ST, low[1], low[1], #color.Dark_Gray);
#AddChartBubble(close crosses above ST, high[1], high[1], #color.Dark_Gray, no);
# End Code SuperTrend# Mobius
# SuperTrend
# Chat Room Request

plot SuperTrendUp = close crosses above ST;
plot SuperTrendDown = close crosses below ST;
SuperTrend.AssignValueColor(if close < ST then Color.RED else Color.GREEN);
SuperTrendUp.SetDefaultColor(Color.YELLOW);
SuperTrendUp.setPaintingStrategy(PaintingStrategy.BOOLEAN_ARROW_UP);
SuperTrendDown.SetDefaultColor(Color.PINK);
SuperTrendDown.setPaintingStrategy(PaintingStrategy.BOOLEAN_ARROW_DOWN);

def bullish = close crosses below ST;
def bearish = close crosses above ST;

# Alerts
Alert(bullish, " ", Alert.Bar, Sound.Chimes);
Alert(bearish, " ", Alert.Bar, Sound.Bell);


#ProjectionPivots_v03_JQ
#03.04.2019
#Original Code and Concept by Mobius:
# V01.08.2012 Projection Pivots
# mobius

# Notes:
# 03.04.2019 added linits on extensions
# 03.05.2019 adjusted limits on extensions by adding user input upper and lower extenion percent limits

#declare Once_Per_Bar;
#Inputs
input n = 21;
input showLines = yes;
input showValues = no;
input showBarNumbers = no;
input ExtensionLengthBars = 20; # added to control length of Entension
input UpperExtensionPercentLimit = 5;
input LowerExtensionPercentLimit = 5;
input DisplayLabel = yes; #JQ 7.8.2018 added
addlabel (DisplayLabel, "Projection Pivots n:" + n + " " , color.WHITE); #JQ 7.8.2018 added


# Universal Header _v030429019 _JQ
# code from various sources including Mobius, NoLongerNube and others
# Comment out unnecessary portions to preserve tos memory and enhance speed

# Universal Definitions using Padawan variable naming convention (JQ) v03.04.2019
# iData Definitions
def vHigh = high; # creates the variable vHigh. Use of the variable reduce data calls to tos iData server
# def initHigh = CompoundValue(1, high, high); # creates and initialized variable for High
def vLow = low;
# def initLow = CompoundValue(1, low, low);
def vOpen = open;
# def initOpen = CompoundValue(1, open, open);
def vClose = close;
# def initClose = CompoundValue(1, close, close);
def vVolume = volume;
# def initVolume = CompoundValue(1, volume, volume);
def nan = Double.NaN;
# Bar Time & Date
def bn = BarNumber();
def currentBar = HighestAll(if !IsNaN(vHigh) then bn else nan);
# def Today = GetDay() ==GetLastDay();
# def time = GetTime();
# def GlobeX = GetTime() < RegularTradingStart(GetYYYYMMDD());
# def globeX_v2 = if time crosses below RegularTradingEnd(GetYYYYMMDD()) then bn else GlobeX[1];
# def RTS = RegularTradingStart(GetYYYYMMDD());
# def RTE = RegularTradingEnd(GetYYYYMMDD());
# def RTH = GetTime() > RegularTradingStart(GetYYYYMMDD());
# def RTH_v2 = if time crosses above RegularTradingStart(GetYYYYMMDD()) then bn else RTH[1];

# bars that start and end the sessions #(borrowed from nube)
# def rthStartBar = CompoundValue(1,
# if !IsNaN(vClose)
# && time crosses above RegularTradingStart(GetYYYYMMDD())
# then bn
# else rthStartBar[1], 0);
# def rthEndBar = CompoundValue(1,
# if !IsNaN(vClose)
# && time crosses above RegularTradingEnd(GetYYYYMMDD())
# then bn
# else rthEndBar[1], 1);
# def globexStartBar = CompoundValue(1,
# if !IsNaN(vClose)
# && time crosses below RegularTradingEnd(GetYYYYMMDD())
# then bn
# else globexStartBar[1], 1);
# def rthSession = if bn crosses above rthStartBar #+ barsExtendedBeyondSession
# then 1
# else if bn crosses above rthEndBar #+ barsExtendedBeyondSession
# then 0
# else rthSession[1];

# Bubble Locations
def x_AxisLastExpansionBar = BarNumber() == HighestAll(BarNumber()); #corrected 11.12.2018 (JQ)
# syntax: addChartBubble(x_AxisLastExpansionBar, y-axis coordinate," text", Color.LIME); #verified 12.25.2018 (JQ)

def PH;
def PL;
def hh = fold i = 1 to n + 1
with p = 1
while p
do vHigh > getValue(vHigh, -i);
PH = if (bn > n and
vHigh == highest(vHigh, n) and
hh)
then vHigh
else double.NaN;
def ll = fold j = 1 to n + 1
with q = 1
while q
do vLow < getValue(low, -j);
PL = if (bn > n and
vLow == lowest(vLow, n) and
ll)
then vLow
else double.NaN;
def PHBar = if !isNaN(PH)
then bn
else PHBar[1];
def PLBar = if !isNaN(PL)
then bn
else PLBar[1];
def PHL = if !isNaN(PH)
then PH
else PHL[1];
def priorPHBar = if PHL != PHL[1]
then PHBar[1]
else priorPHBar[1];
def PLL = if !isNaN(PL)
then PL
else PLL[1];
def priorPLBar = if PLL != PLL[1]
then PLBar[1]
else priorPLBar[1];
def HighPivots = bn >= highestAll(priorPHBar);
def LowPivots = bn >= highestAll(priorPLBar);
def FirstRpoint = if HighPivots
then bn - PHBar
else 0;
def PriorRpoint = if HighPivots
then bn - PriorPHBar
else 0;
def RSlope = (getvalue(PH, FirstRpoint) - getvalue(PH, PriorRpoint))
/ (PHBar - PriorPHBar);
def FirstSpoint = if LowPivots
then bn - PLBar
else 0;
def PriorSpoint = if LowPivots
then bn - PriorPLBar
else 0;
def SSlope = (getvalue(PL, FirstSpoint) - getvalue(PL, PriorSpoint))
/ (PLBar - PriorPLBar);
def RExtend = if bn == highestall(PHBar)
then 1
else RExtend[1];
def SExtend = if bn == highestall(PLBar)
then 1
else SExtend[1];

plot pivotHigh = if HighPivots
then PH
else double.NaN;
pivotHigh.SetDefaultColor(GetColor(1));
pivotHigh.setPaintingStrategy(PaintingStrategy.VALUES_ABOVE);
pivotHigh.setHiding(!showValues);

plot pivotHighLine = if PHL > 0 and
HighPivots
then PHL
else double.NaN;
pivotHighLine.SetPaintingStrategy(PaintingStrategy.DASHES); # Mobius original was DASHES
pivotHighLine.setDefaultColor(color.uptick); #JQ 7.8.2018 added
pivotHighLine.setHiding(!showLines);

plot RLine = pivotHigh;
RLine.enableApproximation();
RLine.SetDefaultColor(Color.LIGHT_GRAY);
RLine.SetStyle(Curve.Short_DASH);

# Added code to limit resistance estension line (JQ 03.04.2019)
def calc_ResistanceExtension = if RExtend
then (bn - PHBar) * RSlope + PHL
else double.NaN;
plot line_ResistanceExtension = if bn <= (Currentbar + ExtensionLengthBars)
and calc_ResistanceExtension[1] >= (lowestall(vLow) * (1-(lowerExtensionPercentLimit/100)))
and calc_ResistanceExtension[1] <= (Highestall(vHigh) * (1 + (upperExtensionPercentLimit/100)))
then calc_ResistanceExtension else double.nan;
line_ResistanceExtension.SetStyle(Curve.Short_DASH);
line_ResistanceExtension.SetDefaultColor(color.LIGHT_GRAY); #was 7
line_ResistanceExtension.setLineWeight(1);

# Low Plots
plot pivotLow = if LowPivots
then PL
else double.NaN;
pivotLow.setDefaultColor(GetColor(4));
pivotLow.setPaintingStrategy(PaintingStrategy.VALUES_BELOW);
pivotLow.setHiding(!showValues);

plot pivotLowLine = if PLL > 0 and
LowPivots
then PLL
else double.NaN;
pivotLowLine.SetPaintingStrategy(PaintingStrategy.DASHES); # Mobius original was DASHES
pivotLowLine.setDefaultColor(color.DOWNTICK);# # JQ 7.8.2018 added
pivotLowLine.setHiding(!showLines);

plot SupportLine = pivotLow;
SupportLine.enableApproximation();
SupportLine.SetDefaultColor(color.LIGHT_GRAY);
SUpportLine.SetStyle(Curve.Short_DASH);

# Added code to limit support estension line (JQ 03.04.2019)
def calc_SupportExtension = if SExtend
then (bn - PLBar) * SSlope + PLL
else double.NaN;
plot line_SupportExtension = if bn <= (Currentbar + ExtensionLengthBars)
and calc_SupportExtension[1] >= (lowestall(vLow) * (1-(lowerExtensionPercentLimit/100)))
and calc_SupportExtension[1] <= (Highestall(vHigh) * (1 + (upperExtensionPercentLimit/100)))
then calc_supportExtension else double.nan;
line_SupportExtension.SetDefaultColor(color.LIGHT_GRAY); #was 7
line_SupportExtension.SetStyle(Curve.Short_DASH);
line_SupportExtension.setLineWeight(1);

plot BarNumbersBelow = bn;
BarNumbersBelow.SetDefaultColor(GetColor(0));
BarNumbersBelow.setHiding(!showBarNumbers);
BarNumbersBelow.SetPaintingStrategy(PaintingStrategy.VALUES_BELOW);

plot PivotDot = if !isNaN(pivotHigh)
then pivotHigh
else if !isNaN(pivotLow)
then pivotLow
else double.NaN;
pivotDot.SetDefaultColor(GetColor(7));
pivotDot.SetPaintingStrategy(PaintingStrategy.POINTS);
pivotDot.SetLineWeight(3);
##


# End CodeThis one has arrows:
#Special Thanks to Morbius who created original super trend indicator. This is a spin off of his work. All credits go to him. This software is free.
#CREATED 09/12/2020
input AtrMult = 0.7;
input nATR = 4;
input AvgType = AverageType.HULL;
input PaintBars = yes;
def ATR = MovingAverage(AvgType, TrueRange(high, close, low), nATR);
def UP = HL2 + (AtrMult * ATR);
def DN = HL2 + (-AtrMult * ATR);
def ST = if close < ST[1] then UP else DN;
plot SuperTrend = ST;
SuperTrend.AssignValueColor(if close < ST then Color.GREEN else color.RED);
AssignPriceColor(if PaintBars and close < ST
then Color.RED
else if PaintBars and close > ST
then Color.GREEN
else Color.CURRENT);
#AddChartBubble(close crosses below ST, low[1], low[1], #color.Dark_Gray);
#AddChartBubble(close crosses above ST, high[1], high[1], #color.Dark_Gray, no);
# End Code SuperTrend# Mobius
# SuperTrend
# Chat Room Request
plot SuperTrendUp = close crosses above ST;
plot SuperTrendDown = close crosses below ST;
SuperTrend.AssignValueColor(if close < ST then Color.RED else Color.GREEN);
SuperTrendUp.SetDefaultColor(Color.YELLOW);
SuperTrendUp.setPaintingStrategy(PaintingStrategy.BOOLEAN_ARROW_UP);
SuperTrendDown.SetDefaultColor(Color.PINK);
SuperTrendDown.setPaintingStrategy(PaintingStrategy.BOOLEAN_ARROW_DOWN);
def bullish = close crosses below ST;
def bearish = close crosses above ST;
# Alerts
Alert(bullish, " ", Alert.Bar, Sound.Chimes);
Alert(bearish, " ", Alert.Bar, Sound.Bell);
#ProjectionPivots_v03_JQ
#03.04.2019
#Original Code and Concept by Mobius:
# V01.08.2012 Projection Pivots
# mobius
# Notes:
# 03.04.2019 added linits on extensions
# 03.05.2019 adjusted limits on extensions by adding user input upper and lower extenion percent limits
#declare Once_Per_Bar;
#Inputs
input n = 21;
input showLines = yes;
input showValues = no;
input showBarNumbers = no;
input ExtensionLengthBars = 20; # added to control length of Entension
input UpperExtensionPercentLimit = 5;
input LowerExtensionPercentLimit = 5;
input DisplayLabel = yes; #JQ 7.8.2018 added
addlabel (DisplayLabel, "Projection Pivots n:" + n + " " , color.WHITE); #JQ 7.8.2018 added
# Universal Header _v030429019 _JQ
# code from various sources including Mobius, NoLongerNube and others
# Comment out unnecessary portions to preserve tos memory and enhance speed
# Universal Definitions using Padawan variable naming convention (JQ) v03.04.2019
# iData Definitions
def vHigh = high; # creates the variable vHigh. Use of the variable reduce data calls to tos iData server
# def initHigh = CompoundValue(1, high, high); # creates and initialized variable for High
def vLow = low;
# def initLow = CompoundValue(1, low, low);
def vOpen = open;
# def initOpen = CompoundValue(1, open, open);
def vClose = close;
# def initClose = CompoundValue(1, close, close);
def vVolume = volume;
# def initVolume = CompoundValue(1, volume, volume);
def nan = Double.NaN;
# Bar Time & Date
def bn = BarNumber();
def currentBar = HighestAll(if !IsNaN(vHigh) then bn else nan);
# def Today = GetDay() ==GetLastDay();
# def time = GetTime();
# def GlobeX = GetTime() < RegularTradingStart(GetYYYYMMDD());
# def globeX_v2 = if time crosses below RegularTradingEnd(GetYYYYMMDD()) then bn else GlobeX[1];
# def RTS = RegularTradingStart(GetYYYYMMDD());
# def RTE = RegularTradingEnd(GetYYYYMMDD());
# def RTH = GetTime() > RegularTradingStart(GetYYYYMMDD());
# def RTH_v2 = if time crosses above RegularTradingStart(GetYYYYMMDD()) then bn else RTH[1];
# bars that start and end the sessions #(borrowed from nube)
# def rthStartBar = CompoundValue(1,
# if !IsNaN(vClose)
# && time crosses above RegularTradingStart(GetYYYYMMDD())
# then bn
# else rthStartBar[1], 0);
# def rthEndBar = CompoundValue(1,
# if !IsNaN(vClose)
# && time crosses above RegularTradingEnd(GetYYYYMMDD())
# then bn
# else rthEndBar[1], 1);
# def globexStartBar = CompoundValue(1,
# if !IsNaN(vClose)
# && time crosses below RegularTradingEnd(GetYYYYMMDD())
# then bn
# else globexStartBar[1], 1);
# def rthSession = if bn crosses above rthStartBar #+ barsExtendedBeyondSession
# then 1
# else if bn crosses above rthEndBar #+ barsExtendedBeyondSession
# then 0
# else rthSession[1];
# Bubble Locations
def x_AxisLastExpansionBar = BarNumber() == HighestAll(BarNumber()); #corrected 11.12.2018 (JQ)
# syntax: addChartBubble(x_AxisLastExpansionBar, y-axis coordinate," text", Color.LIME); #verified 12.25.2018 (JQ)
def PH;
def PL;
def hh = fold i = 1 to n + 1
with p = 1
while p
do vHigh > getValue(vHigh, -i);
PH = if (bn > n and
vHigh == highest(vHigh, n) and
hh)
then vHigh
else double.NaN;
def ll = fold j = 1 to n + 1
with q = 1
while q
do vLow < getValue(low, -j);
PL = if (bn > n and
vLow == lowest(vLow, n) and
ll)
then vLow
else double.NaN;
def PHBar = if !isNaN(PH)
then bn
else PHBar[1];
def PLBar = if !isNaN(PL)
then bn
else PLBar[1];
def PHL = if !isNaN(PH)
then PH
else PHL[1];
def priorPHBar = if PHL != PHL[1]
then PHBar[1]
else priorPHBar[1];
def PLL = if !isNaN(PL)
then PL
else PLL[1];
def priorPLBar = if PLL != PLL[1]
then PLBar[1]
else priorPLBar[1];
def HighPivots = bn >= highestAll(priorPHBar);
def LowPivots = bn >= highestAll(priorPLBar);
def FirstRpoint = if HighPivots
then bn - PHBar
else 0;
def PriorRpoint = if HighPivots
then bn - PriorPHBar
else 0;
def RSlope = (getvalue(PH, FirstRpoint) - getvalue(PH, PriorRpoint))
/ (PHBar - PriorPHBar);
def FirstSpoint = if LowPivots
then bn - PLBar
else 0;
def PriorSpoint = if LowPivots
then bn - PriorPLBar
else 0;
def SSlope = (getvalue(PL, FirstSpoint) - getvalue(PL, PriorSpoint))
/ (PLBar - PriorPLBar);
def RExtend = if bn == highestall(PHBar)
then 1
else RExtend[1];
def SExtend = if bn == highestall(PLBar)
then 1
else SExtend[1];
plot pivotHigh = if HighPivots
then PH
else double.NaN;
pivotHigh.SetDefaultColor(GetColor(1));
pivotHigh.setPaintingStrategy(PaintingStrategy.VALUES_ABOVE);
pivotHigh.setHiding(!showValues);
plot pivotHighLine = if PHL > 0 and
HighPivots
then PHL
else double.NaN;
pivotHighLine.SetPaintingStrategy(PaintingStrategy.DASHES); # Mobius original was DASHES
pivotHighLine.setDefaultColor(color.uptick); #JQ 7.8.2018 added
pivotHighLine.setHiding(!showLines);
plot RLine = pivotHigh;
RLine.enableApproximation();
RLine.SetDefaultColor(Color.LIGHT_GRAY);
RLine.SetStyle(Curve.Short_DASH);
# Added code to limit resistance estension line (JQ 03.04.2019)
def calc_ResistanceExtension = if RExtend
then (bn - PHBar) * RSlope + PHL
else double.NaN;
plot line_ResistanceExtension = if bn <= (Currentbar + ExtensionLengthBars)
and calc_ResistanceExtension[1] >= (lowestall(vLow) * (1-(lowerExtensionPercentLimit/100)))
and calc_ResistanceExtension[1] <= (Highestall(vHigh) * (1 + (upperExtensionPercentLimit/100)))
then calc_ResistanceExtension else double.nan;
line_ResistanceExtension.SetStyle(Curve.Short_DASH);
line_ResistanceExtension.SetDefaultColor(color.LIGHT_GRAY); #was 7
line_ResistanceExtension.setLineWeight(1);
# Low Plots
plot pivotLow = if LowPivots
then PL
else double.NaN;
pivotLow.setDefaultColor(GetColor(4));
pivotLow.setPaintingStrategy(PaintingStrategy.VALUES_BELOW);
pivotLow.setHiding(!showValues);
plot pivotLowLine = if PLL > 0 and
LowPivots
then PLL
else double.NaN;
pivotLowLine.SetPaintingStrategy(PaintingStrategy.DASHES); # Mobius original was DASHES
pivotLowLine.setDefaultColor(color.DOWNTICK);# # JQ 7.8.2018 added
pivotLowLine.setHiding(!showLines);
plot SupportLine = pivotLow;
SupportLine.enableApproximation();
SupportLine.SetDefaultColor(color.LIGHT_GRAY);
SUpportLine.SetStyle(Curve.Short_DASH);
# Added code to limit support estension line (JQ 03.04.2019)
def calc_SupportExtension = if SExtend
then (bn - PLBar) * SSlope + PLL
else double.NaN;
plot line_SupportExtension = if bn <= (Currentbar + ExtensionLengthBars)
and calc_SupportExtension[1] >= (lowestall(vLow) * (1-(lowerExtensionPercentLimit/100)))
and calc_SupportExtension[1] <= (Highestall(vHigh) * (1 + (upperExtensionPercentLimit/100)))
then calc_supportExtension else double.nan;
line_SupportExtension.SetDefaultColor(color.LIGHT_GRAY); #was 7
line_SupportExtension.SetStyle(Curve.Short_DASH);
line_SupportExtension.setLineWeight(1);
plot BarNumbersBelow = bn;
BarNumbersBelow.SetDefaultColor(GetColor(0));
BarNumbersBelow.setHiding(!showBarNumbers);
BarNumbersBelow.SetPaintingStrategy(PaintingStrategy.VALUES_BELOW);
plot PivotDot = if !isNaN(pivotHigh)
then pivotHigh
else if !isNaN(pivotLow)
then pivotLow
else double.NaN;
pivotDot.SetDefaultColor(GetColor(7));
pivotDot.SetPaintingStrategy(PaintingStrategy.POINTS);
pivotDot.SetLineWeight(3);
##
# End Code
Code:########## Arrow addition; Bubble Controller 20240104 input showarrows = yes; input lineweight = 4; plot longarrow = if !showarrows then double.nan else Long_plot; longarrow.setpaintingStrategy(paintingStrategy.BOOLEAN_ARROW_UP); longarrow.setdefaultColor(color.green); longarrow.setlineWeight(lineweight); plot shortarrow = if !showarrows then double.nan else Short_plot; shortarrow.setpaintingStrategy(paintingStrategy.BOOLEAN_ARROW_DOWN); shortarrow.setdefaultColor(color.red); shortarrow.setlineWeight(lineweight); input showbubbles = no; AddChartBubble(showbubbles and Long_plot, low, "Long", Color.GREEN, no); AddChartBubble(showbubbles and Short_plot, high, "Short", Color.RED, yes); #########
 Code:
Code:#/ This source code is subject to the terms of the Mozilla Public License 2.0 at https://mozilla.org/MPL/2.0/ #// © wielkieef #study("Smart SuperTrend", overlay = true) # Converted by Sam4Cok@samer800 - 01/2023 #//INPUTS input BarColor = no; input CloudLines = yes; input src = hl2; input ppPeriod = 2; # "PP period" input atrFactor = 3; # "ATR Factor" input atrPeriod = 10; # "ATR Period" input CloudLength = 12; # "Cloud Length" input ADX_options = {default CLASSIC, MASANAKAMURA}; # "ADX OPTION" input adxLenght = 14;# "ADX Lenght" input adxThreshold = 20;# "ADX Treshold" input closeBars = 2; # Closed bars that have to exceed the ST value before the trend reversal is confirmed #//INDICATORS def na = Double.NaN; def bar = BarNumber(); def h = high; def l = low; def c = close; def adxOps = ADX_options == ADX_options.CLASSIC; script nz { input data = close; input rep = 0; def repl = rep; def ret_val = if (isNaN(data) or !data) then repl else data; plot return = ret_val; } script fixnan { input source = close; def fix = if !IsNaN(source) then source else fix[1]; plot result = fix; } script FindPivots { input dat = close; # default data or study being evaluated input HL = 0; # default high or low pivot designation, -1 low, +1 high input lbL = 5; # default Pivot Lookback Left input lbR = 1; # default Pivot Lookback Right ############## def _nan; # used for non-number returns def _BN; # the current barnumber def _VStop; # confirms that the lookforward period continues the pivot trend def _V; # the Value at the actual pivot point ############## _BN = BarNumber(); _nan = Double.NaN; _VStop = if !IsNaN(dat) and lbR > 0 and lbL > 0 then fold a = 1 to lbR + 1 with b=1 while b do if HL > 0 then dat > GetValue(dat, -a) else dat < GetValue(dat, -a) else _nan; if (HL > 0) { _V = if _BN > lbL and dat == Highest(dat, lbL + 1) and _VStop then dat else _nan; } else { _V = if _BN > lbL and dat == Lowest(dat, lbL + 1) and _VStop then dat else _nan; } plot result = if !IsNaN(_V) and _VStop then _V else _nan; } #calcADX(_len) => script calcADX { input _len = 10; def na = Double.NaN; def tr = TrueRange(high, close, low); def up = (high - high[1]); def down = -(low - low[1]); def plusDM = if IsNaN(up) then na else (if up > down and up > 0 then up else 0); def minusDM = if IsNaN(down) then na else (if down > up and down > 0 then down else 0); def truerange = WildersAverage(tr, _len); def _plus = fixnan(100 * WildersAverage(plusDM, _len) / truerange); def _minus = fixnan(100 * WildersAverage(minusDM, _len) / truerange); def sum = _plus + _minus; def _adx = 100 * WildersAverage(AbsValue(_plus - _minus) / (if sum == 0 then 1 else sum), _len); plot plus = _plus; plot minus = _minus; plot adx = _adx; } #calcADX_Masanakamura(_len) => script calcADX_Masanakamura { input _len = 10; def SmoothedTrueRange; def SmoothedDirectionalMovementPlus; def SmoothedDirectionalMovementMinus; def tr = TrueRange(high, close, low); def DirectionalMovementPlus = if (high - high[1]) > (low[1] - low) then Max((high - high[1]), 0) else 0; def DirectionalMovementMinus = if (low[1] - low) > (high - high[1]) then Max((low[1] - low), 0) else 0; SmoothedTrueRange = nz(SmoothedTrueRange[1]) - (nz(SmoothedTrueRange[1]) / _len) + tr; SmoothedDirectionalMovementPlus = nz(SmoothedDirectionalMovementPlus[1]) - (nz(SmoothedDirectionalMovementPlus[1]) / _len) + DirectionalMovementPlus; SmoothedDirectionalMovementMinus = nz(SmoothedDirectionalMovementMinus[1]) - (nz(SmoothedDirectionalMovementMinus[1]) / _len) + DirectionalMovementMinus; def DP = SmoothedDirectionalMovementPlus / SmoothedTrueRange * 100; def DM = SmoothedDirectionalMovementMinus / SmoothedTrueRange * 100; def DX = AbsValue(DP - DM) / (DP + DM) * 100; def AX = SimpleMovingAvg(DX, _len); plot DIP = DP; plot DIM = DM; plot ADX = AX; } #computeAlpha(src, fastLimit, slowLimit) => script computeAlpha { input src = close; input fastLimit = 0.5; input slowLimit = 0.05; def PI = 2 * ASin(1); def Period; def detrender; def smooth; def I2; def Q2; def phase; def mesaPeriodMult = 0.075 * nz(Period[2], Period[1]) + 0.54; # // Calc smooth = (4 * src + 3 * nz(src[1], src) + 2 * nz(src[2], src) + nz(src[3], src)) / 10; detrender = (0.0962 * smooth + 0.5769 * nz(smooth[2], smooth) - 0.5769 * nz(smooth[4], smooth) - 0.0962 * nz(smooth[6], smooth)) * (0.075 * nz(Period[1]) + 0.54); # // Compute InPhase and Quadrature components def I1 = nz(detrender[3], detrender); def Q1 = (0.0962 * detrender + 0.5769 * nz(detrender[2], detrender) - 0.5769 * nz(detrender[4], detrender) - 0.0962 * nz(detrender[6], detrender)) * (.075 * nz(Period[1], detrender) + 0.54); # // Advance the phase of I1 and Q1 by 90 degrees def jI = (.0962 * I1 + .5769 * nz(I1[2], I1) - .5769 * nz(I1[4], I1) - .0962 * nz(I1[6], I1)) * (.075 * nz(Period[1]) + 0.54); def jQ = (.0962 * Q1 + .5769 * nz(Q1[2], Q1) - .5769 * nz(Q1[4], Q1) - .0962 * nz(Q1[6], Q1)) * (.075 * nz(Period[1]) + 0.54); # // Phasor addition for 3 bar averaging def I22 = I1 - jQ; def Q22 = Q1 + jI; # // Smooth the I and Q components before applying the discriminator I2 = if IsNaN(I2[1]) then I22 else 0.2 * I2[1] + 0.8 * nz(I2[2], I2[1]); Q2 = if IsNaN(Q2[1]) then Q22 else 0.2 * Q2[1] + 0.8 * nz(Q2[2], Q2[1]); # // Homodyne Discriminator def Re1 = I2 * nz(I2[1], I2) + Q2 * nz(Q2[1], Q2); def Im1 = I2 * nz(Q2[1], Q2) - Q2 * nz(I2[1], I2); def Re = if IsNaN(Re[1]) then Re1 else 0.2 * Re[1] + 0.8 * nz(Re[2], Re[1]); def Im = if IsNaN(Im[1]) then Im1 else 0.2 * Im[1] + 0.8 * nz(Im[2], Im[1]); #def mesaPeriod1; if Re != 0 and Im != 0 { Period = 2 * PI / ATan(Im / Re); } else { if Period[1] <= 1.5 * nz(Period[2], Period[1]) { Period = Period[1]; } else { if Period[1] >= 0.67 * nz(Period[2], Period[1]) { Period = Period[1]; } else if Max(Period[1], 6) < 50 { Period = Max(Period[1], 6); } else { Period = 0.2 * Period[1] + 0.8 * nz(Period[2], Period[1]); ; } } } phase = if I1 != 0 then (180 / PI) * ATan(Q1 / I1) else phase[1]; def deltaPhase = nz(phase[1]) - phase; def alpha1 = fastLimit / If(deltaPhase < 1, 1, deltaPhase); def alpha = If(alpha1 < slowLimit, slowLimit, alpha1); plot MAMA = alpha; plot FAMA = alpha / 2; } def er = AbsValue(src - nz(src[CloudLength], src[1])) / Sum(AbsValue(src - src[1]), CloudLength); def a = computeAlpha(src, er, er * 0.1).MAMA; def b = computeAlpha(src, er, er * 0.1).FAMA; def mama; def fama; def kama; mama = a * src + (1 - a) * nz(mama[1], ExpAverage(src, CloudLength)[1]); fama = b * mama + (1 - b) * nz(fama[1], ExpAverage(src, CloudLength)[1]); def alpha = Power((er * (b - a)) + a, 2); kama = alpha * src + (1 - alpha) * nz(kama[1]); def L_cloud = kama > kama[1]; def S_cloud = kama < kama[1]; def n_cloud = kama == kama[1]; def CLOUD_COLOR = if L_cloud then 1 else if S_cloud then -1 else 0; def mama_p = if n_cloud then na else mama; def fama_p = if n_cloud then na else fama; AddCloud(mama_p, fama_p, CreateColor(41, 98, 255), CreateColor(156, 39, 176), CloudLines); #---//PRICE POSITION def ph = if bar > ppPeriod then findpivots(h, 1, ppPeriod, ppPeriod) else Highest(h, ppPeriod); def pl = if bar > ppPeriod then findpivots(l, -1, ppPeriod, ppPeriod) else Lowest(l, ppPeriod); def lastpp = if !IsNaN(ph) then ph else if !IsNaN(pl) then pl else na; #// calculate the Center line using pivot points def center; if (lastpp) { if IsNaN(center[1]) { center = lastpp; } else { center = (center[1] * 2 + lastpp) / 3; } } else { center = center[1]; } def nATR = ATR(LENGTH = atrPeriod); def Up = center - (atrFactor * nATR); def Dn = center + (atrFactor * nATR); def TUp; def TDown; def Trend; TUp = if close[1] > TUp[1] then Max(Up, TUp[1]) else Up; TDown = if close[1] < TDown[1] then Min(Dn, TDown[1]) else Dn; Trend = if close > TDown[1] then 1 else if close < TUp[1] then -1 else nz(Trend[1], 1); def Trailingsl = if Trend == 1 then TUp else TDown; #def Trailingsl = if trend == 1 then lastUp else lastDn; #---ADX def DIPlusC = calcADX(adxLenght).plus; def DIMinusC = calcADX(adxLenght).Minus; def ADXC = calcADX(adxLenght).ADX; def DIPlusM = calcADX_Masanakamura(adxLenght).DIP; def DIMinusM = calcADX_Masanakamura(adxLenght).DIM; def ADXM = calcADX_Masanakamura(adxLenght).ADX; def DIPlus = if adxOps then DIPlusC else DIPlusM; def DIMinus = if adxOps then DIMinusC else DIMinusM; def ADX = if adxOps then ADXC else ADXM; def L_adx = DIPlus > DIMinus and ADX > adxThreshold; def S_adx = DIPlus < DIMinus and ADX > adxThreshold; #------ def bsignal = Trend == 1 and Trend[1] == -1; def ssignal = Trend == -1 and Trend[1] == 1; def first_long = if bsignal and !S_cloud then Trailingsl else na; def first_short = if ssignal and !L_cloud then Trailingsl else na; def second_long = L_cloud and L_adx and Trend == 1; def second_short = S_cloud and S_adx and Trend == -1; def Long = second_long or first_long; def Short = second_short or first_short; def long_short; def long_last = Long and (nz(long_short[1]) == 0 or nz(long_short[1]) == -1); def short_last = Short and (nz(long_short[1]) == 0 or nz(long_short[1]) == 1); long_short = if long_last then 1 else if short_last then -1 else long_short[1]; def last_long_cond = Long and long_last; def last_short_cond = Short and short_last; def Long_plot = if bsignal and !S_cloud then Trailingsl else na or if last_long_cond then Trailingsl else na; def Short_plot = if ssignal and !L_cloud then Trailingsl else na or if last_short_cond then Trailingsl else na; def Long_stop = if ssignal and L_cloud then Trailingsl else na; def Short_stop = if bsignal and S_cloud then Trailingsl else na; #// ----Plots- plot SmartSTup = if Trend == 1 then Trailingsl else na;#, color = CLOUD_COLOR , linewidth = 1, title = "PP line") SmartSTup.SetDefaultColor(Color.GREEN); plot SmartSTdn = if Trend == 1 then na else Trailingsl;#, color = CLOUD_COLOR , linewidth = 1, title = "PP line") SmartSTdn.SetDefaultColor(Color.RED); ########## Arrow addition; Bubble Controller 20240104 input showarrows = yes; input lineweight = 4; plot longarrow = if !showarrows then double.nan else Long_plot; longarrow.setpaintingStrategy(paintingStrategy.BOOLEAN_ARROW_UP); longarrow.setdefaultColor(color.green); longarrow.setlineWeight(lineweight); plot shortarrow = if !showarrows then double.nan else Short_plot; shortarrow.setpaintingStrategy(paintingStrategy.BOOLEAN_ARROW_DOWN); shortarrow.setdefaultColor(color.red); shortarrow.setlineWeight(lineweight); input showbubbles = no; AddChartBubble(showbubbles and Long_plot, low, "Long", Color.GREEN, no); AddChartBubble(showbubbles and Short_plot, high, "Short", Color.RED, yes); ######### plot LongExit = Long_stop; LongExit.SetPaintingStrategy(PaintingStrategy.BOOLEAN_WEDGE_DOWN); LongExit.SetDefaultColor(Color.CYAN); LongExit.SetLineWeight(3); plot ShortExit = Short_stop; ShortExit.SetPaintingStrategy(PaintingStrategy.BOOLEAN_WEDGE_UP); ShortExit.SetDefaultColor(Color.MAGENTA); ShortExit.SetLineWeight(3); #-------barcolor AssignPriceColor(if !BarColor then Color.CURRENT else if CLOUD_COLOR > 0 then Color.GREEN else if CLOUD_COLOR<0 then Color.RED else Color.GRAY); #--- END CODE
the scanner is amazing. thank you. im only getting buy signals though. how can i set the scanner to get sell signals also?
The only working mobile Supertrend can be found:Did anyone figure out the mobile version for this? The link at the top just takes you back to the same page. Is there an addition to the code that is needed?
Hi, I see many tickers, which one to choose and on what basis?the scanner is amazing. thank you. im only getting buy signals though. how can i set the scanner to get sell signals also?
No indicator can be used in isolation.Hi, I see many tickers, which one to choose and on what basis?
can you set an alert on think or swim for when you get a new buy or sell signal on the super trend indicator?View attachment 1059
Everything You Want To Know About SuperTrend Indicators And Were Afraid To Ask.
Study and scanner found in Post#1 https://usethinkscript.com/threads/supertrend-indicator-by-mobius-for-thinkorswim.7/#post-12
Install instructions: https://usethinkscript.com/threads/how-to-import-existing-thinkscript-code-on-thinkorswim.10/
Start out with extended hours off.
View attachment 1060
What Is The Supertrend Indicator
1. How can you tell if you are in a trending market and avoid false signals?Use three time frames to decipher the long, medium, and short-term trends.2. Which timeframes you ask? Here is a summary of how to determine what timeframes to use:The indicator does well with the default multiplier setting. There is no best setting for any trading indicator.
- Smaller settings can make the indicator more reactive to the price which means, more signals
- Higher settings will remove the noise from the market at the risk of less trading signals
Read through this thread to see the various ways members have adjusted this setting to fit their strategy.
How Does It Work?
Video Tutorial:
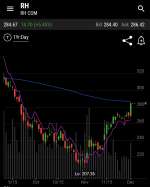
Best Time Frame for SuperTrend is:
5Min – 15Min – 30Min – 1Hr ( 5- 10 days Charts )
Aggregations under 5min have more false signals due to noise.
Sell signals on aggregations 4hr and higher can result in giving back profit.
What Indicators Pair Best With The SuperTrend Indicator
All trending strategies work best when combined with:
- Trend/Momentum study: RSI or MACD, etc
- Support & Resistance (can be hand-drawn or a study)
- Volume
https://usethinkscript.com/threads/supertrend-indicator-by-mobius-for-thinkorswim.7/#post-3927can you set an alert on think or swim for when you get a new buy or sell signal on the super trend indicator?
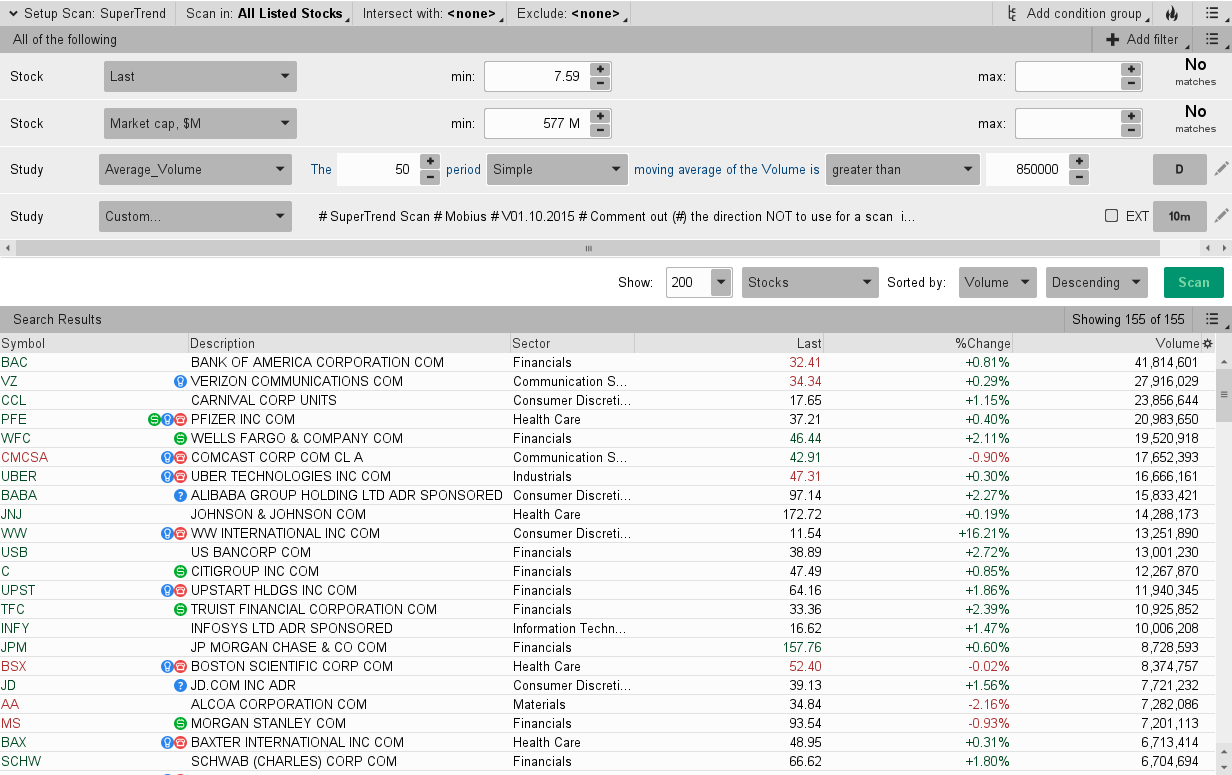
Good afternoon, I see there is a SupperTrend indicator in Charts but not in Stock Hacker. Is there any code to utilize this indictor for screening stocks when there is a crossover in Stock Hacker. Thanks again for your consideration. Doogster7
does the scanner only show long signals? Idk how to tell if it's a short signal I only really use the scanner for swings and not any of the studies.Yes, you will find various scanner throughout this thread.
Recommended that you start with the scanner in the beginning post (2nd script down).
does the scanner only show long signals? Idk how to tell if it's a short signal I only really use the scanner for swings and not any of the studies.
To this:#plot SuperTrendUP = if ST crosses below close then 1 else 0;
plot SuperTrendDN = if ST crosses above close then 1 else 0;
plot SuperTrendUP = if ST crosses below close then 1 else 0;
#plot SuperTrendDN = if ST crosses above close then 1 else 0;
Thank you! I love this indicator. Is there any way to add an alert when all time frames go green?Its working great.. U always rocking...
"Paris: Here's SuperTrend MTF for those interested, from my archives - complete with notes posted at the time the study was released"
Code:# SuperTrend Multiple Time Frames # Mobius # V03.01.2016 # I pulled this study down from MyTrade for a reason. It wasn't # plotting correctly with the multiple aggregations. And like # all studies with secondary aggregations it tends to replot the # higher ones. I decided to think about it some more and this is # where I am with the ST MTF study now. # # It's still squirrely and blinks a lot. Using declare Once_Per_Bar # does some bad things to it. I was considering making intra # aggregation higher time frames. A pain to do but it gives more # control over how it plots. # # Row 6 is supposed to be the output for all aggregations and the # signal line. After hours when data isn't moving it's steady and # has good signals. But since it's after hours, totally useless # for any intraday trading. declare lower; input agg1 = AggregationPeriod.Five_Min; input agg2 = AggregationPeriod.Ten_Min; input agg3 = AggregationPeriod.Fifteen_Min; input agg4 = AggregationPeriod.Thirty_Min; input agg5 = AggregationPeriod.Hour; input AtrMult = .70; input nATR = 4; input AvgType = AverageType.HULL; script ST{ input agg = AggregationPeriod.Five_Min; input AtrMult = .70; input nATR = 4; input AvgType = AverageType.HULL; def Fh = FundamentalType.High; def Fl = FundamentalType.Low; def Fc = FundamentalType.Close; def Fhl2 = FundamentalType.HL2; def h = Fundamental(Fh, period = agg); def l = Fundamental(Fl, period = agg); def c = Fundamental(Fc, period = agg); def hl = Fundamental(Fhl2, period = agg); def ATR = MovingAverage(AvgType, TrueRange(h, c, l), nATR); def UP = hl + (AtrMult * ATR); def DN = hl + (-AtrMult * ATR); def S = if c < S[1] then Round(UP / tickSize(), 0) * tickSize() else Round(DN / tickSize(), 0) * tickSize(); plot ST = if c > S then 1 else 0; } def cl = close; def x = isNaN(cl[2]) and !isNaN(cl[3]); def FirstAgg = ST(agg = agg1, AtrMult = AtrMult, nATR = nATR, AvgType = AvgType); plot FirstAggPlot = if isNaN(cl) then double.nan else 1; FirstAggPlot.SetStyle(Curve.Points); FirstAggPlot.SetLineWeight(3); FirstAggPlot.AssignValueColor(if FirstAgg == 1 then color.green else color.red); AddChartBubble(x, 1, (agg1/1000/60) + " min", color.white, yes); def SecondAgg = ST(agg = agg2, AtrMult = AtrMult, nATR = nATR, AvgType = AvgType); plot SecondAggPlot = if isNaN(cl) then double.nan else 2; SecondAggPlot.SetStyle(Curve.Points); SecondAggPlot.SetLineWeight(3); SecondAggPlot.AssignValueColor(if SecondAgg == 1 then color.green else color.red); AddChartBubble(x, 2, (agg2/1000/60) + " min", color.white, yes); def ThirdAgg = ST(agg = agg3, AtrMult = AtrMult, nATR = nATR, AvgType = AvgType); plot ThirdAggPlot = if isNaN(cl) then double.nan else 3; ThirdAggPlot.SetStyle(Curve.Points); ThirdAggPlot.SetLineWeight(3); ThirdAggPlot.AssignValueColor(if ThirdAgg == 1 then color.green else color.red); AddChartBubble(x, 3, (agg3/1000/60) + " min", color.white, yes); def FourthAgg = ST(agg = agg4, AtrMult = AtrMult, nATR = nATR, AvgType = AvgType); plot FourthAggPlot = if isNaN(cl) then double.nan else 4; FourthAggPlot.SetStyle(Curve.Points); FourthAggPlot.SetLineWeight(3); FourthAggPlot.AssignValueColor(if FourthAgg == 1 then color.green else color.red); AddChartBubble(x, 4, (agg4/1000/60) + " min", color.white, yes); def FifthAgg = ST(agg = agg5, AtrMult = AtrMult, nATR = nATR, AvgType = AvgType); plot FifthAggPlot = if isNaN(cl) then double.nan else 5; FifthAggPlot.SetStyle(Curve.Points); FifthAggPlot.SetLineWeight(3); FifthAggPlot.AssignValueColor(if FifthAgg == 1 then color.green else color.red); AddChartBubble(x, 5, (agg5/1000/60)+ " min", color.white, yes); plot Six = if isNaN(cl) then double.nan else 6; Six.SetStyle(Curve.Points); Six.SetLineWeight(3); Six.AssignValueColor(if FirstAgg and SecondAgg and ThirdAgg and FourthAgg and FifthAgg then color.green else if !FirstAgg and !SecondAgg and !ThirdAgg and !FourthAgg and !FifthAgg then color.red else color.black); # End Code ST MTF
Thank you! I love this indicator. Is there any way to add an alert when all time frames go green?
# ALERTS FOR MTF SUPER TREND when all timeframes go green
def BullishConsensus = FirstAgg and SecondAgg and ThirdAgg and FourthAgg and FifthAgg;
def BearishConsensus = !FirstAgg and !SecondAgg and !ThirdAgg and !FourthAgg and !FifthAgg;

def BullishFlip = BullishConsensus and !BullishConsensus[1];
def BearishFlip = BearishConsensus and !BearishConsensus[1];

Alert(BullishFlip, "MTF SuperTrend → BULLISH", Alert.BAR, Sound.Ring);
Alert(BearishFlip, "MTF SuperTrend → BEARISH", Alert.BAR, Sound.Bell);| Thread starter | Similar threads | Forum | Replies | Date |
|---|---|---|---|---|
|
|
Archived: Supertrend Indicator by Mobius for ThinkorSwim | Indicators | 312 | |
|
|
SuperTrend and RSI Laguerre Indicator for ThinkorSwim | Indicators | 35 | |
|
|
Q-Trend, QQE, SuperTrend strategy for ThinkOrSwim | Indicators | 24 | |
|
|
Smart Supertrend For ThinkOrSwim | Indicators | 13 | |
| M | SuperTrend Oscillator [LUX] For ThinkOrSwim | Indicators | 6 |
Start a new thread and receive assistance from our community.
useThinkScript is the #1 community of stock market investors using indicators and other tools to power their trading strategies. Traders of all skill levels use our forums to learn about scripting and indicators, help each other, and discover new ways to gain an edge in the markets.
We get it. Our forum can be intimidating, if not overwhelming. With thousands of topics, tens of thousands of posts, our community has created an incredibly deep knowledge base for stock traders. No one can ever exhaust every resource provided on our site.
If you are new, or just looking for guidance, here are some helpful links to get you started.