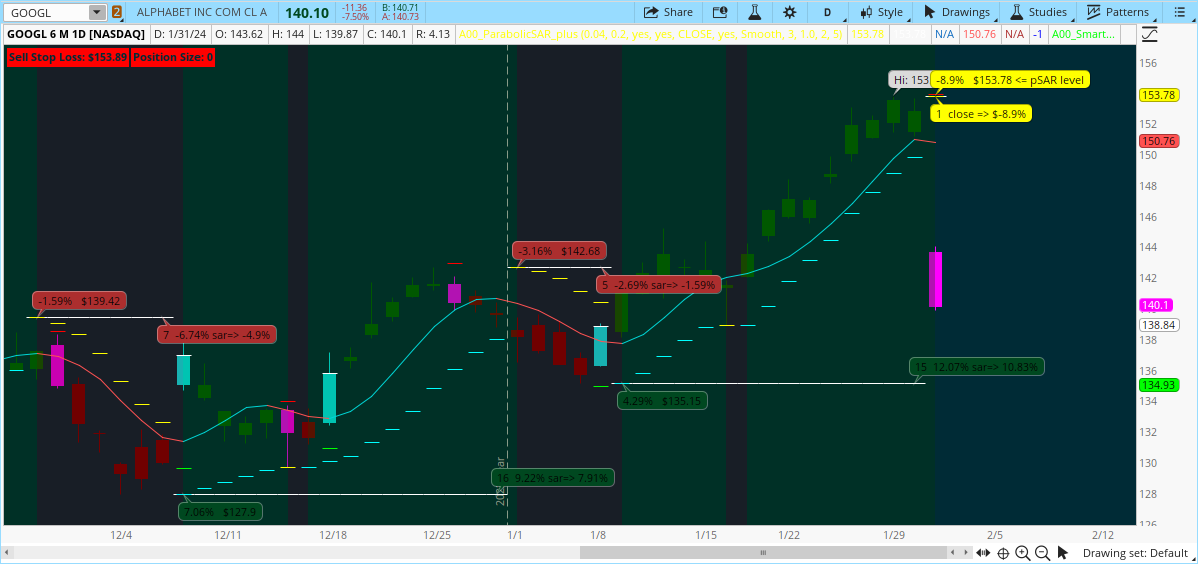
is anyone able to convert this indicator to thinkorswim?
https://www.tradingview.com/script/vLyl4omf-SuperTrend-Entry/
Code:
//@version=5
indicator("Smart Entry", shorttitle="Smart Entry", overlay=true , max_bars_back=5000)
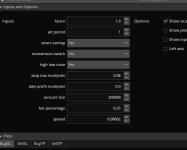
factor = input.float(1, "Factor", step = 0.01, group="Smart Momentum", inline="z")
atrPeriod = input.int(1, "ATR Period", step = 1, group="Smart Momentum", inline="z")
smartOverlay = input.bool(true, title="[Smart Overlay]", inline="z", group="Momentum Colors")
bullColor1 = input.color(#22ad22, title="[-Momentum Bull-]", inline="z", group="Momentum Colors")
bearColor1 = input.color(#e10000, title="[Momentum Bear]", inline="z", group="Momentum Colors")
momentumSwitch = input.bool(true, title="[Momentum Switch]", inline="z", group="Momentum Colors")
momentumSwitchBull = input.color(#ffe900, title="[--Switch Bull--]", inline="z", group="Momentum Colors")
momentumSwitchBear = input.color(#0006ff, title="[--Switch Bear--]", inline="z", group="Momentum Colors")
hlowRClose = input.bool(defval=true, title="High & Low or Highest Close & Lowest Close", tooltip="Use HIGH & LOW as stop loss refrence or Highest CLOSE & Lowest Close", group="Stops and Targets")
buyColorsl = input.color(#22ad22, title="*Long Stop Loss Color", inline="1", group="Stops and Targets")
sellColorsl = input.color(#e10000, title="*Short Stop Loss Color", inline="1", group="Stops and Targets")
buyColortp = input.color(color.white, title="Long Take Profit Color", inline="1", group="Stops and Targets")
sellColortp = input.color(color.gray, title="Short Take Profit Color", inline="1", group="Stops and Targets")
stopLossMultiplier = input.float(title="Stop Loss Multiplier", tooltip="0 Disables Take Profit", defval=0.08, step=0.05, group="Money Management", inline="2")
takeProfitMultiplier = input.float(title="Take Profit Multiplier", defval=0, step=0.05, group="Money Management", inline="2")
accountSize = input.float(title="Account Size", defval=200000.0, group="Money Management", inline="2")
betPercentage = input.float(title="------- Bet Percentage", defval=0.25, group="Money Management", inline="2")
spread = input.float(title="Spread", defval=0.00002,step=0.00001, group="Money Management", inline="2")
chartSizex = input.string("Small", title="Table Size", options=["Tiny","Small","Normal","Large","Huge"],inline="8",group="Entry Table")
chartPositionx = input.string(title="Table Position",group="Entry Table", defval="Top Right", inline="8",
options=["Top Right", "Top Center", "Top Left", "Middle Right", "Middle Center", "Middle Left", "Bottom Right", "Bottom Center", "Bottom Left"])
// Dynamic Table Position using user input string
var chartSize = size.tiny
if chartSizex == "Tiny"
chartSize := size.tiny
if chartSizex == "Small"
chartSize := size.small
if chartSizex == "Normal"
chartSize := size.normal
if chartSizex == "Large"
chartSize := size.large
if chartSizex == "Huge"
chartSize := size.huge
// Dynamic Table Position using user input string
var chartPosition = position.top_right
if chartPositionx == "Top Right"
chartPosition := position.top_right
if chartPositionx == "Top Center"
chartPosition := position.top_center
if chartPositionx == "Top Left"
chartPosition := position.top_left
if chartPositionx == "Middle Right"
chartPosition := position.middle_right
if chartPositionx == "Middle Center"
chartPosition := position.middle_center
if chartPositionx == "Middle Left"
chartPosition := position.middle_left
if chartPositionx == "Bottom Right"
chartPosition := position.bottom_right
if chartPositionx == "Bottom Center"
chartPosition := position.bottom_center
if chartPositionx == "Bottom Left"
chartPosition := position.bottom_left
//Wait for candle to close before you show signal or change in realtime
closeRrealtime = true
barState = (closeRrealtime == true) ? barstate.isconfirmed : barstate.isrealtime
HRC = hlowRClose ? high : close
LRC = hlowRClose ? low : close
HRO = hlowRClose ? high : open
LRO = hlowRClose ? low : open
// Get SuperTrend Values
[supertrend, direction] = ta.supertrend(factor, atrPeriod)
// Get ATR Filter
atr = ta.atr(14)
//Entry signal
bull_STC = close > supertrend and close[1] < supertrend[1]
bear_STC = close < supertrend and close[1] > supertrend[1]
//To get around runtime issue
bar_DEX =(bar_index > 10)
// How Many Green Bars Before the condtion hapeens again
howManyGB = (ta.barssince(bull_STC)) + 1
howManyRB = (ta.barssince(bear_STC)) + 1
howManyGBX = ta.barssince(bull_STC)
howManyRBX =ta.barssince(bear_STC)
howManyGBText = str.tostring(howManyGBX)
howManyRBText = str.tostring(howManyRBX)
// lookbackperiod so i dont get ZEROS in my look back period
lookBack = howManyGB > howManyRB ? howManyGB : howManyRB
// Get level using a changing lookback period added bar_DEX to fix loading on to chart issues
// get open values for the rare occurance that its actually the high rare but happens
lowLevel = bar_DEX ? ta.lowest(LRC,lookBack + 1) : na
lowLevelOpen = bar_DEX ? ta.lowest(open,lookBack + 1) : na
lowLevelX = lowLevelOpen < lowLevel ? lowLevelOpen : lowLevel
highLevel = bar_DEX ? ta.highest(HRC,lookBack + 1) : na
highLevelOpen = bar_DEX ? ta.highest(open,lookBack + 1) : na
highLevelX= highLevelOpen > highLevel ? highLevelOpen : highLevel
// include entry cand high or low in the lookback
lowLevelB = lowLevelX < LRO ? lowLevelX : LRO
highLevelB = highLevelX > HRO ? highLevelX : HRO
// Create StopLoss Point
sellStopLoss = highLevelB + (atr*stopLossMultiplier) + spread
buyStopLoss = lowLevelB - (atr*stopLossMultiplier) - spread
// Create TakeProfit / a reflection of stop loss
sellTakeProfit = (close - (sellStopLoss - close) * takeProfitMultiplier)
buyTakeProfit = (takeProfitMultiplier * (close - buyStopLoss) + close)
//position Sizing accountSize default 100,000 betpercentage default = 1 and
//0.01 to turn it into a percentage divide: stoploss too entry candle close is = sellTakeProfit (reflection)
// Minus close from sellTakeProfit to just get entry candle's stoploss to its close only
//multilpy by 10000 to get number of pips multiply by 10 to get answer in LOTs! (not micro or mini)
sellbuyPositionSizeA =(accountSize * (betPercentage * 0.01))
sellPositionSizeB= (sellStopLoss - close) * 10000 * 10
buyPositionSizeB= (close - buyStopLoss) * 10000 * 10
sellPositionSizeC = sellbuyPositionSizeA / sellPositionSizeB
buyPositionSizeC = sellbuyPositionSizeA / buyPositionSizeB
// change color based on current charts momentum
trendColor = bull_STC and momentumSwitch and smartOverlay ? momentumSwitchBull : bear_STC and momentumSwitch and smartOverlay ? momentumSwitchBear : close > supertrend and smartOverlay ? bullColor1 : close < supertrend and smartOverlay ? bearColor1 : na
barcolor(trendColor, title="Current Chart Momentum",editable=false)
// Prepare a table
var table myTable = table.new(chartPosition, 2, 3, border_width=1)
// Draw table
if barstate.islast and bear_STC
table.cell(myTable, column = 0, row = 2 ,text="SellStopLoss: " + str.tostring(math.round(sellStopLoss, 5)), text_color=#e10000, bgcolor=color.new(color.black,70), text_size=chartSize)
table.cell(myTable, column = 0, row = 1 ,text="Position Size: " + str.tostring(math.round(sellPositionSizeC, 2)), text_color=color.white, bgcolor=color.new(color.black,70), text_size=chartSize)
table.cell(myTable, column = 0, row = 0 ,text= takeProfitMultiplier > 0 ?"SellTakeProfit: " + str.tostring(math.round(sellTakeProfit, 5)) : na, text_color=#22ad22, bgcolor=color.new(color.black,takeProfitMultiplier > 0 ? 70 : 100), text_size=chartSize)
if barstate.islast and bull_STC
table.cell(myTable, column = 1, row = 2 ,text="BuyStopLoss: " + str.tostring(math.round(buyStopLoss, 5)), text_color=#e10000, bgcolor=color.new(color.gray,50), text_size=chartSize)
table.cell(myTable, column = 1, row = 1 ,text="Position Size: " + str.tostring(math.round(buyPositionSizeC, 2)), text_color=color.white, bgcolor=color.new(color.gray,50), text_size=chartSize)
table.cell(myTable, column = 1, row = 0 ,text= takeProfitMultiplier > 0 ? "BuyTakeProfit: " + str.tostring(math.round(buyTakeProfit, 5)) : na, text_color=#22ad22, bgcolor=color.new(color.gray,takeProfitMultiplier > 0 ? 50: 100), text_size=chartSize)
// Draw Take Profit and Stop Loss points
plot(bull_STC ? buyStopLoss : na, title = "Buy Stop Loss", color= #22ad22, linewidth=1, style=plot.style_linebr)
plot(bear_STC ? sellStopLoss : na, title = "Sell Stop Loss", color = #e10000, linewidth=1, style=plot.style_linebr)
plot(bull_STC ? buyTakeProfit : na, title = "Buy Take Profit", color = color.new(color.white, 0), linewidth=1, style=plot.style_linebr)
plot(bear_STC ? sellTakeProfit : na, title = "Sell Take Profit", color = color.new(color.gray, 0), linewidth=1, style=plot.style_linebr)
View attachment 20720