Mobius' notes:
RSI Laguerre is one of the all time favorites in the opinion of many in The Thinkscript Lounge. TheoTrade has a YouTube video on this with "indicator finds tops and bottoms" in the description.
Alerts are baked into the new (7-14-19) version below!!


There are more notes located in Tutorial Section!")
Grid Code: https://tos.mx/LldzdS
Scan Code: https://tos.mx/bRLjdq
Scan query RSI Laguerre
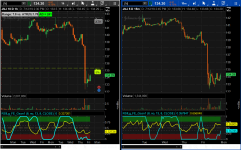
Both Fractal Energy and RSI are plotted. RSI in cyan and FE in yellow. Look for trend exhaustion in the FE and a reversal of RSI or Price compression in FE and an RSI reversal.
RSI Laguerre is one of the all time favorites in the opinion of many in The Thinkscript Lounge. TheoTrade has a YouTube video on this with "indicator finds tops and bottoms" in the description.
Alerts are baked into the new (7-14-19) version below!!
Rich (BB code):
# RSI-Laguerre Self Adjusting With Fractal Energy Gaussian Price Filter  # Mobius  # V01.12.2016
# Both Fractal Energy and RSI are plotted. RSI in cyan and FE in yellow. Look for trend exhaustion in the FE and a reversal of RSI or Price compression in FE and an RSI reversal.
# Rename Study to RSILg_FE_Gssn1 for compatability with Scanning
# Adjusted for compatability with scanner based on Mobius' notes.  7-14-19 Markos

declare lower;

#Inputs:
input nFE = 8;#hint nFE: length for Fractal Energy calculation.
input AlertOn = no;
input Glength  = 13;
input betaDev =  8;
input data = close;

def w = (2 * Double.Pi / Glength);
def beta = (1 - Cos(w)) / (Power(1.414, 2.0 / betaDev) - 1 );
def alpha = (-beta + Sqrt(beta * beta + 2 * beta));
def Go = Power(alpha, 4) * open +
             4 * (1 – alpha) * Go[1] – 6 * Power( 1 - alpha, 2 ) * Go[2] +
             4 * Power( 1 - alpha, 3 ) * Go[3] - Power( 1 - alpha, 4 ) * Go[4];
def Gh = Power(alpha, 4) * high +
             4 * (1 – alpha) * Gh[1] – 6 * Power( 1 - alpha, 2 ) * Gh[2] +
             4 * Power( 1 - alpha, 3 ) * Gh[3] - Power( 1 - alpha, 4 ) * Gh[4];
def Gl = Power(alpha, 4) * low +
             4 * (1 – alpha) * Gl[1] – 6 * Power( 1 - alpha, 2 ) * Gl[2] +
             4 * Power( 1 - alpha, 3 ) * Gl[3] - Power( 1 - alpha, 4 ) * Gl[4];
def Gc = Power(alpha, 4) * data +
             4 * (1 – alpha) * Gc[1] – 6 * Power( 1 - alpha, 2 ) * Gc[2] +
             4 * Power( 1 - alpha, 3 ) * Gc[3] - Power( 1 - alpha, 4 ) * Gc[4];
# Variables:
def o;
def h;
def l;
def c;
def CU1;
def CU2;
def CU;
def CD1;
def CD2;
def CD;
def L0;
def L1;
def L2;
def L3;
plot RSI;
plot OS;
plot OB;
plot M;

# Calculations
o = (Go + Gc[1]) / 2;
h = Max(Gh, Gc[1]);
l = Min(Gl, Gc[1]);
c = (o + h + l + Gc) / 4;
plot gamma = Log(Sum((Max(Gh, Gc[1]) - Min(Gl, Gc[1])), nFE) /
        (Highest(gh, nFE) - Lowest(Gl, nFE)))
            / Log(nFE);
gamma.SetDefaultColor(Color.Yellow);
L0 = (1 – gamma) * Gc + gamma * L0[1];
L1 = -gamma * L0 + L0[1] + gamma * L1[1];
L2 = -gamma * L1 + L1[1] + gamma * L2[1];
L3 = -gamma * L2 + L2[1] + gamma * L3[1];
if L0 >= L1
then {
    CU1 = L0 - L1;
    CD1 = 0;
} else {
    CD1 = L1 - L0;
    CU1 = 0;
}
if L1 >= L2
then {
    CU2 = CU1 + L1 - L2;
    CD2 = CD1;
} else {
    CD2 = CD1 + L2 - L1;
    CU2 = CU1;
}
if L2 >= L3
then {
    CU = CU2 + L2 - L3;
    CD = CD2;
} else {
    CU = CU2;
    CD = CD2 + L3 - L2;
}

RSI = if CU + CD <> 0 then CU / (CU + CD) else 0;
RSI.SetDefaultColor(Color.Cyan);
OS = if IsNaN(c) then Double.NaN else 0.2;
OS.SetDefaultColor(Color.RED);
OS.HideBubble();
OS.HideTitle();
OB = if IsNaN(c) then Double.NaN else 0.8;
OB.SetDefaultColor(Color.GREEN);
OB.HideBubble();
OB.HideTitle();
M = if IsNaN(c) then Double.NaN else 0.5;
M.SetStyle(Curve.long_dash);
M.SetDefaultColor(Color.Gray);
M.HideBubble();
M.HideTitle();
plot FEh = if isNaN(c) then double.nan else .618;
FEh.SetStyle(Curve.short_DASH);
FEh.HideBubble();
FEh.SetDefaultColor(Color.GRAY);
FEh.HideTitle();
plot FEl = if isNaN(c) then double.nan else .382;
FEl.SetStyle(Curve.short_DASH);
FEl.SetDefaultColor(Color.GRAY);
FEl.HideBubble();
FEl.HideTitle();
AddCloud(0, OS, Color.RED, Color.RED);
AddCloud(OB, 1, Color.Green, Color.Green);
Alert(AlertOn and RSI crosses below .8, "", Alert.BAR, Sound.Bell);
Alert(AlertOn and RSI crosses above .2, "", Alert.BAR, Sound.Bell);

# End Code RSI_Laguerre Self Adjusting with Fractal Energy
There are more notes located in Tutorial Section!
Grid Code: https://tos.mx/LldzdS
Scan Code: https://tos.mx/bRLjdq
Scan query RSI Laguerre
Code:
# Scan for RSI in Laguerre Time With Fractal Energy
# Mobius
# V02.07.2014
# V03.06.15.2016
#Scan
#Inputs:
input nFE = 8;
# Variables:
def o;
def h;
def l;
def c;
def CU1;
def CU2;
def CU;
def CD1;
def CD2;
def CD;
def L0;
def L1;
def L2;
def L3;
def RSI;
# Calculations
o = (open + close[1]) / 2;
h = Max(high, close[1]);
l = Min(low, close[1]);
c = (o + h + l + close) / 4;
def gamma = Log(Sum((Max(high, close[1]) - Min(low, close[1])), nFE) /
        (Highest(high, nFE) - Lowest(low, nFE)))
            / Log(nFE);
L0 = (1 – gamma) * c + gamma * L0[1];
L1 = -gamma * L0 + L0[1] + gamma * L1[1];
L2 = -gamma * L1 + L1[1] + gamma * L2[1];
L3 = -gamma * L2 + L2[1] + gamma * L3[1];
if L0 >= L1
then {
    CU1 = L0 - L1;
    CD1 = 0;
} else {
    CD1 = L1 - L0;
    CU1 = 0;
}
if L1 >= L2
then {
    CU2 = CU1 + L1 - L2;
    CD2 = CD1;
} else {
    CD2 = CD1 + L2 - L1;
    CU2 = CU1;
}
if L2 >= L3
then {
    CU = CU2 + L2 - L3;
    CD = CD2;
} else {
    CU = CU2;
    CD = CD2 + L3 - L2;
}
RSI = if CU + CD <> 0 then CU / (CU + CD) else 0;
# Note Comment-Out (#) whichever scan not being used.
# Long Scan
plot Long = RSI crosses above .2 and gamma > .6;
# Short Scan
#plot Short = RSI crosses below .8 and gamma > .6;
Attachments

Last edited: