## PLEASE READ ALL NOTES.
## OneNote Archive Name: RSI in Laguerre Time Self Adjusting With Fractal Energy _Mobius_JQ
## Archive Section: Momentum
## Suggested Tos Name: RSI_LaguerreTime_v20180919_Mobius_JQvisuals
## Archive Date: 5.15.2018
## Archive Notes:
## "##" indicates an addition or adjustment by the OneNote Archivist
## Modified Code Follows:
## 5.15.2018 JQ added code to permit user to disable bull and or bear alerts
## 5.19.2018 JQ added AddChartBubbble code on FE plot
## 9.19.2018 JQ added color to RSI Line
## 8.26.2019 JQ Added Gamma.Hide at row 97 or 98. Please Comment Out (#) if you want gamma back
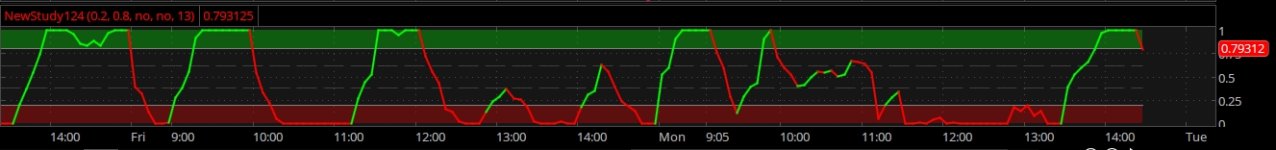
# TheoTrade RSI in Laguerre Time Self Adjusting With Fractal Energy
# Mobius
# V03.06.15.2016
#combine with:
# RSI in Laguerre Time Self Adjusting With Fractal Energy
# Mobius
# V02.07.2014
# V03.06.15.2016
# Both Fractal Energy and RSI are plotted. RSI in cyan and FE in yellow. Look for trend exhaustion in the FE and a reversal of RSI or Price compression in FE and an RSI reversal.
# Lounge Notes
#15:51 Mobius©: Short trade setup I look for with RSI Laguerre adjusted with FE.
#1) Polarity Change - Equity has gone from making higher highs and higher lows to making a lower high and lower low and is now putting in another lower high
#2) RSI Laguerre is above .8 and descending from 1
#3) Fractal Energy is below .38 and nose down or above .6 and rolling over. In the first case, below .38, FE is indicating trend exahustion and RSI is likely showing as a peak and not running across pegged at 1. In the second case Price has risen to a lower resistance and has been rolling slowly over building energy.
#Mobius©: I use a very simple method – RSI Laguerre and Fractal Energy on a list of very liquid stocks. I look for polarity change and trade when both RSI and FE are in “confluence”. If volatility is high enough I sell spreads if not I buy them. Other than hedging (which I do a lot of) that's it. I like it simple.
#The typical base setting I like to use for the FE is a length of 8. If I'm trading options I like to look at it about the length of time I'm buying or selling the option for. I want to know if it's reverting and where the energy is so I'll use a longer length for reversion and a shorter length to see if energy is building or waning.
#If RSI Laguerre is descending and FE over .6, that tells me something is changing and I'm already looking at an equity I've determined is about to make a polarity change. So the worse case that happens is that the security grinds sideways for a few days.
#A reading of the FE over .6 is an indication that energy has been built up. If the FE is high (over .6) and RSI LaGuerre is breaking lower FE will follow suit. If RSI reverses and goes above .8 I'm outa there, with the assumption I have a short position.
#FE is a gauge of both mean reverting and linearity. Descending readings indicate a trend is on.
#A reading below .3 indicates exhaustion in trend or near exhaustion.
#A reading above .6 indicates moving sideways with rapid reversion and energy building for a move again.
#Example:
#Above .6 - Think price compression or squeeze
#Below .3 - Think running out of gas
#Here's an example:
#FE at 60 periods is oscillating around .5 tightly while FE at 8 periods is over .6. Zscore is over 2 and is starting to roll over. That is a good short to the mean.
#Short trade setup I look for with RSI Laguerre adjusted with FE.
#1) Polarity Change - Equity has gone from making higher highs and higher lows to making a lower high and lower low and is now putting in another lower high
#2) RSI Laguerre is above .8 and descending from 1
#3) Fractal Energy is below .38 and nose down or above .6 and rolling over. In the first case, below .38, FE is indicating trend exhustion and RSI is likely showing as a peak and not running across pegged at 1. In the second case price has risen to a lower resistance and has been rolling slowly over building energy.
#Code Start
declare lower;
#Inputs:
input RSI_BullishTrigger = .2;
input RSI_BearishTrigger = .8;
input soundBullAlerts = no; ## 5.15.2018 new code
input soundBearAlerts = no; ## 5.15.2018 new code
input nFE = 13;#hint nFE: length for Fractal Energy calculation.
# Variables:
def o;
def h;
def l;
def c;
def CU1;
def CU2;
def CU;
def CD1;
def CD2;
def CD;
def L0;
def L1;
def L2;
def L3;
plot RSI;
plot OS;
plot OB;
# Calculations
o = (open + close[1]) / 2;
h = Max(high, close[1]);
l = Min(low, close[1]);
c = (o + h + l + close) / 4;
plot gamma = Log(Sum((Max(high, close[1]) - Min(low, close[1])), nFE) /
(Highest(high, nFE) - Lowest(low, nFE)))
/ Log(nFE);
gamma.SetDefaultColor(Color.Yellow);
gamma.hide(); #Comment out Gamma.Hide it you want it to show.#
L0 = (1 – gamma) * c + gamma * L0[1];
L1 = -gamma * L0 + L0[1] + gamma * L1[1];
L2 = -gamma * L1 + L1[1] + gamma * L2[1];
L3 = -gamma * L2 + L2[1] + gamma * L3[1];
if L0 >= L1
then {
CU1 = L0 - L1;
CD1 = 0;
} else {
CD1 = L1 - L0;
CU1 = 0;
}
if L1 >= L2
then {
CU2 = CU1 + L1 - L2;
CD2 = CD1;
} else {
CD2 = CD1 + L2 - L1;
CU2 = CU1;
}
if L2 >= L3
then {
CU = CU2 + L2 - L3;
CD = CD2;
} else {
CU = CU2;
CD = CD2 + L3 - L2;
}
RSI = if CU + CD <> 0 then CU / (CU + CD) else 0;
# RSI.SetDefaultColor(Color.Cyan); #JQ Mobius original code
# RSI Painting code by JQ 2018.07.30
RSI.AssignValueColor(
if (RSI > RSI_BearishTrigger) or ((RSI >= RSI[1]) and (RSI > RSI_BullishTrigger))
then Color.GREEN
else if (RSI < RSI_BUllishTrigger) or ((RSI < RSI[1]) and (RSI < RSI_BearishTrigger))
then Color.RED
else Color.white);
RSI.setlineWeight(2);
OS = if IsNaN(close) then Double.NaN else 0.2;
OS.SetDefaultColor(Color.Gray);
OS.HideBubble();
OS.HideTitle();
OB = if IsNaN(close) then Double.NaN else 0.8;
OB.SetDefaultColor(Color.Gray);
OB.HideBubble();
OB.HideTitle();
plot FEh = if isNaN(close) then double.nan else .618;
FEh.SetStyle(Curve.Long_Dash);
FEh.HideBubble();
FEh.SetDefaultColor(Color.Dark_Gray);
FEh.HideTitle();
plot FEl = if isNaN(close) then double.nan else .382;
FEl.SetStyle(Curve.Long_Dash);
FEl.SetDefaultColor(Color.Dark_Gray);
FEl.HideBubble();
FEl.HideTitle();
AddCloud(0, OS, Color.Red, Color.Red);
AddCloud(OB, 1, Color.Green, Color.Green);
Alert(soundBearAlerts and RSI crosses below .8, "", Alert.BAR, Sound.Ding); ## 5.15.2018 JQ added Boolean
Alert(soundBullAlerts and RSI crosses above .2, "", Alert.BAR, Sound.Ding) ;## 5.15.2018 JQ added Boolean
# Labels below added by Johnny Quotron based on zztop notes above 2018-04-11
def FE = gamma;
#addlabel (FE < .382, " FE is Linear (Price Trending) = " + FE, Color.light_GREEN);
#addlabel (FE > .618, " FE is Non-Linear/Random (Trendless) = " + FE, Color.Light_GRAY);
#addlabel (FE <= .618 and FE >= .382, " FE is transitioning = " + FE, Color.Light_orange);
#AddChartBubble(!IsNaN(close) and IsNaN(close[-1]), FE, if FE < .382 then "Trending" else "Not Trending", Color.WHITE, yes);
#AddChartBubble(!IsNaN(close) and IsNaN(close[-1]), FE, if FE < .382 then "Trending" else if FE < .618 then "Transitioning" else "Building Energy", gamma.#takeValueColor(), yes); ## 5.19.2018 JQ
# End Code RSI_LaguerreTime_v20180919_Mobius_JQvisuals


")