
https://usethinkscript.com/threads/...-energy-for-thinkorswim.116/page-8#post-16988Hey everyone. Happy Thanksgiving!
I've been trying to read as much as possible and there's so much to take in but I haven't found any answers to the following:
1. Are there any other Gaussian RSI Laguerre Indicators out there? I love the original Mobius V01.12.2016 filter as it removes so much unwanted noise, but I'm interested in tinkering around further.
2. Is there any way to get the upper chart "painted" with arrows as the RSI leaves their upper and lower channels? with the original Gaussian filter?
You are using an out of date browser. It may not display this or other websites correctly.
You should upgrade or use an alternative browser.
You should upgrade or use an alternative browser.
RSI Laguerre with Fractal Energy for ThinkorSwim
- Thread starter markos
- Start date
-
- Tags
- oscillator
Thank you kind sir. I saw it but didn‘t test that one out—didn’t realize it had the gaussian filter too which is just beyond awesome.
Speeds
New member
I was interested in coloring the candles when the RSI is at 0-.20 red, .21-.79 grey and .80-1.0 green, maybe with a on/off switch so I can turn on only when I want to briefly view then turn off. Is it a common short script I can paste in the RSILe indicator? It is awesome how helpful the people on this site are. I have started learning Thinkscript but never posted here before and thought this may be an interesting one for me to learn from. Thank you.
#RSILg_FE_3_9_19
declare lower;
#Inputs:
input nFE = 8;#hint nFE: length for Fractal Energy calculation.
input AlertOn = yes;
input Glength = 13;
input betaDev = 8;
input data = close;
def w = (2 * Double.Pi / Glength);
def beta = (1 - Cos(w)) / (Power(1.414, 2.0 / betaDev) - 1 );
def alpha = (-beta + Sqrt(beta * beta + 2 * beta));
def Go = Power(alpha, 4) * open +
4 * (1 – alpha) * Go[1] – 6 * Power( 1 - alpha, 2 ) * Go[2] +
4 * Power( 1 - alpha, 3 ) * Go[3] - Power( 1 - alpha, 4 ) * Go[4];
def Gh = Power(alpha, 4) * high +
4 * (1 – alpha) * Gh[1] – 6 * Power( 1 - alpha, 2 ) * Gh[2] +
4 * Power( 1 - alpha, 3 ) * Gh[3] - Power( 1 - alpha, 4 ) * Gh[4];
def Gl = Power(alpha, 4) * low +
4 * (1 – alpha) * Gl[1] – 6 * Power( 1 - alpha, 2 ) * Gl[2] +
4 * Power( 1 - alpha, 3 ) * Gl[3] - Power( 1 - alpha, 4 ) * Gl[4];
def Gc = Power(alpha, 4) * data +
4 * (1 – alpha) * Gc[1] – 6 * Power( 1 - alpha, 2 ) * Gc[2] +
4 * Power( 1 - alpha, 3 ) * Gc[3] - Power( 1 - alpha, 4 ) * Gc[4];
# Variables:
def o;
def h;
def l;
def c;
def CU1;
def CU2;
def CU;
def CD1;
def CD2;
def CD;
def L0;
def L1;
def L2;
def L3;
plot RSI;
plot OS;
plot OB;
plot M;
# Calculations
o = (Go + Gc[1]) / 2;
h = Max(Gh, Gc[1]);
l = Min(Gl, Gc[1]);
c = (o + h + l + Gc) / 4;
plot gamma = Log(Sum((Max(Gh, Gc[1]) - Min(Gl, Gc[1])), nFE) /
(Highest(gh, nFE) - Lowest(Gl, nFE)))
/ Log(nFE);
gamma.SetDefaultColor(Color.Yellow);
L0 = (1 – gamma) * Gc + gamma * L0[1];
L1 = -gamma * L0 + L0[1] + gamma * L1[1];
L2 = -gamma * L1 + L1[1] + gamma * L2[1];
L3 = -gamma * L2 + L2[1] + gamma * L3[1];
if L0 >= L1
then {
CU1 = L0 - L1;
CD1 = 0;
} else {
CD1 = L1 - L0;
CU1 = 0;
}
if L1 >= L2
then {
CU2 = CU1 + L1 - L2;
CD2 = CD1;
} else {
CD2 = CD1 + L2 - L1;
CU2 = CU1;
}
if L2 >= L3
then {
CU = CU2 + L2 - L3;
CD = CD2;
} else {
CU = CU2;
CD = CD2 + L3 - L2;
}
RSI = if CU + CD <> 0 then CU / (CU + CD) else 0;
RSI.SetDefaultColor(Color.Cyan);
OS = if IsNaN(c) then Double.NaN else 0.2;
OS.SetDefaultColor(Color.Gray);
OS.HideBubble();
OS.HideTitle();
OB = if IsNaN(c) then Double.NaN else 0.8;
OB.SetDefaultColor(Color.Gray);
OB.HideBubble();
OB.HideTitle();
M = if IsNaN(c) then Double.NaN else 0.5;
M.SetStyle(Curve.Points);
M.SetDefaultColor(Color.Gray);
M.HideBubble();
M.HideTitle();
plot FEh = if isNaN(c) then double.nan else .618;
FEh.SetStyle(Curve.Long_Dash);
FEh.HideBubble();
FEh.SetDefaultColor(Color.Dark_Gray);
FEh.HideTitle();
plot FEl = if isNaN(c) then double.nan else .382;
FEl.SetStyle(Curve.Long_Dash);
FEl.SetDefaultColor(Color.Dark_Gray);
FEl.HideBubble();
FEl.HideTitle();
AddCloud(0, OS, Color.LIGHT_RED, Color.LIGHT_RED);
AddCloud(OB, 1, Color.Green, Color.Green);
#Alert(AlertOn and RSI crosses below .9, "", Alert.BAR, Sound.Bell);
#Alert(AlertOn and RSI crosses above .1, "", Alert.BAR, Sound.Bell);
# End Code RSI_Laguerre Self Adjusting with Fractal Energy
# Trade Management
def ATR = Average(TrueRange(h,c,l), 20);
def longCond = if RSI crosses above .2
then c
else if RSI < .8
then double.nan
else longCond[1];
def shortCond = if RSI crosses below .8
then c
else if RSI > .2
then double.nan
else shortCond[1];
def upperTarget = if !isNaN(longCond) and ((RSI > RSI[1]) or (RSI > .8))
then Round((longCond + (1.5 * ATR)) / TickSize(), 0) * TickSize()
else if !isNaN(shortCond) or ((RSI < RSI[1]) or (RSI crosses below .2))
then double.nan
else upperTarget[1];
def upperBreached = if close crosses above upperTarget
then 1
else if close crosses below .5
then 0
else upperBreached[1];
def lowerTarget = if !isNaN(shortCond)
then Round((shortCond - (1.5 * ATR)) / TickSize(), 0) * TickSize()
else if !isNaN(longCond)
then double.nan
else lowerTarget[1];
def LTbreach = if close crosses below lowerTarget
then 1
else if RSI crosses above .5
then 0
else LTbreach[1];
addLabel(upperTarget, if upperBreached
then "Target Breached " + AsDollars(upperTarget)
else "Target = " + AsDollars(Round(upperTarget, 2)), color.green);
addLabel(lowerTarget, if LTbreach
then "Target Breached " + AsDollars(LowerTarget)
else "Target = " + AsDollars(Round(lowerTarget, 2)), color.red);
Add this to the bottom of your script:I was interested in coloring the candles when the RSI is at 0-.20 red, .21-.79 grey and .80-1.0 green, maybe with a on/off switch so I can turn on only when I want to briefly view then turn off. Is it a common short script I can paste in the RSILe indicator? It is awesome how helpful the people on this site are. I have started learning Thinkscript but never posted here before and thought this may be an interesting one for me to learn from. Thank you.
Ruby:
input PaintCandles = yes ;
AssignPriceColor(if !PaintCandles then color.current else
if RSI > .80 then color.green else
if RSI > .21 then color.gray else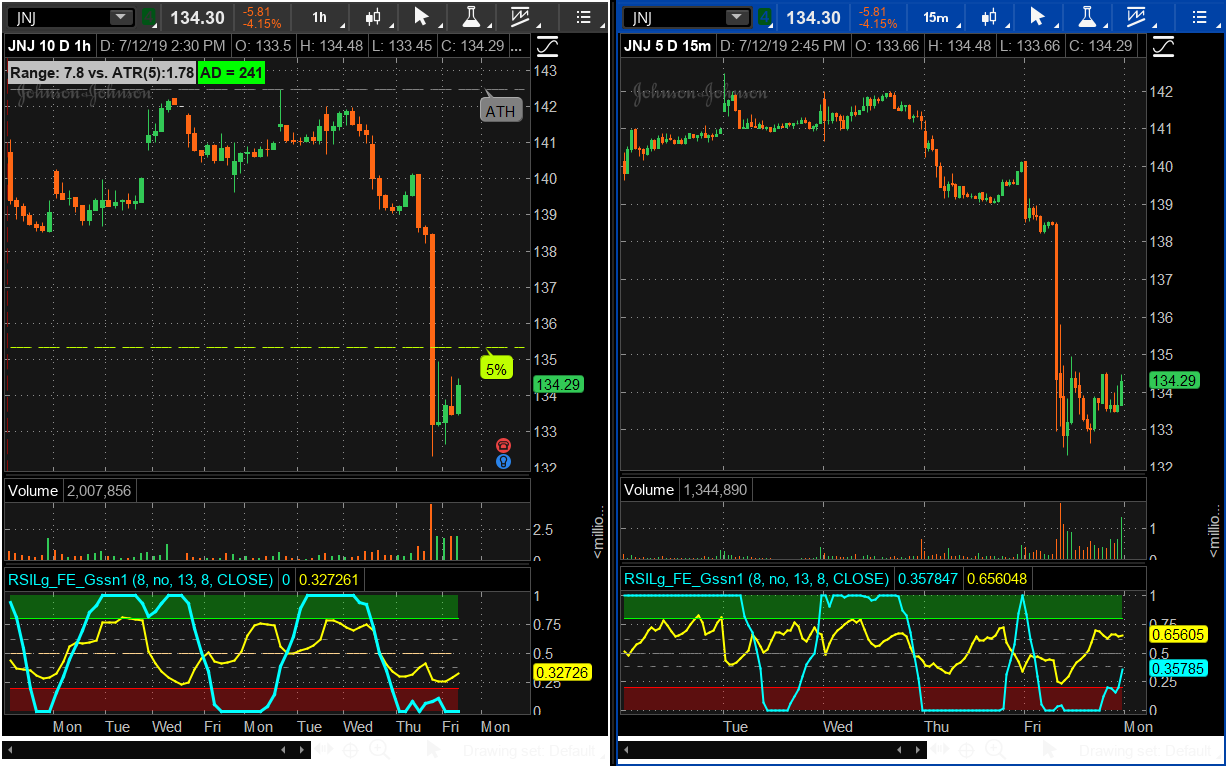
color.red);I used this version of code(included below) to add the visuals(Label,Alertbubble) to the RSILaguerre study - Works OK, but the Alertbubbles on the top right-hand corner is partially obstructing the RSI/gamma plots, as shown in the attached screenshot.
How can I move these alertbubbles to the top left-hand corner so its out of the way or convert these as labels to print on top left-hand corner of the lower study? Thanks!

Any ideas?
How can I move these alertbubbles to the top left-hand corner so its out of the way or convert these as labels to print on top left-hand corner of the lower study? Thanks!
Code:
# RSI-Laguerre Self Adjusting With Fractal Energy Gaussian Price Filter  # Mobius  # V01.12.2016
# Both Fractal Energy and RSI are plotted. RSI in cyan and FE in yellow. Look for trend exhaustion in the FE and a reversal of RSI or Price compression in FE and an RSI reversal.
# Rename Study to RSILg_FE_Gssn1 for compatability with Scanning
# Adjusted for compatability with scanner based on Mobius' notes.  7-14-19 Markos

declare lower;

#Inputs:
input nFE = 8;#hint nFE: length for Fractal Energy calculation.
input AlertOn = no;
input Glength  = 13;
input betaDev =  8;
input data = close;

def w = (2 * Double.Pi / Glength);
def beta = (1 - Cos(w)) / (Power(1.414, 2.0 / betaDev) - 1 );
def alpha = (-beta + Sqrt(beta * beta + 2 * beta));
def Go = Power(alpha, 4) * open +
             4 * (1 – alpha) * Go[1] – 6 * Power( 1 - alpha, 2 ) * Go[2] +
             4 * Power( 1 - alpha, 3 ) * Go[3] - Power( 1 - alpha, 4 ) * Go[4];
def Gh = Power(alpha, 4) * high +
             4 * (1 – alpha) * Gh[1] – 6 * Power( 1 - alpha, 2 ) * Gh[2] +
             4 * Power( 1 - alpha, 3 ) * Gh[3] - Power( 1 - alpha, 4 ) * Gh[4];
def Gl = Power(alpha, 4) * low +
             4 * (1 – alpha) * Gl[1] – 6 * Power( 1 - alpha, 2 ) * Gl[2] +
             4 * Power( 1 - alpha, 3 ) * Gl[3] - Power( 1 - alpha, 4 ) * Gl[4];
def Gc = Power(alpha, 4) * data +
             4 * (1 – alpha) * Gc[1] – 6 * Power( 1 - alpha, 2 ) * Gc[2] +
             4 * Power( 1 - alpha, 3 ) * Gc[3] - Power( 1 - alpha, 4 ) * Gc[4];
# Variables:
def o;
def h;
def l;
def c;
def CU1;
def CU2;
def CU;
def CD1;
def CD2;
def CD;
def L0;
def L1;
def L2;
def L3;
plot RSI;
plot OS;
plot OB;
plot M;

# Calculations
o = (Go + Gc[1]) / 2;
h = Max(Gh, Gc[1]);
l = Min(Gl, Gc[1]);
c = (o + h + l + Gc) / 4;
plot gamma = Log(Sum((Max(Gh, Gc[1]) - Min(Gl, Gc[1])), nFE) /
        (Highest(gh, nFE) - Lowest(Gl, nFE)))
            / Log(nFE);
gamma.SetDefaultColor(Color.Yellow);
L0 = (1 – gamma) * Gc + gamma * L0[1];
L1 = -gamma * L0 + L0[1] + gamma * L1[1];
L2 = -gamma * L1 + L1[1] + gamma * L2[1];
L3 = -gamma * L2 + L2[1] + gamma * L3[1];
if L0 >= L1
then {
    CU1 = L0 - L1;
    CD1 = 0;
} else {
    CD1 = L1 - L0;
    CU1 = 0;
}
if L1 >= L2
then {
    CU2 = CU1 + L1 - L2;
    CD2 = CD1;
} else {
    CD2 = CD1 + L2 - L1;
    CU2 = CU1;
}
if L2 >= L3
then {
    CU = CU2 + L2 - L3;
    CD = CD2;
} else {
    CU = CU2;
    CD = CD2 + L3 - L2;
}

RSI = if CU + CD <> 0 then CU / (CU + CD) else 0;
RSI.SetDefaultColor(Color.Cyan);
OS = if IsNaN(c) then Double.NaN else 0.2;
OS.SetDefaultColor(Color.GREEN);
OS.HideBubble();
OS.HideTitle();
OB = if IsNaN(c) then Double.NaN else 0.8;
OB.SetDefaultColor(Color.PINK);
OB.HideBubble();
OB.HideTitle();
M = if IsNaN(c) then Double.NaN else 0.5;
M.SetStyle(Curve.long_dash);
M.SetDefaultColor(Color.Gray);
M.HideBubble();
M.HideTitle();
plot FEh = if isNaN(c) then double.nan else .618;
FEh.SetStyle(Curve.short_DASH);
FEh.HideBubble();
FEh.SetDefaultColor(Color.GRAY);
FEh.HideTitle();
plot FEl = if isNaN(c) then double.nan else .382;
FEl.SetStyle(Curve.short_DASH);
FEl.SetDefaultColor(Color.GRAY);
FEl.HideBubble();
FEl.HideTitle();
AddCloud(0, OS, Color.GREEN, Color.GREEN);
AddCloud(OB, 1, Color.PINK, Color.PINK);
Alert(AlertOn and RSI crosses below .8, "", Alert.BAR, Sound.Bell);
Alert(AlertOn and RSI crosses above .2, "", Alert.BAR, Sound.Bell);

# End Code RSI_Laguerre Self Adjusting with Fractal Energy

## OneNote Archive Name: RSI_Laguerre With FE_AutoAdj_v2018_10_12_Mobius_JQvisuals

## Archive Section:

## Suggested Tos Name: RSI_LaguerreWithFE_AutoAdj_v2018_10_12_Mobius_JQvisuals

## Archive Date: 5.15.2018

## Archive Notes:


## "##" indicates an addition or adjustment by the OneNote Archivist


## Modified Code Follows

## 5.15.2018 JQ added code to permit user to disable bull and or bear alerts

## 5.19.2018 JQ added AddChartBubbble code on FE plot

## 9.19.2018 JQ added color to RSI Line

## 10.9.2018 JQ added FE dots

## 10.12.2018 JQ added takevaluecolor statements


# RSI in Laguerre Time Self Adjusting With Fractal Energy

# Mobius

# V03.06.15.2016

# Both Fractal Energy and RSI are plotted. RSI in cyan and FE in yellow. Look for trend exhaustion in the FE and a reversal of RSI or Price compression in FE and an RSI reversal.


## Lounge Notes

#15:51 Mobius©: Short trade setup I look for with RSI Laguerre adjusted with FE.

#1) Polarity Change - Equity has gone from making higher highs and higher lows to making a lower high and lower low and is now putting in another lower high

#2) RSI Laguerrer is above .8 and descending from 1

#3) Fractal Energy is below .38 and nose down or above .6 and rolling over. In the first case, below .38, FE is indicating trend exahustion and RSI is likely showing as a peak and not running across pegged at 1. In the second case Price has risen to a lower resistance and has been rolling slowly over building energy.


#Mobius©: I use a very simple method – RSI Laguerre and Fractal Energy on a list of very liquid stocks. I look for polarity change and trade when both RSI and FE are in “confluence”. If volatility is high enough I sell spreads if not I buy them. Other than hedging (which I do a lot of) that's it. I like it simple.


#The typical base setting I like to use for the FE is a length of 8. If I'm trading options I like to look at it about the length of time I'm buying or selling the option for. I want to know if it's reverting and where the energy is so I'll use a longer length for reversion and a shorter length to see if energy is building or waning.


#If RSI Laguerre is descending and FE over .6, that tells me something is changing and I'm already looking at an equity I've determined is about to make a polarity change. So the worse case that happens is that the security grinds sideways for a few days.


#A reading of the FE over .6 is an indication that energy has been built up. If the FE is high (over .6) and RSI LaGuerre is breaking lower FE will follow suit. If RSI reverses and goes above .8 I'm outa there, with the assumption I have a short position.


#FE is a gauge of both mean reverting and linearity. Descending readings indicate a trend is on. A reading below .3 indicates exhaustion in trend or near exhaustion. A reading above .6 indicates moving sideways with rapid reversion and energy building for a move again.


#Above .6 - Think price compression or squeeze

#Below .3 - Think running out of gas


# Here's an example:

#FE at 60 periods is oscillating around .5 tightly while FE at 8 periods is over .6. Zscore is over 2 and is starting to roll over. That is a good short to the mean.


#Short trade setup I look for with RSI Laguerre adjusted with FE.


#1) Polarity Change - Equity has gone from making higher highs and higher lows to making a lower high and lower low and is now putting in another lower high


#2) RSI Laguerrer is above .8 and descending from 1


#3) Fractal Energy is below .38 and nose down or above .6 and rolling over. In the first case, below .38, FE is indicating trend exahustion and RSI is likely showing as a peak and not running across pegged at 1. In the second case price has risen to a lower resistance and has been rolling slowly over building energy.


# Labels below added by Johnny Quotron based on zztop notes above 2018-04-11


def FE = gamma;

addlabel (FE < .382, " FE is Linear (Price Trending) = " + FE, Color.light_GREEN);

addlabel (FE > .618, " FE is Non-Linear/Random (Trendless) = " + FE, Color.Light_GRAY);

addlabel (FE <= .618 and FE >= .382, " FE is transitioning = " + FE, Color.Light_orange);

AddChartBubble(!IsNaN(close) and IsNaN(close[-1]), FE, if FE < .382 then "Trending" else "Not Trending", Color.WHITE, yes);

AddChartBubble(!IsNaN(close) and IsNaN(close[-1]), FE, if FE < .382 then "Trending" else if FE < .618 then "Transitioning" else "Building Energy", gamma.takeValueColor(), yes);
## 5.19.2018 JQ


# End Code RSI_Laguerre Self Adjusting with Fractal Energy


# Fractal Linear Energy

# Mobius

# 5.16.2016

# zztop Notes


# This indicator does NOT indicate OB or OS but linear or non-linear

# The closer to 1 the more non-linear (compressed or random) price is.

# The closer to 0 the more linear (trending) price is.


# Fractal Energy isn't an indicator - it's a way of looking at price

# to see if it's linear or random. There are NO trading signals on the

# FE study. Only signals NOT to trade.

#

# If the FE is at extremes, something is about to change. It's leading

# you to a conclusion. If the FE is below .382, price is parabolic and

# cannot maintain that. But you may not want to sell because it may

# still go further in it's trend and it may not change direction right

# away. It's telling you though that it's not going to stay trending

# at the current rate of speed. If it's over .618 it telling you price

# is compressing and going sideways rebuilding energy getting ready for

# another run one way ot the other.

#

# Using price in fractals and different times, or ORB with FE and

# supertrend or some way to measure when price expansion is contracting

# or expanding is all you need. Any more than that and you'll be

# paralyzed by information overload

#

# FE does not indicate direction at all. It simply shows linearity or

# non-linearity. Trend or non-trend. It has nothing that determines

# which way trend is going, as in up or down.

#

# Lets say you want to buy ABC company. FE on a monthly, weekly and daily

# shows values of 40, 35 and 30. Price is showing lower lows but random

# lower high. You would know ABC company is close to selling exhaustion

# and it's time to look for a few higher highs to a near term fractal

# pivot then look for short reversal to a higher low over the previous

# recent low and when the bars start setting high highs and lower lows

# again it's time to go long. The FE is what tells you to start looking

# for those signals
Any ideas?
Last edited by a moderator:
i am not sure if this what you wantAny ideas?
def FE = gamma;
addlabel (FE < .382, " FE is Linear (Price Trending) = " + FE, Color.light_GREEN);
addlabel (FE > .618, " FE is Non-Linear/Random (Trendless) = " + FE, Color.Light_GRAY);
addlabel (FE <= .618 and FE >= .382, " FE is transitioning = " + FE, Color.Light_orange);
addlabel (yes, if FE < .382 then "Trending" else "Not Trending", Color.WHITE);
addlabel (yes, if FE < .382 then "Trending" else if FE < .618 then "Transitioning" else "Building Energy", gamma.takeValueColor());
Speeds
New member
Add this to the bottom of your script:
Ruby:input PaintCandles = yes ; AssignPriceColor(if !PaintCandles then color.current else if RSI > .80 then color.green else if RSI > .21 then color.gray else color.red);
This is what I was thinking and wanted to see how it looked. I might even use it sometimes.
Code:
declare lower;

input length = 14;
input over_Bought = 70;
input over_Sold = 30;
input price = close;
input averageType = AverageType.WILDERS;
input showBreakoutSignals = no;

def NetChgAvg = MovingAverage(averageType, price - price[1], length);
def TotChgAvg = MovingAverage(averageType, AbsValue(price - price[1]), length);
def ChgRatio = if TotChgAvg != 0 then NetChgAvg / TotChgAvg else 0;

plot RSI = 50 * (ChgRatio + 1);
plot OverSold = over_Sold;
plot OverBought = over_Bought;
plot UpSignal = if RSI crosses above OverSold then OverSold else Double.NaN;
plot DownSignal = if RSI crosses below OverBought then OverBought else Double.NaN;

UpSignal.SetHiding(!showBreakoutSignals);
DownSignal.SetHiding(!showBreakoutSignals);

RSI.DefineColor("OverBought", GetColor(5));
RSI.DefineColor("Normal", GetColor(7));
RSI.DefineColor("OverSold", GetColor(1));
RSI.AssignValueColor(if RSI > over_Bought then RSI.Color("OverBought") else if RSI < over_Sold then RSI.Color("OverSold") else RSI.Color("Normal"));
OverSold.SetDefaultColor(GetColor(8));
OverBought.SetDefaultColor(GetColor(8));
UpSignal.SetDefaultColor(Color.UPTICK);
UpSignal.SetPaintingStrategy(PaintingStrategy.ARROW_UP);
DownSignal.SetDefaultColor(Color.DOWNTICK);
DownSignal.SetPaintingStrategy(PaintingStrategy.ARROW_DOWN);
##########################
input PaintCandles = yes ;
AssignPriceColor(if !PaintCandles then Color.CURRENT else
if RSI > over_Bought then Color.RED else
if RSI < over_Sold then Color.GREEN else
Color.GRAY);Fierce_Ninja
New member
Total noob here and just started to go over this fantastic thread. Could you please tell me what do you think of a similar script written here: https://docstradingtools.com/fractalenergy/ Is this very different from what we are doing on this thread?
The FE study is the same script.Total noob here and just started to go over this fantastic thread. Could you please tell me what do you think of a similar script written here: https://docstradingtools.com/fractalenergy/ Is this very different from what we are doing on this thread?
FuturesTrader2022
Member
Is it possible to add an alert code each time the the chart bubble E fires exhaustion?
https://usethinkscript.com/threads/...djusting-with-fractal-energy-usage-notes.219/
https://usethinkscript.com/threads/...djusting-with-fractal-energy-usage-notes.219/
Code:
# RSI-Laguerre Self Adjusting With Fractal Energy Gaussian Price Filter
# Mobius
# V01.12.2016
# Both Fractal Energy and RSI are plotted. RSI in cyan and FE in yellow. Look for trend exhaustion in the FE and a reversal of RSI or Price compression in FE and an RSI reversal.

declare lower;

#Inputs:
input nFE = 8;#hint nFE: length for Fractal Energy calculation.
input AlertOn = yes;
input Glength  = 13;
input betaDev =  8;
input data = close;
input showBreakoutSignals = no;
input showpolarity = no;

def w = (2 * Double.Pi / Glength);
def beta = (1 - Cos(w)) / (Power(1.414, 2.0 / betaDev) - 1 );
def alpha = (-beta + Sqrt(beta * beta + 2 * beta));
def Go = Power(alpha, 4) * open +
             4 * (1 – alpha) * Go[1] – 6 * Power( 1 - alpha, 2 ) * Go[2] +
             4 * Power( 1 - alpha, 3 ) * Go[3] - Power( 1 - alpha, 4 ) * Go[4];
def Gh = Power(alpha, 4) * high +
             4 * (1 – alpha) * Gh[1] – 6 * Power( 1 - alpha, 2 ) * Gh[2] +
             4 * Power( 1 - alpha, 3 ) * Gh[3] - Power( 1 - alpha, 4 ) * Gh[4];
def Gl = Power(alpha, 4) * low +
             4 * (1 – alpha) * Gl[1] – 6 * Power( 1 - alpha, 2 ) * Gl[2] +
             4 * Power( 1 - alpha, 3 ) * Gl[3] - Power( 1 - alpha, 4 ) * Gl[4];
def Gc = Power(alpha, 4) * data +
             4 * (1 – alpha) * Gc[1] – 6 * Power( 1 - alpha, 2 ) * Gc[2] +
             4 * Power( 1 - alpha, 3 ) * Gc[3] - Power( 1 - alpha, 4 ) * Gc[4];
# Variables:
def o;
def h;
def l;
def c;
def CU1;
def CU2;
def CU;
def CD1;
def CD2;
def CD;
def L0;
def L1;
def L2;
def L3;
plot RSI;
plot OS;
plot OB;
#plot M;

# Calculations
o = (Go + Gc[1]) / 2;
h = Max(Gh, Gc[1]);
l = Min(Gl, Gc[1]);
c = (o + h + l + Gc) / 4;
plot gamma = Log(Sum((Max(Gh, Gc[1]) - Min(Gl, Gc[1])), nFE) /
        (Highest(gh, nFE) - Lowest(Gl, nFE)))
            / Log(nFE);
gamma.SetDefaultColor(Color.BLUE);
gamma.SetLineWeight(1);
gamma.SetPaintingStrategy(PaintingStrategy.LINE_VS_POINTS);

L0 = (1 – gamma) * Gc + gamma * L0[1];
L1 = -gamma * L0 + L0[1] + gamma * L1[1];
L2 = -gamma * L1 + L1[1] + gamma * L2[1];
L3 = -gamma * L2 + L2[1] + gamma * L3[1];
if L0 >= L1
then {
    CU1 = L0 - L1;
    CD1 = 0;
} else {
    CD1 = L1 - L0;
    CU1 = 0;
}
if L1 >= L2
then {
    CU2 = CU1 + L1 - L2;
    CD2 = CD1;
} else {
    CD2 = CD1 + L2 - L1;
    CU2 = CU1;
}
if L2 >= L3
then {
    CU = CU2 + L2 - L3;
    CD = CD2;
} else {
    CU = CU2;
    CD = CD2 + L3 - L2;
}

RSI = if CU + CD <> 0 then CU / (CU + CD) else 0;
RSI.SetDefaultColor(Color.Cyan);
OS = if IsNaN(c) then Double.NaN else 0.2;
OS.SetDefaultColor(Color.Gray);
OS.HideBubble();
OS.HideTitle();
OB = if IsNaN(c) then Double.NaN else 0.8;
OB.SetDefaultColor(Color.Gray);
OB.HideBubble();
OB.HideTitle();
#M = if IsNaN(c) then Double.NaN else 0.5;
#M.SetStyle(Curve.Points);
#M.SetDefaultColor(Color.Gray);
#M.HideBubble();
#M.HideTitle();
plot FEh = if isNaN(c) then double.nan else .618;
FEh.SetStyle(Curve.Long_Dash);
FEh.HideBubble();
FEh.SetDefaultColor(Color.Dark_Gray);
FEh.HideTitle();
plot FEl = if isNaN(c) then double.nan else .382;
FEl.SetStyle(Curve.Long_Dash);
FEl.SetDefaultColor(Color.Dark_Gray);
FEl.HideBubble();
FEl.HideTitle();
AddCloud(0, OS, Color.GRAY, Color.GRAY);
AddCloud(OB, 1, Color.GRAY, Color.GRAY);
#Alert(AlertOn and RSI crosses below .9, "", Alert.BAR, Sound.Bell);
#Alert(AlertOn and RSI crosses above .1, "", Alert.BAR, Sound.Bell);

# End Code RSI_Laguerre Self Adjusting with Fractal Energy

# Trade Management
def ATR = Average(TrueRange(h,c,l), 20);
def longCond = if RSI crosses above .2
               then c
               else if RSI < .8
                    then double.nan
                    else longCond[1];
def shortCond = if RSI crosses below .8
                then c
                else if RSI > .2
                     then double.nan
                     else shortCond[1];
def upperTarget = if !isNaN(longCond) and ((RSI > RSI[1]) or (RSI > .8))
                  then Round((longCond + (1.5 * ATR)) / TickSize(), 0) * TickSize()
                  else if !isNaN(shortCond) or ((RSI < RSI[1]) or (RSI crosses below .2))
                       then double.nan
                  else upperTarget[1];
def upperBreached = if close crosses above upperTarget
                    then 1
                    else if close crosses below .5
                         then 0
                         else upperBreached[1];
def lowerTarget = if !isNaN(shortCond)
                  then Round((shortCond - (1.5 * ATR)) / TickSize(), 0) * TickSize()
                  else if !isNaN(longCond)
                       then double.nan
                  else lowerTarget[1];
def LTbreach = if close crosses below lowerTarget
               then 1
               else if RSI crosses above .5
                    then 0
                    else LTbreach[1];
#addLabel(upperTarget, if upperBreached
                     #then "Target Breached  " + AsDollars(upperTarget)
                      #else "Target = " + AsDollars(Round(upperTarget, 2)), color.green);
#addLabel(lowerTarget, if LTbreach
                     #then "Target Breached  " + AsDollars(LowerTarget)
                    # else "Target = " + AsDollars(Round(lowerTarget, 2)), color.red);

def FE_Consolidation = gamma > .57 and gamma[1] < .57;
#AddLabel(FE_Consolidation, "          Fractal Energy Consolidation          ", Color.YELLOW);
def FE_Exhaustion = gamma < .38 and gamma[1] > .38;
#AddLabel(FE_Exhaustion, "          Fractal Energy Exhaustion          ", Color.YELLOW);


AddChartBubble(FE_Exhaustion, gamma,  "E", COLOR.WHITE);
AddchartBubble(FE_Consolidation, gamma, "C", color.white);
#Vertical Lines
def short = RSI crosses below .80;
def long = RSI crosses above .20;


RSI.DefineColor("Up", CreateColor( 0,  220, 0));
RSI.DefineColor("Down",  Color.MAGENTA);
RSI.SetLineWeight(4);
RSI.AssignValueColor(if RSI > RSI[1] and RSI[1] > RSI [2] then RSI.Color("Up") else if RSI < RSI[1] and RSI[1] < RSI [2] then RSI.Color("Down") else color.YELLOW);

#Gamma Line Color
gamma.DefineColor("Con", CreateColor( 153,  153, 153));
gamma.DefineColor("EX",  CreateColor( 153,  153, 153));
gamma.AssignValueColor(if gamma > .62 then gamma.Color("Con") else if gamma < .38 then gamma.Color("EX") else color.LIME);

AddCloud(gamma, .62, Color.GRAY, Color.Current);
AddCloud(gamma, .38, Color.Current, Color.GRAY);

#Show Breakout Signals
#Arrows#
plot UpSignal = if RSI crosses above gamma and gamma >0.38 and gamma <0.62 then 0.2 else Double.NaN;
plot DownSignal = if RSI crosses below gamma and gamma >0.38 and gamma <0.62 then 0.8 else Double.NaN;

UpSignal.SetHiding(!showBreakoutSignals);
DownSignal.SetHiding(!showBreakoutSignals);

UpSignal.SetDefaultColor(Color.White);
DownSignal.SetDefaultColor(Color.White);
UpSignal.SetDefaultColor(Color.UPTICK);
UpSignal.SetPaintingStrategy(PaintingStrategy.ARROW_UP);
DownSignal.SetDefaultColor(Color.DOWNTICK);
DownSignal.SetPaintingStrategy(PaintingStrategy.ARROW_DOWN);

# Polarity Script
input length = 10;
input smoothingLength = 5;

#FE polarity indicator
def diff = close - close[length - 1];
def val = 100 * Sqrt(Sqr(diff) + Sqr(length)) / sum(Sqrt(1 + Sqr(close - close[1])), length - 1);
def PFE = ExpAverage(if diff > 0 then val else -val, smoothingLength);
plot pfediv = ((pfe/100) + 1.2) * .4;
pfediv.SetHiding(!showpolarity);
pfediv.setStyle(Curve.MEDIUM_DASH);
pfediv.setLineWeight(5);
pfediv.setDefaultColor(Color.DARK_ORANGE);Add this to the bottom of your script:Is it possible to add an alert code each time the the chart bubble E fires exhaustion?
https://usethinkscript.com/threads/...djusting-with-fractal-energy-usage-notes.219/
Ruby:
Alert(FE_Exhaustion, "FE_Exhaustion", Alert.Bar, Sound.Bell);Freddie_CM
Member
@MerryDay, thanks for adding in the alerts. Is there any way to scan for the chart bubble "E" from the code @FuturesTrader2022 posted? TIA
shutdown24
New member
There is no "gamma color" associated with @markos study for RSI Laguerre w/ fractal energy.
I am going to hazard a guess at what coloring you are looking for.
This will give you a template that you can then revise, to meet the requirements of your strategy.
Logic is based on:
Add to the bottom of your lower chart script to paint candles in upper chart
I am going to hazard a guess at what coloring you are looking for.
This will give you a template that you can then revise, to meet the requirements of your strategy.
Logic is based on:
gamma settings:
Above .6 - Think price compression or squeeze
Below .3 - Think running out of gas
Add to the bottom of your lower chart script to paint candles in upper chart
Ruby:
input PaintCandles = yes ;
AssignPriceColor(
if !PaintCandles then color.current else
if gamma > .6 then color.plum else
if gamma<.3 then color.orange else color.current);
Last edited:
@markos do you mean, he doesnt use the FE(gamma) anymore ?It has been a while since I have posted the following: FE - Fractal Energy is not a signal.
It's only purpose is to tell you when the potential to buy or sell is best. Mobius, who wrote this, has his turned off. He trades /ES
I find the choppiness index quite sufficient - does the same thing.
Regarding RSI Laguerre. I've tried to delete the green OS and red OB ribbons from the lower study (posted by markos April 17, 2019) by simply removing the 8 lines of OS and OB code. Couldn’t get it to work … can anyone help?
1. Put a hashtag # in front of the statements that begin with AddCloud to easily remove colored 'ribbons'
2. To remove OS and OB line plots, simply unclick 'show plots' in chart settings
No, he and others just turn off the (Yellow) color in settings. Some people don't need to see it but it is involved in the calculations, iirc.@markos do you mean, he doesnt use the FE(gamma) anymore ?
I find the choppiness index quite sufficient - does the same thing.
RSI-Laguerre using an exponent of price (found in the thinkscript lounge archive)
15:40 Mobius: Frank... This is RSI-Laguerre using an exponent of price. It's several bars faster at the same lengths.
15:40 Mobius: And, It will still positive signals at lengths as low as 4.
15:41 Mobius: still make positive signals .......
15:42 Mobius: Nothing particulalry smooth about it though. That was just a by-product of TOS normalizing the MA line when you stuck it in RSIL and not a real picture of what it was doing
15:44 AlphaInvestor: Thanks Mobius - another toy for the toolbox
15:45 UpTheCreek: ^^^ ditto
Code:
# RSIL_ExponentOfPrice_V09_2022_10_20_Mobius
#
# RSI in Laguerre Time Self Adjusting With Fractal Energy
# Mobius
# V03.06.15.2016
# Both Fractal Energy and RSI are plotted. RSI in cyan and FE in yellow. Look for trend exhaustion in the FE and a reversal of RSI or Price compression in FE and an RSI reversal.
# V09.10.20.2022
# Altered iData to Exponent of price.
# Faster at the same length settings and able to produce absolute signals at lengths as short as 4.

declare lower;

#Inputs:
input nFE = 13;#hint nFE: length for Fractal Energy calculation.

# Variables:
def o;
def h;
def l;
def c;
def cl;
def CU1;
def CU2;
def CU;
def CD1;
def CD2;
def CD;
def L0;
def L1;
def L2;
def L3;
plot RSI;
plot OS;
plot OB;

# Calculations
O = open / (open[2] / open[1]);
H = high / (high[2] / high[1]);
L = low / (low[2] / low[1]);
Cl = close / (close[2] / close[1]);
c = (h+l+Cl)/3;

## GAMMA CALC & PLOT (comment by jq)
plot gamma = Log(Sum((Max(H, C[1]) - Min(L, C[1])), nFE) /
(Highest(H, nFE) - Lowest(L, nFE)))
/ Log(nFE);
gamma.SetDefaultColor(Color.Yellow);


L0 = (1 – gamma) * c + gamma * L0[1];
L1 = -gamma * L0 + L0[1] + gamma * L1[1];
L2 = -gamma * L1 + L1[1] + gamma * L2[1];
L3 = -gamma * L2 + L2[1] + gamma * L3[1];


## DEFINES CU1 & CD2 FOR CU2 & CD2 (comment by jq)
if L0 >= L1
then {
CU1 = L0 - L1;
CD1 = 0;
} else {
CD1 = L1 - L0;
CU1 = 0;
}

## DEFINES CU2 & CD2 FOR CU & CD (comment by jq)
if L1 >= L2
then {
CU2 = CU1 + L1 - L2;
CD2 = CD1;
} else {
CD2 = CD1 + L2 - L1;
CU2 = CU1;
}

## DEFINES CU & CD FOR S (comment by jq)
if L2 >= L3
then {
CU = CU2 + L2 - L3;
CD = CD2;
} else {
CU = CU2;
CD = CD2 + L3 - L2;
}

def s = CU / (CU + CD);

## RSI PLOT (comment by jq)
RSI = if CU + CD <> 0 then s else 0;
RSI.SetDefaultColor(Color.Cyan);

## RSI BANDS (comment by jq)
OS = if IsNaN(close) then Double.NaN else 0.2;
OS.SetDefaultColor(Color.Gray);
OS.HideBubble();
OS.HideTitle();
OB = if IsNaN(close) then Double.NaN else 0.8;
OB.SetDefaultColor(Color.Gray);
OB.HideBubble();
OB.HideTitle();

## FRACTAL ENERGY BANDS (comment by jq)
plot FEh = if isNaN(close) then double.nan else .618;
FEh.SetStyle(Curve.Long_Dash);
FEh.HideBubble();
FEh.SetDefaultColor(Color.Dark_Gray);
FEh.HideTitle();
plot FEl = if isNaN(close) then double.nan else .382;
FEl.SetStyle(Curve.Long_Dash);
FEl.SetDefaultColor(Color.Dark_Gray);
FEl.HideBubble();
FEl.HideTitle();

## CLOUDS (comment by jq)
AddCloud(0, OS, Color.Green, Color.Green);
AddCloud(OB, 1, Color.Red, Color.Red);

## ALERTS ( comment by jq)
Alert(RSI crosses below .9, "", Alert.BAR, Sound.Bell);
Alert(RSI crosses above .1, "", Alert.BAR, Sound.Bell);

# End Code RSI_Laguerre Self Adjusting with Fractal Energy
Last edited:
Join useThinkScript to post your question to a community of 21,000+ developers and traders.
| Thread starter | Similar threads | Forum | Replies | Date |
|---|---|---|---|---|
| D | RSI Laguerre Indicator without Fractal Energy, Red/Green | Indicators | 30 | |
| T | Repaints RSI in Laguerre Time MTF for ThinkorSwim | Indicators | 70 | |
|
|
SuperTrend and RSI Laguerre Indicator for ThinkorSwim | Indicators | 35 | |
|
|
Ultimate RSI [LuxAlgo] for ThinkOrSwim | Indicators | 20 | |
|
|
RSI Levels For ThinkOrSwim | Indicators | 13 |
Similar threads
Not the exact question you're looking for?
Start a new thread and receive assistance from our community.
87k+
Posts
1995
Online
Similar threads
Similar threads
The Market Trading Game Changer
Join 2,500+ subscribers inside the useThinkScript VIP Membership Club
- Exclusive indicators
- Proven strategies & setups
- Private Discord community
- ‘Buy The Dip’ signal alerts
- Exclusive members-only content
- Add-ons and resources
- 1 full year of unlimited support
Frequently Asked Questions
What is useThinkScript?
useThinkScript is the #1 community of stock market investors using indicators and other tools to power their trading strategies. Traders of all skill levels use our forums to learn about scripting and indicators, help each other, and discover new ways to gain an edge in the markets.
How do I get started?
We get it. Our forum can be intimidating, if not overwhelming. With thousands of topics, tens of thousands of posts, our community has created an incredibly deep knowledge base for stock traders. No one can ever exhaust every resource provided on our site.
If you are new, or just looking for guidance, here are some helpful links to get you started.
- The most viewed thread:
https://usethinkscript.com/threads/repainting-trend-reversal-for-thinkorswim.183/ - Our most popular indicator:
https://usethinkscript.com/threads/buy-the-dip-indicator-for-thinkorswim.3553/ - Answers to frequently asked questions:
https://usethinkscript.com/threads/answers-to-commonly-asked-questions.6006/
What are the benefits of VIP Membership?
VIP members get exclusive access to these proven and tested premium indicators: Buy the Dip, Advanced Market Moves 2.0, Take Profit, and Volatility Trading Range. In addition, VIP members get access to over 50 VIP-only custom indicators, add-ons, and strategies, private VIP-only forums, private Discord channel to discuss trades and strategies in real-time, customer support, trade alerts, and much more. Learn all about VIP membership here.
How can I access the premium indicators?
To access the premium indicators, which are plug and play ready, sign up for VIP membership here.