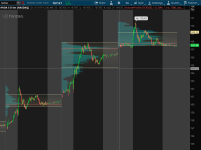
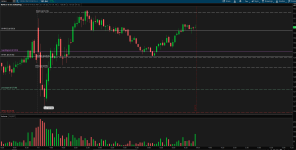
This is the one I'm using.

Code:
# Profile TPO & Volume
input profileType = {default Time, Volume};
input pricePerRowHeightMode = {default Ticksize, Automatic, Custom};
input customRowHeight = 1.0;
input timePerProfile = {default Day, Week, Month, Year, Hour, Chart, "Opt Exp"};
input multiplier = 1;
input OnExpansionProfile = No;
input OnExpansionValueArea = No;
input profiles = 2;
input showPointOfControl = Yes;
input showValueArea = Yes;
input showValueAreaCloud = Yes;
input ValueAreaPercent = 70;
input ShowHighLow = Yes;
input opacity = 5;
input PaintBars = No;
input ShowExtensions = No;
input DynamicHideExtensions = Yes;
input ShowLabel = No;
def FibExt1 = 1.618;
def FibExt2 = 2.618;
def FibExt3 = 4.236;
def SE = ShowExtensions;
def ShowProfileValueAreaCloud = no;

def period;
def yyyymmdd = GetYYYYMMDD();
def seconds = SecondsFromTime(0);
def month = GetYear() * 12 + GetMonth();
def year = GetYear();
def day_number = DaysFromDate(First(yyyymmdd)) + GetDayOfWeek(First(yyyymmdd));
def dom = GetDayOfMonth(yyyymmdd);
def dow = GetDayOfWeek(yyyymmdd - dom + 1);
def expthismonth = (if dow > 5 then 27 else 20) - dow;
def exp_opt = month + (dom > expthismonth);
switch (timePerProfile) {
case Chart:
    period = 0;
case Hour:
    period = Floor(seconds / 3600 + day_number * 24);
case Day:
    period = CountTradingDays(Min(First(yyyymmdd), yyyymmdd), yyyymmdd) - 1;
case Week:
    period = Floor(day_number / 7);
case Month:
    period = Floor(month - First(month));
case Year:
    period = Floor(year - First(year));
case "Opt Exp":
    period = exp_opt - First(exp_opt);
}

def CloseByPeriod = close(Period = timePerProfile)[-1];
def Openbyperiod  = open(Period = timePerProfile)[-1];
def NewDay = if !IsNaN(CloseByPeriod) then 0 else 1;

rec Count = if period != period[1] then (Count[1] + period - period[1]) % 1 else Count[1];
def Cond = Count < Count[1] + period - period[1];
def height;
switch (pricePerRowHeightMode) {
case Automatic:
    height = PricePerRow.AUTOMATIC;
case Ticksize:
    height = PricePerRow.TICKSIZE;
case Custom:
    height = customRowHeight;
}

profile VOL = if profileType == profileType.Volume then VolumeProfile("startNewProfile" = Cond, "onExpansion" = onExpansionProfile, "NumberOfProfiles" = profiles, "PricePerRow" = height, "Value Area Percent" = ValueAreaPercent) else TimeProfile("startNewProfile" = Cond, "OnExpansion" = onExpansionProfile, "NumberOfProfiles" = profiles, "PricePerRow" = height, "Value Area Percent" = ValueAreaPercent);

def con = CompoundValue(1, onExpansionProfile, no);
rec pc = if IsNaN(VOL.GetPointOfControl()) and con then pc[1] else VOL.GetPointOfControl();
rec hVA = if IsNaN(VOL.GetHighestValueArea()) and con then hVA[1] else VOL.GetHighestValueArea();
rec lVA = if IsNaN(VOL.GetLowestValueArea()) and con then lVA[1] else VOL.GetLowestValueArea();
rec HVA_Last = if period == period[1] then HVA_Last[1] else hVA[1];
rec PC_Last  = if period == period[1] then PC_Last[1]  else pc[1];
rec LVA_Last = if period == period[1] then LVA_Last[1] else lVA[1];
rec hProfile = if IsNaN(VOL.GetHighest()) and con then hProfile[1] else VOL.GetHighest();
rec lProfile = if IsNaN(VOL.GetLowest()) and con then lProfile[1] else VOL.GetLowest();
def plotsDomain = IsNaN(close) == onExpansionProfile;

rec hP_Last = if period == period[1] then hP_Last[1] else hProfile[1];
rec lP_Last = if period == period[1] then lP_Last[1] else lProfile[1];

plot VAH  = if !showValueArea then Double.NaN else if IsNaN(close[0]) then HVA_Last[0] else if !OnExpansionValueArea then HVA_Last[0] else Double.NaN;
plot POC  = if IsNaN(close[0]) then PC_Last[0] else if !OnExpansionValueArea then PC_Last[0] else Double.NaN;
plot VAL  = if !showValueArea then Double.NaN else if IsNaN(close[0]) then LVA_Last[0] else if !OnExpansionValueArea then LVA_Last[0] else Double.NaN;
plot High = if !ShowHighLow then Double.NaN else if IsNaN(close[0]) then hP_Last[0] else if !OnExpansionValueArea then hP_Last[0] else Double.NaN;
plot Low = if !ShowHighLow then Double.NaN else if IsNaN(close[0]) then lP_Last[0] else if !OnExpansionValueArea then lP_Last[0] else Double.NaN;

DefineGlobalColor("Profile", GetColor(7));
DefineGlobalColor("Point Of Control", GetColor(5));
DefineGlobalColor("Value Area", GetColor(8));

VOL.Show(GlobalColor("Profile"), if showPointOfControl then GlobalColor("Point Of Control") else Color.CURRENT, if ShowProfileValueAreaCloud then GlobalColor("Value Area") else Color.CURRENT, opacity);

POC.SetPaintingStrategy(PaintingStrategy.HORIZONTAL);
POC.SetDefaultColor(Color.DARK_GRAY);
#POC.SetDefaultColor(CreateColor(32,49,57));
POC.SetLineWeight(1);
POC.HideTitle();

VAH.SetPaintingStrategy(PaintingStrategy.HORIZONTAL);
VAH.SetDefaultColor(Color.DARK_GREEN);
VAH.SetLineWeight(1);
VAH.HideBubble();
VAH.HideTitle();

VAL.SetPaintingStrategy(PaintingStrategy.HORIZONTAL);
VAL.SetDefaultColor(Color.DARK_RED);
VAL.SetLineWeight(1);
VAL.HideBubble();
VAL.HideTitle();

High.SetPaintingStrategy(PaintingStrategy.DASHES);
High.SetDefaultColor(CreateColor(38, 38, 8));
High.SetLineWeight(1);
High.HideBubble();
High.HideTitle();

Low.SetPaintingStrategy(PaintingStrategy.DASHES);
Low.SetDefaultColor(CreateColor(38, 38, 8));
Low.SetLineWeight(1);
Low.HideBubble();
Low.HideTitle();
#Paint Bars

#AssignPriceColor(if !PaintBars then Color.CURRENT else if open >= VAH and close >= VAH then CreateColor(0, 204, 0) else if open <= VAL and close <= VAL then CreateColor(204, 0, 0) else Color.Light_GRAY);
AssignPriceColor(if !PaintBars then Color.CURRENT else if open >= VAH and close >= VAH then Color.Green else if open <= VAL and close <= VAL then Color.Red else Color.Light_GRAY);
#Value Area Cloud

#DefineGlobalColor("Value Area Cloud", (CreateColor(20, 20, 20)));
DefineGlobalColor("Value Area Cloud", Color.DARK_GRAY);
def cloudhigh = if showValueAreaCloud and IsNaN(close[0]) then HVA_Last else if !OnExpansionValueArea then HVA_Last else Double.NaN;
def cloudlow  = if showValueAreaCloud and IsNaN(close[0]) then LVA_Last else if !OnExpansionValueArea then LVA_Last else Double.NaN;
AddCloud (cloudhigh, cloudlow, GlobalColor("Value Area Cloud"));
#Chart Label

def InsideValueArea = close < HVA_Last and close > LVA_Last;
def BelowValue = close < LVA_Last;

AddLabel(ShowLabel, close, if InsideValueArea then Color.GRAY else if BelowValue then Color.RED else Color.GREEN);
#Fibonacci Extensions

def VAWidth = VAH - VAL;

plot E1H = if SE < 1 then Double.NaN else VAH + VAWidth * (FibExt1 - 1);
E1H.SetHiding(DynamicHideExtensions and close < VAH);
E1H.SetDefaultColor(CreateColor(0, 51, 0));
E1H.SetPaintingStrategy(PaintingStrategy.DASHES);
E1H.SetLineWeight(1);
E1H.HideBubble();
E1H.HideTitle();
plot E1L = if SE < 1 then Double.NaN else VAL - VAWidth * (FibExt1 - 1);
E1L.SetHiding(DynamicHideExtensions and close > VAL);
E1L.SetDefaultColor(CreateColor(51, 0, 0));
E1L.SetPaintingStrategy(PaintingStrategy.DASHES);
E1L.SetLineWeight(1);
E1L.HideBubble();
E1L.HideTitle();

plot E2H = if SE < 1 then Double.NaN else VAH + VAWidth * (FibExt2 - 1);
E2H.SetHiding(DynamicHideExtensions and close < E1H);
E2H.SetDefaultColor(CreateColor(0, 51, 0));
E2H.SetPaintingStrategy(PaintingStrategy.DASHES);
E2H.SetLineWeight(1);
E2H.HideBubble();
E2H.HideTitle();
plot E2L = if SE < 1 then Double.NaN else VAL - VAWidth * (FibExt2 - 1);
E2L.SetHiding(DynamicHideExtensions and close > E1L);
E2L.SetDefaultColor(CreateColor(51, 0, 0));
E2L.SetPaintingStrategy(PaintingStrategy.DASHES);
E2L.SetLineWeight(1);
E2L.HideBubble();
E2L.HideTitle();

plot E3H = if SE < 1 then Double.NaN else VAH + VAWidth * (FibExt3 - 1);
E3H.SetHiding(DynamicHideExtensions and close < E2H);
E3H.SetDefaultColor(CreateColor(0, 51, 0));
E3H.SetPaintingStrategy(PaintingStrategy.DASHES);
E3H.SetLineWeight(1);
E3H.HideBubble();
E3H.HideTitle();
plot E3L = if SE < 1 then Double.NaN else VAL - VAWidth * (FibExt3 - 1);
E3L.SetHiding(DynamicHideExtensions and close > E2L);
E3L.SetDefaultColor(CreateColor(51, 0, 0));
E3L.SetPaintingStrategy(PaintingStrategy.DASHES);
E3L.SetLineWeight(1);
E3L.HideBubble();
E3L.HideTitle();
Last edited by a moderator:


