Previous Day High/Low/Close For ThinkOrSwim

Hi, I'm using the code that Welkin kindly published within this chain for a study in ThinkorSwim. I love having this information readily available, however, I would benefit for a small tweak that I hoped someone could help me with. In addition to displaying chart bubbles, I'd like to display the same information as labels on the top of my chart. Fields shown below. Thanks in advance for your help! cheers

  • CurrOpen $
  • PrevClose $
  • PrevLow $
  • PrevHigh $

CODE

#[email protected]
def NA = Double.NaN;

input agg = AggregationPeriod.DAY;
input showOnlyLastPeriod = no;
input showBubbles = yes;
input showValuesInBubbles = yes;
input spaceBetween = 1;
plot currentOpen;
plot prevDayClose;
plot prevDayLow;
plot prevDayHigh;
def exp = IsNaN(close[spaceBetween]);

currentOpen = if exp then open("period"=agg) else NA;
prevDayClose = if exp then close("period"=agg)[1] else NA;
prevDayLow = if exp then low("period"=agg)[1] else NA;
prevDayHigh = if exp then high("period"=agg)[1] else NA;

AddChartBubble(showBubbles, if IsNaN(currentOpen[1]) and !IsNaN(currentOpen) then currentOpen else NA, if showValuesInBubbles then "CurrOpen $"+currentOpen else "CurrOpen", Color.WHITE, yes);
AddChartBubble(showBubbles, if IsNaN(prevDayClose[1]) and !IsNaN(prevDayClose) then prevDayClose else NA, if showValuesInBubbles then "PrevClose $"+prevDayClose else "PrevClose", Color.YELLOW, yes);
AddChartBubble(showBubbles, if IsNaN(prevDayLow[1]) and !IsNaN(prevDayLow) then prevDayLow else NA, if showValuesInBubbles then "PrevLow $"+prevDayLow else "PrevLow", Color.RED, yes);
AddChartBubble(showBubbles, if IsNaN(prevDayHigh[1]) and !IsNaN(prevDayHigh) then prevDayHigh else NA, if showValuesInBubbles then "PrevHigh $"+prevDayHigh else "PrevHigh", Color.GREEN, yes);

currentOpen.SetDefaultColor(Color.WHITE);
prevDayLow.SetDefaultColor(Color.RED);
prevDayHigh.SetDefaultColor(Color.GREEN);
prevDayClose.SetDefaultColor(Color.YELLOW);
currentOpen.SetPaintingStrategy(PaintingStrategy.HORIZONTAL);
prevDayLow.SetPaintingStrategy(PaintingStrategy.HORIZONTAL);
prevDayHigh.SetPaintingStrategy(PaintingStrategy.HORIZONTAL);
prevDayClose.SetPaintingStrategy(PaintingStrategy.HORIZONTAL);
 
This is exactly what I need but when I copy/paste into a custom study it doesn't appear. I'm not the best at this so it's probably user error. Would anyone mind sharing the link instead?
 
I like to find ways to remove clutter from the charts so I came up with this. Figured others might find it appealing as well. Plots previous day's high, low and close, as well as the current days open on expansion. these values are taken from the daily aggregation.

l7aR37M.png


Code:
#[email protected]
def NA = Double.NaN;

input agg = AggregationPeriod.DAY;
input showOnlyLastPeriod = no;
input showBubbles = yes;
input showValuesInBubbles = yes;
input spaceBetween = 1;
plot currentOpen;
plot prevDayClose;
plot prevDayLow;
plot prevDayHigh;
def exp = IsNaN(close[spaceBetween]);

currentOpen = if exp then open("period"=agg) else NA;
prevDayClose = if exp then close("period"=agg)[1] else NA;
prevDayLow = if exp then low("period"=agg)[1] else NA;
prevDayHigh = if exp then high("period"=agg)[1] else NA;

AddChartBubble(showBubbles, if IsNaN(currentOpen[1]) and !IsNaN(currentOpen) then currentOpen else NA, if showValuesInBubbles then "CurrOpen $"+currentOpen else "CurrOpen", Color.WHITE, yes);
AddChartBubble(showBubbles, if IsNaN(prevDayClose[1]) and !IsNaN(prevDayClose) then prevDayClose else NA, if showValuesInBubbles then "PrevClose $"+prevDayClose else "PrevClose", Color.YELLOW, yes);
AddChartBubble(showBubbles, if IsNaN(prevDayLow[1]) and !IsNaN(prevDayLow) then prevDayLow else NA, if showValuesInBubbles then "PrevLow $"+prevDayLow else "PrevLow", Color.RED, yes);
AddChartBubble(showBubbles, if IsNaN(prevDayHigh[1]) and !IsNaN(prevDayHigh) then prevDayHigh else NA, if showValuesInBubbles then "PrevHigh $"+prevDayHigh else "PrevHigh", Color.GREEN, yes);

currentOpen.SetDefaultColor(Color.WHITE);
prevDayLow.SetDefaultColor(Color.RED);
prevDayHigh.SetDefaultColor(Color.GREEN);
prevDayClose.SetDefaultColor(Color.YELLOW);
currentOpen.SetPaintingStrategy(PaintingStrategy.HORIZONTAL);
prevDayLow.SetPaintingStrategy(PaintingStrategy.HORIZONTAL);
prevDayHigh.SetPaintingStrategy(PaintingStrategy.HORIZONTAL);
prevDayClose.SetPaintingStrategy(PaintingStrategy.HORIZONTAL);
Hi. I use this code and its great.. Is there a way that the lines would extend across the whole chart instead of just on the right side? Appreciate any insight on how to change the code to accomplish this..
 
Hi. I use this code and its great.. Is there a way that the lines would extend across the whole chart instead of just on the right side? Appreciate any insight on how to change the code to accomplish this..

This gives you an option to extend the line plots across the whole chart or just in expansion as the original. Added a bubblemover input to handle both plot methods.

Screenshot-2022-12-19-134233.png

Code:
#Previous Day High/Low/Close For ThinkOrSwim
#[email protected]
#Extended Lines across chart
#Added Today's RTH open


input extend_lines_across_chart = yes;
input agg = AggregationPeriod.DAY;
input showOnlyLastPeriod = no;
input showBubbles = yes;
input showValuesInBubbles = yes;
plot currentrthOpen;
plot currentOpen;
plot prevDayClose;
plot prevDayLow;
plot prevDayHigh;
def NA = Double.NaN;
def bn = BarNumber();
def exp = IsNaN(close);

def rthopen      = if (getday() == getlastday() or exp) and secondsfromTime(0930) == 0
                   then open
                   else rthopen[1];
currentrthOpen   = if extend_lines_across_chart == yes   
                   then HighestAll(rthopen)
                   else if exp
                   then rthopen
                   else NA;

def hopen    = if getday() == getlastday() or exp
               then open("period" = agg)
               else hopen[1];
currentOpen  = if extend_lines_across_chart == yes   
               then HighestAll(hopen)
               else if exp
               then hopen
               else NA;
def hpdclose = if GetDay() ==  GetLastDay() or exp
               then close("period" = agg)[1]
               else hpdclose[1];
prevDayClose = if extend_lines_across_chart == yes   
               then HighestAll(hpdclose)
               else if exp
               then hpdclose
               else NA;
def hpdlow   = if GetDay() ==  GetLastDay() or exp
               then low("period" = agg)[1]
               else hpdlow[1];
prevDayLow   = if extend_lines_across_chart == yes   
               then HighestAll(hpdlow)
               else if exp
               then hpdlow
               else NA;
def hpdhigh  = if GetDay() ==  GetLastDay() or exp
               then high("period" = agg)[1]
               else hpdhigh[1];
prevDayHigh  = if extend_lines_across_chart == yes   
               then HighestAll(hpdhigh)
               else if exp
               then hpdhigh
               else NA;
input bubblemover = 1;
def b  = bubblemover;
def b1 = b + 1;
AddChartBubble(IsNaN(close[b]) and !IsNaN(close[b1]) , currentrthOpen[b], if showValuesInBubbles then "RTHOpen $" + currentrthOpen[b] else "RTHOpen", Color.Cyan, yes);
AddChartBubble(IsNaN(close[b]) and !IsNaN(close[b1]) , currentOpen[b], if showValuesInBubbles then "CurrOpen $" + currentOpen[b] else "CurrOpen", Color.WHITE, yes);
AddChartBubble(IsNaN(close[b]) and !IsNaN(close[b1]) , prevDayClose[b], if showValuesInBubbles then "PrevClose $" + prevDayClose[b] else "PrevClose", Color.YELLOW, yes);
AddChartBubble(IsNaN(close[b]) and !IsNaN(close[b1]) , prevDayLow[b], if showValuesInBubbles then "PrevLow $" + prevDayLow[b] else "PrevLow", Color.RED, yes);
AddChartBubble(IsNaN(close[b]) and !IsNaN(close[b1]) , prevDayHigh[b], if showValuesInBubbles then "PrevHigh $" + prevDayHigh else "PrevHigh", Color.GREEN, yes);

currentrthOpen.SetDefaultColor(Color.cyan);
currentOpen.SetDefaultColor(Color.WHITE);
prevDayLow.SetDefaultColor(Color.RED);
prevDayHigh.SetDefaultColor(Color.GREEN);
prevDayClose.SetDefaultColor(Color.YELLOW);
currentOpen.SetPaintingStrategy(PaintingStrategy.HORIZONTAL);
prevDayLow.SetPaintingStrategy(PaintingStrategy.HORIZONTAL);
prevDayHigh.SetPaintingStrategy(PaintingStrategy.HORIZONTAL);
prevDayClose.SetPaintingStrategy(PaintingStrategy.HORIZONTAL);

#
 
Last edited:
This gives you an option to extend the line plots across the whole chart or just in expansion as the original. Added a bubblemover input to handle both plot methods.

THANKS SLEEPYZ!!

I have this one for Previous Week, High Low close, was hoping to add the option to extend on this one as well.

See below, if you could help me with the modification:

def NA = Double.NaN;

input agg = AggregationPeriod.Week;
input showOnlyLastPeriod = no;
input showBubbles = yes;
input showValuesInBubbles = yes;
input spaceBetween = 1;

plot prevWeekClose;
plot prevWeekLow;
plot prevWeekHigh;
def exp = IsNaN(close[spaceBetween]);


prevWeekClose = if exp then close("period"=agg)[1] else NA;
prevWeekLow = if exp then low("period"=agg)[1] else NA;
prevWeekHigh = if exp then high("period"=agg)[1] else NA;


AddChartBubble(showBubbles, if IsNaN(prevWeekClose[1]) and !IsNaN(prevWeekClose) then prevWeekClose else NA, if showValuesInBubbles then "PrevWeekClose $"+prevWeekClose else "PrevWeekClose", Color.Gray, yes);
AddChartBubble(showBubbles, if IsNaN(prevWeekLow[1]) and !IsNaN(prevWeekLow) then prevWeekLow else NA, if showValuesInBubbles then "PrevWeekLow $"+prevWeekLow else "PrevWeekLow", Color.RED, yes);
AddChartBubble(showBubbles, if IsNaN(prevWeekHigh[1]) and !IsNaN(prevWeekHigh) then prevWeekHigh else NA, if showValuesInBubbles then "PrevWeekHigh $"+prevWeekHigh else "PrevWeekHigh", Color.GREEN, yes);


prevWeekLow.SetDefaultColor(Color.RED);
prevWeekHigh.SetDefaultColor(Color.GREEN);
prevWeekClose.SetDefaultColor(Color.Gray);

prevWeekLow.SetPaintingStrategy(PaintingStrategy.HORIZONTAL);
prevWeekHigh.SetPaintingStrategy(PaintingStrategy.HORIZONTAL);
prevWeekClose.SetPaintingStrategy(PaintingStrategy.HORIZONTAL);

Here is week. If you want other aggregations, eg: Month/Quarter/Year, just make a copy of this and change agg to one of those and corresponding bubble label wording in bubbles is about all that would be necessary. You would not even need to change the def and corresponding plot names.

Ruby:
#Previous Week High/Low/Close For ThinkOrSwim
#[email protected]


input extend_lines_across_chart = yes;
input agg = AggregationPeriod.week;
input showOnlyLastPeriod = no;
input showBubbles = yes;
input showValuesInBubbles = yes;

plot prevWeekClose;
plot prevWeekLow;
plot prevWeekHigh;
def NA = Double.NaN;
def bn = BarNumber();
def exp = IsNaN(close);


def hpwclose = if GetDay() ==  GetLastDay()
               then close("period" = agg)[1]
               else hpwclose[1];
prevWeekClose = if extend_lines_across_chart == yes   
                then HighestAll(hpwclose)
                else if exp
                then hpwclose
                else NA;
def hpwlow   = if GetDay() ==  GetLastDay()
                then low("period" = agg)[1]
                else hpwlow[1];
prevWeekLow   = if extend_lines_across_chart == yes   
                then HighestAll(hpwlow)
                else if exp
                then hpwlow
                else NA;
def hpwhigh  = if GetDay() ==  GetLastDay()
               then high("period" = agg)[1]
                else hpwhigh[1];
prevWeekHigh  = if extend_lines_across_chart == yes   
               then HighestAll(hpwhigh)
               else if exp
               then hpwhigh
               else NA;
input bubblemover = 1;
def b  = bubblemover;
def b1 = b + 1;

AddChartBubble(IsNaN(close[b]) and !IsNaN(close[b1]) , prevWeekClose[b], if showValuesInBubbles then "PrevWeekClose $"+prevWeekClose else "PrevWeekClose", Color.Gray, yes);
AddChartBubble(IsNaN(close[b]) and !IsNaN(close[b1]) , prevWeekLow[b],  if showValuesInBubbles then "PrevWeekLow $"+prevWeekLow else "PrevWeekLow", Color.RED, yes);
AddChartBubble(IsNaN(close[b]) and !IsNaN(close[b1]) , prevWeekHigh[b], if showValuesInBubbles then "PrevWeekHigh $"+prevWeekHigh else "PrevWeekHigh", Color.GREEN, yes);

prevWeekLow.SetDefaultColor(Color.RED);
prevWeekHigh.SetDefaultColor(Color.GREEN);
prevWeekClose.SetDefaultColor(Color.Gray);

prevWeekLow.SetPaintingStrategy(PaintingStrategy.HORIZONTAL);
prevWeekHigh.SetPaintingStrategy(PaintingStrategy.HORIZONTAL);
prevWeekClose.SetPaintingStrategy(PaintingStrategy.HORIZONTAL);
 
Here is week. If you want other aggregations, eg: Month/Quarter/Year, just make a copy of this and change agg to one of those and corresponding bubble label wording in bubbles is about all that would be necessary. You would not even need to change the def and corresponding plot names.
HI SleepyZ, For some reason today this is not showing the levels.. can you check it? Ive tried to delete it, and put it back in.. but to no avail. Its showing "0" for all levels..
 
Last edited:
HI SleepyZ, For some reason today this is not showing the levels.. can you check it? Ive tried to delete it, and put it back in.. but to no avail. Its showing "0" for all levels..

Sorry, it only worked on Day charts.

Here is the revision that should work primarily for DAY, WEEK, MONTH, and YEAR aggregations set at input agg. So you can use this one script for all of those. Just add multipe versions and change the input agg to your choice. I have replaced this study in post #149

A label will display the aggregation period chosen.

The image shows the same script on 2 charts. One is a DAY version and the other WEEK version.

Screenshot-2022-12-20-112240.png
Ruby:
#Previous Day High/Low/Close For ThinkOrSwim
#[email protected]

input extend_lines_across_chart = yes;
input agg = AggregationPeriod.DAY;#hint agg: Meant to be "DAY" or higher
input showlabel = yes;
AddLabel(showlabel,
if agg == AggregationPeriod.DAY
then "DAY"
else if agg == AggregationPeriod.WEEK
then "WEEK"
else if agg == AggregationPeriod.MONTH
then "MONTH"
else "YEAR", Color.YELLOW);
input showOnlyLastPeriod = no;
input showBubbles = yes;
input showValuesInBubbles = yes;
#input spaceBetween = 0;
plot currentOpen;
plot prevDayClose;
plot prevDayLow;
plot prevDayHigh;
def exp = IsNaN(close[0]);
def NA = Double.NaN;


currentOpen  = if extend_lines_across_chart
               then HighestAll( if exp then open("period" = agg) else NA)
               else if exp then open("period" = agg)
               else NA;
prevDayClose = if extend_lines_across_chart
               then HighestAll(if exp then close("period" = agg)[1] else NA)
               else if exp then close("period" = agg)[1]
               else NA;
prevDayLow   = if extend_lines_across_chart
               then HighestAll(if exp then low("period" = agg)[1] else NA)
               else if exp then low("period" = agg)[1]
               else NA;
prevDayHigh  = if extend_lines_across_chart
               then HighestAll(if exp then high("period" = agg)[1] else NA)
               else if exp then high("period" = agg)[1]
               else NA;

input bubblemover = 1;
def b = bubblemover;
def b1 = b + 1;
AddChartBubble(showBubbles and IsNaN(close[b]) and !IsNaN(close[b1]),
#if IsNaN(currentOpen[1]) and !IsNaN(currentOpen) then currentOpen else NA,
currentOpen[b],
if showValuesInBubbles then "CurrOpen $" + currentOpen else "CurrOpen", Color.WHITE, yes);
AddChartBubble(showBubbles and IsNaN(close[b]) and !IsNaN(close[b1]),
#if IsNaN(prevDayClose[1]) and !IsNaN(prevDayClose) then prevDayClose else NA,
prevDayClose[b],
if showValuesInBubbles then "PrevClose $" + prevDayClose else "PrevClose", Color.YELLOW, yes);
AddChartBubble(showBubbles and IsNaN(close[b]) and !IsNaN(close[b1]),
# if IsNaN(prevDayLow[1]) and !IsNaN(prevDayLow) then prevDayLow else NA,
prevDayLow[b],
if showValuesInBubbles then "PrevLow $" + prevDayLow else "PrevLow", Color.RED, yes);
AddChartBubble(showBubbles and IsNaN(close[b]) and !IsNaN(close[b1]),
#if IsNaN(prevDayHigh[1]) and !IsNaN(prevDayHigh) then prevDayHigh else NA,
prevDayHigh[b],
if showValuesInBubbles then "PrevHigh $" + prevDayHigh else "PrevHigh", Color.GREEN, yes);

currentOpen.SetDefaultColor(Color.WHITE);
prevDayLow.SetDefaultColor(Color.RED);
prevDayHigh.SetDefaultColor(Color.GREEN);
prevDayClose.SetDefaultColor(Color.YELLOW);
currentOpen.SetPaintingStrategy(PaintingStrategy.HORIZONTAL);
prevDayLow.SetPaintingStrategy(PaintingStrategy.HORIZONTAL);
prevDayHigh.SetPaintingStrategy(PaintingStrategy.HORIZONTAL);
prevDayClose.SetPaintingStrategy(PaintingStrategy.HORIZONTAL);
 
Sorry, it only worked on Day charts.

Here is the revision that should work primarily for DAY, WEEK, MONTH, and YEAR aggregations set at input agg. So you can use this one script for all of those. Just add multipe versions and change the input agg to your choice. I have replaced this study in post #149

A label will display the aggregation period chosen.

The image shows the same script on 2 charts. One is a DAY version and the other WEEK version.
ok, So I just had to change the label names to say Prev Week , but works great.
 
Sorry, it only worked on Day charts.

Here is the revision that should work primarily for DAY, WEEK, MONTH, and YEAR aggregations set at input agg. So you can use this one script for all of those. Just add multipe versions and change the input agg to your choice. I have replaced this study in post #149

A label will display the aggregation period chosen.

The image shows the same script on 2 charts. One is a DAY version and the other WEEK version.
Hi Ruby, thank you so much for your contribution. I am relatively new to UseThinkScript and I would like to learn enough to contribute.

Is it possible to show the daily, weekly and monthly lines on the same chart. I created three separate studies from your study above (D,W,M) and it seems to work but I would like to show the labels color on upper left as GREEN if (D,W,M)close > (D,W,M)previous close, RED (D,W,M)close > (D,W,M)previous close, else YELLOW.

I added the following but the colors do not change. Perhaps because I need to convert this to MTF?

AddLabel(showlabel, if agg == AggregationPeriod.DAY then "DAY"
else if agg == AggregationPeriod.WEEK then "WEEK"
else if agg == AggregationPeriod.MONTH then "MONTH"
#else "YEAR",
if close > previous close then Color.GREEN
else if close < previous close then Color.RED
else Color.YELLOW)

Thanks again for your contribution, greatly appreciated!!!
Here is a link to the image shown below.

https://tos.mx/YT96DH3

It contains 3 copies of code to display the Day, Week and Month data.
The labels have been revised to colors based on your request.
The bubbles have been revised to show the Day, Week or Month for each.
The red circled area shows the order of the studies to properly stack and display the labels on your chart.
Make sure you have enough days displayed on your chart to ensure accurate plots.


Here is the separate code to display your label request.

Ruby:
def DC  = close(period = AggregationPeriod.DAY);
def WC  = close(period = AggregationPeriod.WEEK);
def MC  = close(period = AggregationPeriod.MONTH);
def DC1 = close(period = AggregationPeriod.DAY)[1];
def WC1 = close(period = AggregationPeriod.WEEK)[1];
def MC1 = close(period = AggregationPeriod.MONTH)[1];
def ALL = (DC1 > DC) + (WC1 > WC) + (MC1 > MC);

input show_each     = yes;
input show_combined = yes;

AddLabel(show_each, "D " + DC1 + " " + DC , if DC1 > DC then Color.GREEN else Color.RED);
AddLabel(show_each, "W " + WC1 + " " + WC , if WC1 > WC then Color.GREEN else Color.RED);
AddLabel(show_each, "M " + MC1 + " " + MC , if MC1 > MC then Color.GREEN else Color.RED);

AddLabel(show_combined, "ALL ", if ALL == 3 then Color.GREEN else if ALL == 0 then Color.RED else Color.YELLOW);

The code in post #151 has also been revised to assist in your request.

Ruby:
#Previous Day High/Low/Close For ThinkOrSwim
#[email protected]

input extend_lines_across_chart = yes;
input agg = AggregationPeriod.DAY;#hint agg: Meant to be "DAY" or higher
input showlabel = yes;
input showOnlyLastPeriod = no;
input showBubbles = yes;
input showValuesInBubbles = yes;
#input spaceBetween = 0;
plot currentOpen;
plot prevDayClose;
plot prevDayLow;
plot prevDayHigh;
def exp = IsNaN(close[0]);
def NA = Double.NaN;


currentOpen  = if extend_lines_across_chart
               then HighestAll( if exp then open("period" = agg) else NA)
               else if exp then open("period" = agg)
               else NA;
prevDayClose = if extend_lines_across_chart
               then HighestAll(if exp then close("period" = agg)[1] else NA)
               else if exp then close("period" = agg)[1]
               else NA;
prevDayLow   = if extend_lines_across_chart
               then HighestAll(if exp then low("period" = agg)[1] else NA)
               else if exp then low("period" = agg)[1]
               else NA;
prevDayHigh  = if extend_lines_across_chart
               then HighestAll(if exp then high("period" = agg)[1] else NA)
               else if exp then high("period" = agg)[1]
               else NA;

input bubblemover = 1;
def b = bubblemover;
def b1 = b + 1;
AddChartBubble(showBubbles and IsNaN(close[b]) and !IsNaN(close[b1]),
#if IsNaN(currentOpen[1]) and !IsNaN(currentOpen) then currentOpen else NA,
currentOpen[b],
(if agg == AggregationPeriod.DAY
then "D-"
else if agg == AggregationPeriod.WEEK
then "W-"
else if agg == AggregationPeriod.MONTH
then "M-"
else "Y-") + if showValuesInBubbles then "CurrOpen $" + currentOpen else "CurrOpen", Color.WHITE, yes);
AddChartBubble(showBubbles and IsNaN(close[b]) and !IsNaN(close[b1]),
#if IsNaN(prevDayClose[1]) and !IsNaN(prevDayClose) then prevDayClose else NA,
prevDayClose[b],
(if agg == AggregationPeriod.DAY
then "D-"
else if agg == AggregationPeriod.WEEK
then "W-"
else if agg == AggregationPeriod.MONTH
then "M-"
else "Y-") + if showValuesInBubbles then "PrevClose $" + prevDayClose else "PrevClose", Color.YELLOW, yes);
AddChartBubble(showBubbles and IsNaN(close[b]) and !IsNaN(close[b1]),
# if IsNaN(prevDayLow[1]) and !IsNaN(prevDayLow) then prevDayLow else NA,
prevDayLow[b],
(if agg == AggregationPeriod.DAY
then "D-"
else if agg == AggregationPeriod.WEEK
then "W-"
else if agg == AggregationPeriod.MONTH
then "M-"
else "Y-") + if showValuesInBubbles then "PrevLow $" + prevDayLow else "PrevLow", Color.RED, yes);
AddChartBubble(showBubbles and IsNaN(close[b]) and !IsNaN(close[b1]),
#if IsNaN(prevDayHigh[1]) and !IsNaN(prevDayHigh) then prevDayHigh else NA,
prevDayHigh[b],
(if agg == AggregationPeriod.DAY
then "D-"
else if agg == AggregationPeriod.WEEK
then "W-"
else if agg == AggregationPeriod.MONTH
then "M-"
else "Y-") + if showValuesInBubbles then "PrevHigh $" + prevDayHigh else "PrevHigh", Color.GREEN, yes);

AddLabel(showlabel,
if agg == AggregationPeriod.DAY
then "DAY"
else if agg == AggregationPeriod.WEEK
then "WEEK"
else if agg == AggregationPeriod.MONTH
then "MONTH"
else "YEAR", if close(period = agg)[1] > close(period = agg) then Color.GREEN else Color.RED);

currentOpen.SetDefaultColor(Color.WHITE);
prevDayLow.SetDefaultColor(Color.RED);
prevDayHigh.SetDefaultColor(Color.GREEN);
prevDayClose.SetDefaultColor(Color.YELLOW);
currentOpen.SetPaintingStrategy(PaintingStrategy.HORIZONTAL);
prevDayLow.SetPaintingStrategy(PaintingStrategy.HORIZONTAL);
prevDayHigh.SetPaintingStrategy(PaintingStrategy.HORIZONTAL);
prevDayClose.SetPaintingStrategy(PaintingStrategy.HORIZONTAL);
 
Last edited:
4uTTijm.png
[/IMG]
Was wondering if someone could help out with a script that could plot yesterdays high and low with the anchoring feature of the projection pivots indicator (https://usethinkscript.com/threads/...ort-resistance-indicator-for-thinkorswim.158/). Not that savvy with code so if someone could help that would be huge. Also want to note that I would prefer if the lines didn't go into the trading day. Trying to clean charts up. thx

There are selectable input options to turn off/on plots. The default yes is the only on to show just the lines in your image.

Screenshot-2023-01-26-180458.png
Ruby:
#ProjectionPivots_v03_JQ
#03.04.2019
#Original Code and Concept by Mobius:
# V01.08.2012 Projection Pivots
# mobius

# Notes:
# 03.04.2019 added linits on extensions
# 03.05.2019 adjusted limits on extensions by adding user input upper and lower extenion percent limits

#declare Once_Per_Bar;
#Inputs
input n = 21;

input showBothPivotLines   = no;
input showPriorPivotLines = yes;
input extend_PriorPivotLines = no;

input showPivotValues = no;
input showPivotDots  = no;

input showBarNumbers = no;


input show_trendlines = no;
input ExtensionLengthBars = 20; # added to control length of Entension
input UpperExtensionPercentLimit = 5;
input LowerExtensionPercentLimit = 5;

input DisplayLabel = yes;    #JQ 7.8.2018 added
AddLabel (DisplayLabel, "Projection Pivots n:" + n + " " , Color.WHITE);    #JQ 7.8.2018 added

 
# Universal Header _v030429019 _JQ
#     code from various sources including Mobius, NoLongerNube and others
# Comment out unnecessary portions to preserve tos memory and enhance speed

# Universal Definitions using Padawan variable naming convention (JQ) v03.04.2019
# iData Definitions
def vHigh = high;  # creates the variable vHigh.  Use of the variable reduce data calls to tos iData server
#    def initHigh =  CompoundValue(1, high, high);  # creates and initialized variable for High
def vLow = low;
#    def initLow = CompoundValue(1, low, low);
def vOpen = open;
#    def initOpen = CompoundValue(1, open, open);
def vClose = close;
#    def initClose = CompoundValue(1, close, close);
def vVolume = volume;
#    def initVolume = CompoundValue(1, volume, volume);
def nan = Double.NaN;
# Bar Time & Date
def bn = BarNumber();
def currentBar = HighestAll(if !IsNaN(vHigh) then bn else nan);
#    def Today = GetDay() ==GetLastDay();
#    def time = GetTime();
#    def GlobeX = GetTime() < RegularTradingStart(GetYYYYMMDD());
    # def globeX_v2 = if time crosses below RegularTradingEnd(GetYYYYMMDD()) then bn else GlobeX[1];
#    def RTS  = RegularTradingStart(GetYYYYMMDD());
#    def RTE  = RegularTradingEnd(GetYYYYMMDD());
#    def RTH = GetTime() > RegularTradingStart(GetYYYYMMDD());
#    def RTH_v2 = if time crosses above RegularTradingStart(GetYYYYMMDD()) then bn else RTH[1];

# bars that start and end the sessions  #(borrowed from nube)
#    def rthStartBar    = CompoundValue(1,
#                         if   !IsNaN(vClose)
#                         &&   time crosses above RegularTradingStart(GetYYYYMMDD())
#                         then bn
#                         else rthStartBar[1], 0);
#    def rthEndBar      = CompoundValue(1,
#                         if   !IsNaN(vClose)
#                         &&   time crosses above RegularTradingEnd(GetYYYYMMDD())
#                         then bn
#                         else rthEndBar[1], 1);
#    def globexStartBar = CompoundValue(1,
#                         if   !IsNaN(vClose)
#                         &&   time crosses below RegularTradingEnd(GetYYYYMMDD())
#                         then bn
#                         else globexStartBar[1], 1);
#    def rthSession = if   bn crosses above rthStartBar #+ barsExtendedBeyondSession
#                     then 1
#                     else if   bn crosses above rthEndBar #+ barsExtendedBeyondSession
#                          then 0
#                     else rthSession[1];

# Bubble Locations
def x_AxisLastExpansionBar = BarNumber() == HighestAll(BarNumber());  #corrected 11.12.2018 (JQ)
        # syntax: addChartBubble(x_AxisLastExpansionBar, y-axis coordinate," text", Color.LIME); #verified 12.25.2018 (JQ)

def PH;
def PL;
def hh = fold i = 1 to n + 1
            with p = 1
            while p
            do vHigh > GetValue(vHigh, -i);
PH = if (bn > n and
                vHigh == Highest(vHigh, n) and
                hh)
            then vHigh
            else Double.NaN;
def ll = fold j = 1 to n + 1
            with q = 1
            while q
            do vLow < GetValue(low, -j);
PL = if (bn > n and
                vLow == Lowest(vLow, n) and
                ll)
            then vLow
            else Double.NaN;
def PHBar = if !IsNaN(PH)
               then bn
               else PHBar[1];
def PLBar = if !IsNaN(PL)
               then bn
               else PLBar[1];
def PHL = if !IsNaN(PH)
             then PH
             else PHL[1];
def priorPHBar = if PHL != PHL[1]
                    then PHBar[1]
                    else priorPHBar[1];
def PLL = if !IsNaN(PL)
             then PL
             else PLL[1];
def priorPLBar = if PLL != PLL[1]
                    then PLBar[1]
                    else priorPLBar[1];
def HighPivots = bn >= HighestAll(priorPHBar);
def LowPivots = bn >= HighestAll(priorPLBar);
def FirstRpoint = if HighPivots
                     then bn - PHBar
                     else 0;
def PriorRpoint = if HighPivots
                     then bn - priorPHBar
                     else 0;
def RSlope = (GetValue(PH, FirstRpoint) - GetValue(PH, PriorRpoint))
                       / (PHBar - priorPHBar);
def FirstSpoint = if LowPivots
                     then bn - PLBar
                     else 0;
def PriorSpoint = if LowPivots
                     then bn - priorPLBar
                     else 0;
def SSlope = (GetValue(PL, FirstSpoint) - GetValue(PL, PriorSpoint))
                   / (PLBar - priorPLBar);
def RExtend = if bn == HighestAll(PHBar)
                 then 1
                 else RExtend[1];
def SExtend = if bn == HighestAll(PLBar)
                 then 1
                 else SExtend[1];

plot pivotHigh = if HighPivots
                   then PH
                   else Double.NaN;
pivotHigh.SetDefaultColor(GetColor(1));
pivotHigh.SetPaintingStrategy(PaintingStrategy.VALUES_ABOVE);
pivotHigh.SetHiding(!showPivotValues);

def phi = if HighPivots != HighPivots[1] then PH else phi[1];

plot pivotHighline_2 = if !extend_PriorPivotLines and GetDay() != GetLastDay()
                 then phi[1]
                 else if extend_PriorPivotLines
                 then phi[1] else Double.NaN;
pivotHighline_2.SetPaintingStrategy(PaintingStrategy.DASHES);  # Mobius original was DASHES
pivotHighline_2.SetDefaultColor(Color.UPTICK);    #JQ 7.8.2018 added
pivotHighline_2.SetHiding(!showPriorPivotLines);

plot pivotHighLine = if PHL > 0 and
                          HighPivots
                       then PHL
                       else Double.NaN;
pivotHighLine.SetPaintingStrategy(PaintingStrategy.DASHES);  # Mobius original was DASHES
pivotHighLine.SetDefaultColor(Color.UPTICK);    #JQ 7.8.2018 added
pivotHighLine.SetHiding(!showBothPivotLines);

plot RLine = pivotHigh;
RLine.EnableApproximation();
RLine.SetDefaultColor(Color.LIGHT_GRAY);
RLine.SetStyle(Curve.SHORT_DASH);
RLine.SetHiding(!show_trendlines);

# Added code to limit resistance estension line (JQ 03.04.2019)

def calc_ResistanceExtension = if RExtend
                    then (bn - PHBar) * RSlope + PHL
                    else Double.NaN;
plot line_ResistanceExtension = if bn <= (currentBar + ExtensionLengthBars)
                                   and calc_ResistanceExtension[1] >=  (LowestAll(vLow) * (1 - (LowerExtensionPercentLimit / 100)))
                                   and calc_ResistanceExtension[1] <= (HighestAll(vHigh) * (1 + (UpperExtensionPercentLimit / 100)))
                               then calc_ResistanceExtension else Double.NaN;
line_ResistanceExtension.SetStyle(Curve.SHORT_DASH);
line_ResistanceExtension.SetDefaultColor(Color.LIGHT_GRAY); #was 7
line_ResistanceExtension.SetLineWeight(1);
line_ResistanceExtension.SetHiding(!show_trendlines);


# Low Plots
plot pivotLow = if LowPivots
                  then PL
                  else Double.NaN;
pivotLow.SetDefaultColor(GetColor(4));
pivotLow.SetPaintingStrategy(PaintingStrategy.VALUES_BELOW);
pivotLow.SetHiding(!showPivotValues);

def plo = if LowPivots != LowPivots[1] then PL else plo[1];

plot pivotLowline_2 = if !extend_PriorPivotLines and GetDay() != GetLastDay()
                 then plo
                 else if extend_PriorPivotLines
                 then plo else Double.NaN;

pivotLowline_2.SetPaintingStrategy(PaintingStrategy.DASHES);  # Mobius original was DASHES
pivotLowline_2.SetDefaultColor(Color.DOWNTICK);#  #  JQ 7.8.2018 added
pivotLowline_2.SetHiding(!showPriorPivotLines);

plot pivotLowLine = if PLL > 0 and
                         LowPivots
                      then PLL
                      else Double.NaN;

pivotLowLine.SetPaintingStrategy(PaintingStrategy.DASHES);  # Mobius original was DASHES
pivotLowLine.SetDefaultColor(Color.DOWNTICK);#  #  JQ 7.8.2018 added
pivotLowLine.SetHiding(!showBothPivotLines);

plot SupportLine = pivotLow;
SupportLine.EnableApproximation();
SupportLine.SetDefaultColor(Color.LIGHT_GRAY);
SupportLine.SetStyle(Curve.SHORT_DASH);
SupportLine.SetHiding(!show_trendlines);

# Added code to limit support estension line (JQ 03.04.2019)
def calc_SupportExtension = if SExtend
                          then (bn - PLBar) * SSlope + PLL
                          else Double.NaN;
plot line_SupportExtension = if bn <= (currentBar + ExtensionLengthBars)
                                   and calc_SupportExtension[1] >= (LowestAll(vLow) * (1 - (LowerExtensionPercentLimit / 100)))
                                   and calc_SupportExtension[1] <= (HighestAll(vHigh) * (1 + (UpperExtensionPercentLimit / 100)))
                               then calc_SupportExtension else Double.NaN;
line_SupportExtension.SetDefaultColor(Color.LIGHT_GRAY); #was 7
line_SupportExtension.SetStyle(Curve.SHORT_DASH);
line_SupportExtension.SetLineWeight(1);
line_SupportExtension.SetHiding(!show_trendlines);

plot BarNumbersBelow = bn;
BarNumbersBelow.SetDefaultColor(GetColor(0));
BarNumbersBelow.SetHiding(!showBarNumbers);
BarNumbersBelow.SetPaintingStrategy(PaintingStrategy.VALUES_BELOW);

plot PivotDot = if !IsNaN(pivotHigh)
                  then pivotHigh
                  else if !IsNaN(pivotLow)
                  then pivotLow
                  else Double.NaN;
PivotDot.SetDefaultColor(GetColor(7));
PivotDot.SetPaintingStrategy(PaintingStrategy.POINTS);
PivotDot.SetLineWeight(3);
PivotDot.SetHiding(!showPivotDots);
# End Code
 
Hello team. I am trying to figure out how to only get my lines to extend right and not left all the way across the screen. I am having trouble trying to figure out a code. This indicator shows the previous day's low, high, close, and then the premarket high and low for the day. I do not need them to extend left into past days. Please help.

Here is the code:

Code:
#PM Range Break

#Define Market time and variables for PMHigh and PMLow
input PMopentime = 400;
input PMendtime = 930;
def na = Double.NaN; 
#check if the PM range time is now 
def PMActive = if GetLastDay() == GetDay() and  
                               SecondsFromTime(PMopentime) >= 0 and  
                               SecondsFromTime(PMendtime) < 0  
                           then 1 else 0; 

# Track the PM Range high and low if PM is active 
def PMHigh = if PMActive then high else na;
def PMLow = if PMActive then low else na; 

# Def the PM Range high and low 
def PreH = if GetLastDay() != GetDay() or !PMActive then na else HighestAll(PMHigh);
def PreL = if GetLastDay() != GetDay() or !PMActive then na else LowestAll(PMLow); 


#Defines + Inputs
input PrevHigh = yes;
input PrevLow = yes;
input PrevClose = yes;
input PreviousDayOnly = yes;
input LineWeight = 1;
input BubbleOn = yes;

def Today = GetDay() == GetLastDay();
def agg = AggregationPeriod.DAY;
def x_b = Today[0] and !Today[-1];


#Previous HOD Line
def h = if PreviousDayOnly
         then if Today
              then high(period = agg)[1]
              else Double.NaN
         else high(period = agg)[1];
#AddChartBubble(PrevHigh and BubbleOn and x_b, h, "Y HOD", Color.LIGHT_GRAY);
         
#Previous LOD Line
def l = if PreviousDayOnly
         then if Today
              then low(period = agg)[1]
              else Double.NaN
         else low(period = agg)[1];
#AddChartBubble(PrevLow and BubbleOn and x_b, l, "Y LOD", Color.LIGHT_GRAY);

#Previous Close Line
def c = if PreviousDayOnly
         then if Today
              then close(period = agg)[1]
              else Double.NaN
         else close(period = agg)[1];
#AddChartBubble(PrevClose and BubbleOn and x_b, c, "Y Close", Color.LIGHT_GRAY);


#plot Lines that are extended
plot yHigh = if GetDay() then HighestAll(h) else Double.NaN;
yHigh.SetDefaultColor(Color.yellow);

plot ylow = if GetDay() then LowestAll(l) else Double.NaN;
ylow.SetDefaultColor(Color.dark_orange);

plot yclose = if GetDay() then HighestAll(c) else Double.NaN;
yclose.SetDefaultColor(Color.cyan);

plot PreHe = HighestAll(PMHigh);
PreHe.SetDefaultColor(Color.uptick);

plot PreLe = LowestAll(PMLow);
PreLe.SetDefaultColor(Color.downtick);

#add chart labels
def aggregation = AggregationPeriod.DAY;
#broken PM High?
def HOD = high(period = aggregation);
AddLabel(yes, if HighestAll(PMHigh) < HOD then "Broken PM High: Yes "  else "Broken PM High: No",if HighestAll(PMHigh) < HOD then color.uptick else color.gray);

#broken PM Low?
def LOD = low(period = aggregation);
AddLabel(yes, if LowestAll(PMLow) > LOD then "Broken PM Low: Yes " else "Broken PM Low: No", if LowestAll(PMLow) > LOD then color.downtick else color.gray);

#add label for YHOD, YLOD, Yesterday Close
addlabel(yes, "Yesterday's HOD: " + H, color.yellow);
addlabel(yes, "Yesterday's LOD: " + L, color.dark_orange);
addlabel(yes, "Yesterday's Close: " + c, color.cyan);
 
Hello team. I am trying to figure out how to only get my lines to extend right and not left all the way across the screen. I am having trouble trying to figure out a code. This indicator shows the previous day's low, high, close, and then the premarket high and low for the day. I do not need them to extend left into past days. Please help.

Here is the code:

Code:
#PM Range Break

#Define Market time and variables for PMHigh and PMLow
input PMopentime = 400;
input PMendtime = 930;
def na = Double.NaN;
#check if the PM range time is now
def PMActive = if GetLastDay() == GetDay() and 
                               SecondsFromTime(PMopentime) >= 0 and 
                               SecondsFromTime(PMendtime) < 0 
                           then 1 else 0;

# Track the PM Range high and low if PM is active
def PMHigh = if PMActive then high else na;
def PMLow = if PMActive then low else na;

# Def the PM Range high and low
def PreH = if GetLastDay() != GetDay() or !PMActive then na else HighestAll(PMHigh);
def PreL = if GetLastDay() != GetDay() or !PMActive then na else LowestAll(PMLow);


#Defines + Inputs
input PrevHigh = yes;
input PrevLow = yes;
input PrevClose = yes;
input PreviousDayOnly = yes;
input LineWeight = 1;
input BubbleOn = yes;

def Today = GetDay() == GetLastDay();
def agg = AggregationPeriod.DAY;
def x_b = Today[0] and !Today[-1];


#Previous HOD Line
def h = if PreviousDayOnly
         then if Today
              then high(period = agg)[1]
              else Double.NaN
         else high(period = agg)[1];
#AddChartBubble(PrevHigh and BubbleOn and x_b, h, "Y HOD", Color.LIGHT_GRAY);
        
#Previous LOD Line
def l = if PreviousDayOnly
         then if Today
              then low(period = agg)[1]
              else Double.NaN
         else low(period = agg)[1];
#AddChartBubble(PrevLow and BubbleOn and x_b, l, "Y LOD", Color.LIGHT_GRAY);

#Previous Close Line
def c = if PreviousDayOnly
         then if Today
              then close(period = agg)[1]
              else Double.NaN
         else close(period = agg)[1];
#AddChartBubble(PrevClose and BubbleOn and x_b, c, "Y Close", Color.LIGHT_GRAY);


#plot Lines that are extended
plot yHigh = if GetDay() then HighestAll(h) else Double.NaN;
yHigh.SetDefaultColor(Color.yellow);

plot ylow = if GetDay() then LowestAll(l) else Double.NaN;
ylow.SetDefaultColor(Color.dark_orange);

plot yclose = if GetDay() then HighestAll(c) else Double.NaN;
yclose.SetDefaultColor(Color.cyan);

plot PreHe = HighestAll(PMHigh);
PreHe.SetDefaultColor(Color.uptick);

plot PreLe = LowestAll(PMLow);
PreLe.SetDefaultColor(Color.downtick);

#add chart labels
def aggregation = AggregationPeriod.DAY;
#broken PM High?
def HOD = high(period = aggregation);
AddLabel(yes, if HighestAll(PMHigh) < HOD then "Broken PM High: Yes "  else "Broken PM High: No",if HighestAll(PMHigh) < HOD then color.uptick else color.gray);

#broken PM Low?
def LOD = low(period = aggregation);
AddLabel(yes, if LowestAll(PMLow) > LOD then "Broken PM Low: Yes " else "Broken PM Low: No", if LowestAll(PMLow) > LOD then color.downtick else color.gray);

#add label for YHOD, YLOD, Yesterday Close
addlabel(yes, "Yesterday's HOD: " + H, color.yellow);
addlabel(yes, "Yesterday's LOD: " + L, color.dark_orange);
addlabel(yes, "Yesterday's Close: " + c, color.cyan);

There are numerous studies on this topic in this site. Here is one that from a thread of these that should help with your idea.

https://usethinkscript.com/threads/...open-of-day-for-thinkorswim.13139/post-114051
 
@iambkm01 As requested, the Open should be added as well:

Code:
input aggregationPeriod = AggregationPeriod.DAY;
input length = 1;
input displace = -1;
input showOnlyLastPeriod = yes;

plot PrevDayOpen;
plot PrevDayHigh;
plot PrevDayLow;
plot PrevDayClose;

if showOnlyLastPeriod and !IsNaN(open(period = aggregationPeriod)[-1]) and !IsNaN(high(period = aggregationPeriod)[-1]) and !IsNaN(low(period = aggregationPeriod)[-1]) and !IsNaN(close(period = aggregationPeriod)[-1])
{
    PrevDayOpen = Double.NaN;
    PrevDayHigh = Double.NaN;
    PrevDayLow = Double.NaN;
    PrevDayClose = Double.NaN;
}
else
{
    PrevDayOpen = Highest(open(period = aggregationPeriod)[-displace], length);
    PrevDayHigh = Highest(high(period = aggregationPeriod)[-displace], length);
    PrevDayLow = Highest(low(period = aggregationPeriod)[-displace], length);
    PrevDayClose = Highest(close(period = aggregationPeriod)[-displace], length);
}
PrevDayOpen.SetDefaultColor(CreateColor(116,189,239));
PrevDayOpen.SetPaintingStrategy(PaintingStrategy.LINE);
PrevDayOpen.SetStyle(Curve.LONG_DASH);

PrevDayHigh.SetDefaultColor(CreateColor(0,255,255));
PrevDayHigh.SetPaintingStrategy(PaintingStrategy.LINE);

PrevDayLow.SetDefaultColor(CreateColor(0,255,255));
PrevDayLow.SetPaintingStrategy(PaintingStrategy.LINE);

PrevDayClose.SetDefaultColor(CreateColor(116,189,239));
PrevDayClose.SetPaintingStrategy(PaintingStrategy.LINE);
PrevDayClose.SetStyle(Curve.LONG_DASH);

Hope this helps...

Good Luck and Good Trading :)
Hi, I just wonder if there is a mobile version of the code. It looks like the plot function does not show up on the TOS app. Thank you; I really appreciate it.
 
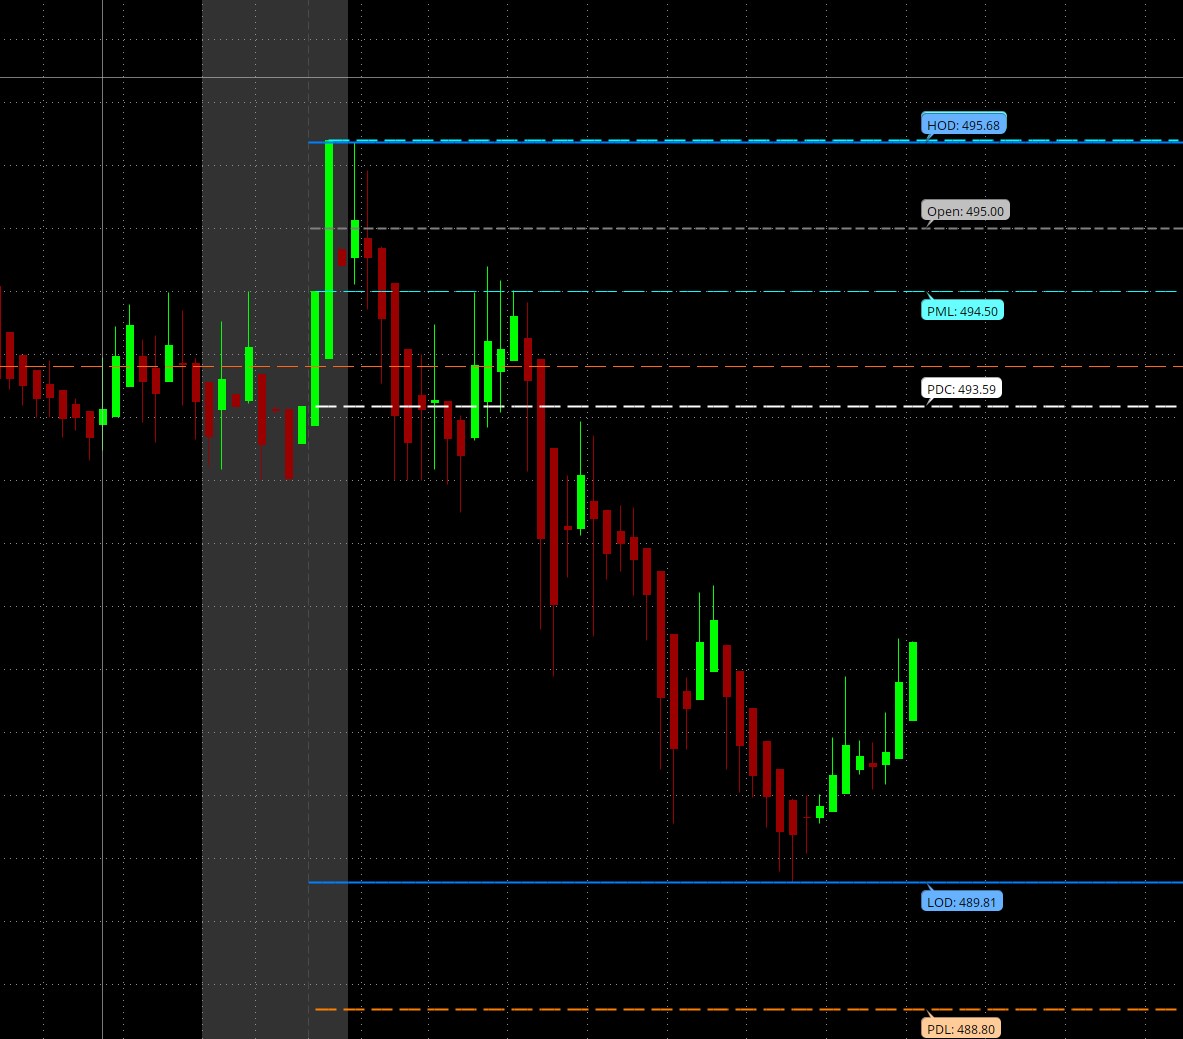
@SleepyZ , Is there a way to have the Premarket Low/High be for the entire after hours and the Previous Day Low/High only show for actual open hours As it is written the code shows after hours as previous day lows/highs and Premarket as PML/PMH. SEE Attached:
This is COST PML shows 494.50 but actual PML was 493.
yCJKeuu.jpg
 
Hi, I just wonder if there is a mobile version of the code. It looks like the plot function does not show up on the TOS app. Thank you; I really appreciate it.
While there are times when a custom study can be tweaked to function on the ToS mobile app, unfortunately, this isn't one of those situations.

Here's the deal: the code you're working with won't function on mobile at all, no matter what we try.
If we were to remove all the components that don't work on mobile, like multiple timeframes and dashed lines, we would be left with no code at all.
 

Join useThinkScript to post your question to a community of 21,000+ developers and traders.

Not the exact question you're looking for?

Start a new thread and receive assistance from our community.

87k+ Posts
292 Online
Create Post

The Market Trading Game Changer

Join 2,500+ subscribers inside the useThinkScript VIP Membership Club
  • Exclusive indicators
  • Proven strategies & setups
  • Private Discord community
  • ‘Buy The Dip’ signal alerts
  • Exclusive members-only content
  • Add-ons and resources
  • 1 full year of unlimited support

Frequently Asked Questions

What is useThinkScript?

useThinkScript is the #1 community of stock market investors using indicators and other tools to power their trading strategies. Traders of all skill levels use our forums to learn about scripting and indicators, help each other, and discover new ways to gain an edge in the markets.

How do I get started?

We get it. Our forum can be intimidating, if not overwhelming. With thousands of topics, tens of thousands of posts, our community has created an incredibly deep knowledge base for stock traders. No one can ever exhaust every resource provided on our site.

If you are new, or just looking for guidance, here are some helpful links to get you started.

What are the benefits of VIP Membership?
VIP members get exclusive access to these proven and tested premium indicators: Buy the Dip, Advanced Market Moves 2.0, Take Profit, and Volatility Trading Range. In addition, VIP members get access to over 50 VIP-only custom indicators, add-ons, and strategies, private VIP-only forums, private Discord channel to discuss trades and strategies in real-time, customer support, trade alerts, and much more. Learn all about VIP membership here.
How can I access the premium indicators?
To access the premium indicators, which are plug and play ready, sign up for VIP membership here.
Back
Top