I took this indicator from Robert and tweaked it a little to my need. Originally it plots the 5 min opening range breakout. However, I took that out and only keep the previous day high and low. Then I add some customizations to it to make the breakout or breakdown more noticeable.
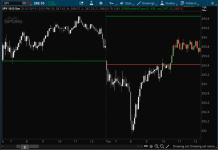
Here is what it looks like:

When the price is within the previous day high and low range then you would see the color of the regular candle. When it's outside of the range then red candles become gray and green candles become white.
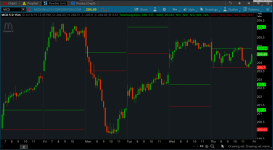
Here is what it looks like:
When the price is within the previous day high and low range then you would see the color of the regular candle. When it's outside of the range then red candles become gray and green candles become white.
thinkScript Code
Rich (BB code):
# 5 min opening range
# Robert Payne
#Plot opening range high / low
input OpenRangeMinutes = 5;
input MarketOpenTime = 0930;
input ShowTodayOnly = yes;

def Today = if GetDay() == GetLastDay() then 1 else 0;
def FirstMinute = if SecondsFromTime(MarketOpenTime) < 60 then 1 else 0;
def OpenRangeTime = if SecondsFromTime(MarketOpenTime) < 60 * OpenRangeMinutes then 1 else 0;

#Plot yesterday's high / low
plot Yhigh = if ShowTodayOnly and !Today then Double.NaN else high(period = "day" )[1];
plot Ylow = if ShowTodayOnly and !Today then Double.NaN else low(period = "day" )[1];

Yhigh.SetPaintingStrategy(PaintingStrategy.HORIZONTAL);
Yhigh.SetDefaultColor(Color.UPTICK);
Yhigh.SetLineWeight(2);
Ylow.SetPaintingStrategy(PaintingStrategy.HORIZONTAL);
Ylow.SetDefaultColor(Color.DOWNTICK);
Ylow.SetLineWeight(2);

#Plot pivot
plot Pivot = if ShowTodayOnly and !Today then Double.NaN else (high(period = "day" )[1] + low(period = "day" )[1] + close(period = "day" )[1]) / 3;
Pivot.SetPaintingStrategy(PaintingStrategy.HORIZONTAL);
Pivot.SetDefaultColor(Color.YELLOW);
Pivot.SetLineWeight(2);

#Plot 10 day high / low
plot TenHigh = if ShowTodayOnly and !Today then Double.NaN else Highest(high(period = "day" )[1], 10);
plot TenLow = if ShowTodayOnly and !Today then Double.NaN else Lowest(low(period = "day" )[1], 10);

TenHigh.SetPaintingStrategy(PaintingStrategy.HORIZONTAL);
TenHigh.SetDefaultColor(Color.UPTICK);
TenHigh.SetLineWeight(3);
TenLow.SetPaintingStrategy(PaintingStrategy.HORIZONTAL);
TenLow.SetDefaultColor(Color.DOWNTICK);
TenLow.SetLineWeight(3);

AssignPriceColor(if close >= Yhigh then Color.GREEN
  else if close <= Ylow then Color.RED
  else Color.CURRENT);

AssignPriceColor(if close > Yhigh and open < close then Color.White
  else if close > YHIGH and open > close then Color.Gray
  else if close < Ylow and open < close then Color.White
  else if close < Ylow and open > close then Color.Gray
  else Color.CURRENT);
Shareable Link
https://tos.mx/tbjMgbPrevious Intradays High, Low, Mean
Code:
# Previous Intradays High, Low, Mean
# Mobius
# V01.12.2017 Desktop and Mobile
# Revised original code that uses SecondsFromTime() and SecondsTillTime(). Code now uses RegularTradingStart() and RegularTradingEnd() to bracket RTH. Works in Mobile Apps

def bar = barNumber();
def h = high;
def l = low;
def c = close;
def firstBar = if getTime() crosses above RegularTradingStart(GetYYYYMMDD()) and
                  !isNaN(close)
               then bar
               else double.nan;
def lastBar = if getTime() crosses above RegularTradingEnd(GetYYYYMMDD()) and
                 !isNaN(close)
              then bar
              else double.nan;
addVerticalLine(bar == HighestAll(firstBar), "first bar", color.cyan, curve.short_dash);
addVerticalLine(bar == HighestAll(lastBar), "last bar", color.cyan, curve.short_dash);
def bar_t1 = if !isNaN(firstBar)
            then bar
            else bar_t1[1];
def bar_t2 = if !isNaN(lastBar)
             then bar
             else bar_t2[1];
def prevFirstBar = if bar_t1 != bar_t1[1]
              then bar_t1[1]
              else prevFirstBar[1];
def prevLastBar = if bar_t2 != bar_t2[1]
                  then bar_t2[1]
                  else prevLastBar[1];
addVerticalLine(bar == HighestAll(prevFirstBar), "prev first bar", color.red, curve.short_dash);
addVerticalLine(bar == HighestAll(prevLastBar), "prev Last bar", color.red, curve.short_dash);
def hh = if bar == HighestAll(prevFirstBar)
         then h
         else if between(bar, highestAll(prevFirstBar), highestAll(LastBar)) and
                 h > hh[1]
              then h
              else hh[1];
def hhBar = if h == hh and between(bar, highestAll(prevFirstBar), highestAll(LastBar))
            then barNumber()
            else double.nan;
def ll = if bar == HighestAll(prevFirstBar)
         then l
         else if between(bar, highestAll(prevFirstBar), highestAll(LastBar)) and
                 l < ll[1]
              then l
              else ll[1];
def llBar = if l == ll and between(bar, highestAll(prevFirstBar), highestAll(LastBar))
            then bar
            else double.nan;
plot PrevDayHigh = if bar >= highestAll(hhBar)
                   then highestAll(if isNaN(c[-1])
                                   then hh
                                   else double.nan)
                   else double.nan;
     PrevDayHigh.SetStyle(Curve.Long_Dash);
     PrevDayHigh.SetLineWeight(3);
     PrevDayHigh.SetDefaultColor(Color.Green);
     PrevDayHigh.HideTitle();
plot PrevDayLow = if bar >= HighestAll(llBar)
                  then highestAll(if isNaN(c[-1])
                                  then ll
                                  else double.nan)
                  else double.nan;
     PrevDayLow.SetStyle(Curve.Long_Dash);
     PrevDayLow.SetLineWeight(3);
     PrevDayLow.SetDefaultColor(Color.Red);
     PrevDayLow.HideTitle();
def hl2bar = Floor((highestAll(hhbar) + highestAll(llBar)) / 2);
def hl2price = Round(((PrevDayHigh + PrevDayLow) / 2) / TickSize(), 0) * TickSize();
plot PrevDayHL2 = if bar >= highestAll(HL2bar)
               then highestAll(if !isNaN(c[-1])
                               then HL2price
                               else double.nan)
               else double.nan;
     PrevDayHL2.SetStyle(Curve.Long_Dash);
     PrevDayHL2.SetLineWeight(3);
     PrevDayHL2.SetDefaultColor(Color.Yellow);
     PrevDayHL2.HideTitle();
# End Code Previous Days High, Low, Mean
Attachments
Last edited:


