Previous Day High and Low Breakout Indicator for ThinkorSwim

BenTen

Administrative
Staff member
Staff
VIP
Lifetime
I took this indicator from Robert and tweaked it a little to my need. Originally it plots the 5 min opening range breakout. However, I took that out and only keep the previous day high and low. Then I add some customizations to it to make the breakout or breakdown more noticeable.

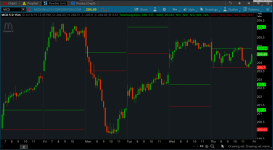
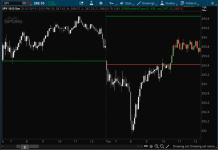
Here is what it looks like:

3DOqpxq.png


When the price is within the previous day high and low range then you would see the color of the regular candle. When it's outside of the range then red candles become gray and green candles become white.

thinkScript Code

Rich (BB code):
# 5 min opening range
# Robert Payne
#Plot opening range high / low
input OpenRangeMinutes = 5;
input MarketOpenTime = 0930;
input ShowTodayOnly = yes;

def Today = if GetDay() == GetLastDay() then 1 else 0;
def FirstMinute = if SecondsFromTime(MarketOpenTime) < 60 then 1 else 0;
def OpenRangeTime = if SecondsFromTime(MarketOpenTime) < 60 * OpenRangeMinutes then 1 else 0;

#Plot yesterday's high / low
plot Yhigh = if ShowTodayOnly and !Today then Double.NaN else high(period = "day" )[1];
plot Ylow = if ShowTodayOnly and !Today then Double.NaN else low(period = "day" )[1];

Yhigh.SetPaintingStrategy(PaintingStrategy.HORIZONTAL);
Yhigh.SetDefaultColor(Color.UPTICK);
Yhigh.SetLineWeight(2);
Ylow.SetPaintingStrategy(PaintingStrategy.HORIZONTAL);
Ylow.SetDefaultColor(Color.DOWNTICK);
Ylow.SetLineWeight(2);

#Plot pivot
plot Pivot = if ShowTodayOnly and !Today then Double.NaN else (high(period = "day" )[1] + low(period = "day" )[1] + close(period = "day" )[1]) / 3;
Pivot.SetPaintingStrategy(PaintingStrategy.HORIZONTAL);
Pivot.SetDefaultColor(Color.YELLOW);
Pivot.SetLineWeight(2);

#Plot 10 day high / low
plot TenHigh = if ShowTodayOnly and !Today then Double.NaN else Highest(high(period = "day" )[1], 10);
plot TenLow = if ShowTodayOnly and !Today then Double.NaN else Lowest(low(period = "day" )[1], 10);

TenHigh.SetPaintingStrategy(PaintingStrategy.HORIZONTAL);
TenHigh.SetDefaultColor(Color.UPTICK);
TenHigh.SetLineWeight(3);
TenLow.SetPaintingStrategy(PaintingStrategy.HORIZONTAL);
TenLow.SetDefaultColor(Color.DOWNTICK);
TenLow.SetLineWeight(3);

AssignPriceColor(if close >= Yhigh then Color.GREEN
  else if close <= Ylow then Color.RED
  else Color.CURRENT);

AssignPriceColor(if close > Yhigh and open < close then Color.White
  else if close > YHIGH and open > close then Color.Gray
  else if close < Ylow and open < close then Color.White
  else if close < Ylow and open > close then Color.Gray
  else Color.CURRENT);

Shareable Link

https://tos.mx/tbjMgb

Previous Intradays High, Low, Mean

Code:
# Previous Intradays High, Low, Mean
# Mobius
# V01.12.2017 Desktop and Mobile
# Revised original code that uses SecondsFromTime() and SecondsTillTime(). Code now uses RegularTradingStart() and RegularTradingEnd() to bracket RTH. Works in Mobile Apps

def bar = barNumber();
def h = high;
def l = low;
def c = close;
def firstBar = if getTime() crosses above RegularTradingStart(GetYYYYMMDD()) and
                  !isNaN(close)
               then bar
               else double.nan;
def lastBar = if getTime() crosses above RegularTradingEnd(GetYYYYMMDD()) and
                 !isNaN(close)
              then bar
              else double.nan;
addVerticalLine(bar == HighestAll(firstBar), "first bar", color.cyan, curve.short_dash);
addVerticalLine(bar == HighestAll(lastBar), "last bar", color.cyan, curve.short_dash);
def bar_t1 = if !isNaN(firstBar)
            then bar
            else bar_t1[1];
def bar_t2 = if !isNaN(lastBar)
             then bar
             else bar_t2[1];
def prevFirstBar = if bar_t1 != bar_t1[1]
              then bar_t1[1]
              else prevFirstBar[1];
def prevLastBar = if bar_t2 != bar_t2[1]
                  then bar_t2[1]
                  else prevLastBar[1];
addVerticalLine(bar == HighestAll(prevFirstBar), "prev first bar", color.red, curve.short_dash);
addVerticalLine(bar == HighestAll(prevLastBar), "prev Last bar", color.red, curve.short_dash);
def hh = if bar == HighestAll(prevFirstBar)
         then h
         else if between(bar, highestAll(prevFirstBar), highestAll(LastBar)) and
                 h > hh[1]
              then h
              else hh[1];
def hhBar = if h == hh and between(bar, highestAll(prevFirstBar), highestAll(LastBar))
            then barNumber()
            else double.nan;
def ll = if bar == HighestAll(prevFirstBar)
         then l
         else if between(bar, highestAll(prevFirstBar), highestAll(LastBar)) and
                 l < ll[1]
              then l
              else ll[1];
def llBar = if l == ll and between(bar, highestAll(prevFirstBar), highestAll(LastBar))
            then bar
            else double.nan;
plot PrevDayHigh = if bar >= highestAll(hhBar)
                   then highestAll(if isNaN(c[-1])
                                   then hh
                                   else double.nan)
                   else double.nan;
     PrevDayHigh.SetStyle(Curve.Long_Dash);
     PrevDayHigh.SetLineWeight(3);
     PrevDayHigh.SetDefaultColor(Color.Green);
     PrevDayHigh.HideTitle();
plot PrevDayLow = if bar >= HighestAll(llBar)
                  then highestAll(if isNaN(c[-1])
                                  then ll
                                  else double.nan)
                  else double.nan;
     PrevDayLow.SetStyle(Curve.Long_Dash);
     PrevDayLow.SetLineWeight(3);
     PrevDayLow.SetDefaultColor(Color.Red);
     PrevDayLow.HideTitle();
def hl2bar = Floor((highestAll(hhbar) + highestAll(llBar)) / 2);
def hl2price = Round(((PrevDayHigh + PrevDayLow) / 2) / TickSize(), 0) * TickSize();
plot PrevDayHL2 = if bar >= highestAll(HL2bar)
               then highestAll(if !isNaN(c[-1])
                               then HL2price
                               else double.nan)
               else double.nan;
     PrevDayHL2.SetStyle(Curve.Long_Dash);
     PrevDayHL2.SetLineWeight(3);
     PrevDayHL2.SetDefaultColor(Color.Yellow);
     PrevDayHL2.HideTitle();
# End Code Previous Days High, Low, Mean
 

Attachments

  • 3DOqpxq.png
    3DOqpxq.png
    201.6 KB · Views: 336
Last edited:
This indicator displays the previous day 30min Opening Range high and low on today's chart rather than using the first 30 min range of the current day. I found it interesting considering that ORB is quite popular on this forum.

By default, it will show the 30-minute range. But you can adjust that by changing the value for input begin and input end.

O7W3MOz.png


Rich (BB code):
#Example_PreviousDaysOpeningRange-option_to_each_extended_thru_expansion
#20181120 - sleepyzzzz
#Example Opening RangeBands Highs/Lows from previous days, shown on next day, with option to extend from each day through the right expansion

script philow {
    input begin   = 0930;
    input end     = 1000;
    input end_day = 1600;
    input extend_lines_to_today = no;
    input n = 1;
    def ymd = GetYYYYMMDD();
    def ok = !IsNaN(close);
    def capture = ok and ymd != ymd[1];
    def dayCount = CompoundValue(1, if capture
                                    then dayCount[1] + 1
                                    else dayCount[1], 0);
    def thisDay = (HighestAll(dayCount) - dayCount) ;
    def hh = CompoundValue(1, if thisDay == n and SecondsFromTime(begin) == 0
                              then high
                              else if thisDay == n and  high > hh[1] and SecondsTillTime(end) > 0
                              then high
                              else hh[1] , high);
    def hhnan = if IsNaN(close) then hhnan[1] else hh;
    plot hhplot = if thisDay == n and SecondsFromTime(begin) < 0
                  then Double.NaN
                  else if extend_lines_to_today == yes  and thisDay <= n - 1 then if thisDay == n - 1 and SecondsFromTime(begin) < 0 then Double.NaN
                  else hhnan
                  else if thisDay == n - 1 and SecondsFromTime(begin) >= 0 and SecondsTillTime(end_day) > 0
                  then hh
                  else Double.NaN;

    def ll = CompoundValue(1, if thisDay == n and SecondsFromTime(begin) == 0
                              then low
                              else if  thisDay == n and low < ll[1] and SecondsTillTime(end) > 0
                              then low
                              else ll[1] , low);
    def llnan   = if IsNaN(ll) then llnan[1] else ll;
    plot llplot = if thisDay == n and SecondsFromTime(begin) < 0
                  then Double.NaN
                  else if extend_lines_to_today == yes and thisDay <= n - 1 then if thisDay == n - 1 and SecondsFromTime(begin) < 0 then Double.NaN
                  else llnan
                  else if thisDay == n - 1 and SecondsFromTime(begin) >= 0 and SecondsTillTime(end_day) > 0
                  then ll
                  else Double.NaN;
}

#Plots of Highs/Lows based upon script...add more days using similar plot statements, increasing the value by 1
input extend_lines_to_today = no;
input begin   = 0930;
input end     = 0935;
input end_day = 1600;
plot H1 = philow(begin, end, end_day, extend_lines_to_today, n = 1);
plot H2 = philow(begin, end, end_day, extend_lines_to_today, n = 2);
plot H3 = philow(begin, end, end_day, extend_lines_to_today, n = 3);
plot H4 = philow(begin, end, end_day, extend_lines_to_today, n = 4);
plot H5 = philow(begin, end, end_day, extend_lines_to_today, n = 5);
plot H6 = philow(begin, end, end_day, extend_lines_to_today, n = 6);

plot L1 = philow(begin, end, end_day, extend_lines_to_today, n = 1).llplot;
plot L2 = philow(begin, end, end_day, extend_lines_to_today, n = 2).llplot;
plot L3 = philow(begin, end, end_day, extend_lines_to_today, n = 3).llplot;
plot L4 = philow(begin, end, end_day, extend_lines_to_today, n = 4).llplot;
plot L5 = philow(begin, end, end_day, extend_lines_to_today, n = 5).llplot;
plot L6 = philow(begin, end, end_day, extend_lines_to_today, n = 6).llplot;

H1.setdefaultColor(color.green);
H2.setdefaultColor(color.green);
H3.setdefaultColor(color.green);
H4.setdefaultColor(color.green);
H5.setdefaultColor(color.green);
H6.setdefaultColor(color.green);

L1.setdefaultColor(color.red);
L2.setdefaultColor(color.red);
L3.setdefaultColor(color.red);
L4.setdefaultColor(color.red);
L5.setdefaultColor(color.red);
L6.setdefaultColor(color.red);

Shareable Link: https://tos.mx/IoiQCn

Credit:
  • sleepyzzzz
 

Attachments

  • O7W3MOz.png
    O7W3MOz.png
    261.9 KB · Views: 245
Last edited:
Indicator to show previous day High Low and Close on the current day chart

Rich (BB code):
input aggregationPeriod = AggregationPeriod.DAY;
input length = 1;
input displace = -1;
input showOnlyLastPeriod = yes;
plot PrevDayHigh;
plot PrevDayLow;
plot PrevDayClose;

if showOnlyLastPeriod and !IsNaN(high(period = aggregationPeriod)[-1]) and !IsNaN(low(period = aggregationPeriod)[-1]) and !IsNaN(close(period = aggregationPeriod)[-1])
{
    PrevDayHigh = Double.NaN;
    PrevDayLow = Double.NaN;
    PrevDayClose = Double.NaN;
}
else
{
    PrevDayHigh = Highest(high(period = aggregationPeriod)[-displace], length);
    PrevDayLow = Highest(low(period = aggregationPeriod)[-displace], length);
    PrevDayClose = Highest(close(period = aggregationPeriod)[-displace], length);
}
PrevDayHigh.SetDefaultColor(CreateColor(0,255,255));
PrevDayHigh.SetPaintingStrategy(PaintingStrategy.LINE);

PrevDayLow.SetDefaultColor(CreateColor(0,255,255));
PrevDayLow.SetPaintingStrategy(PaintingStrategy.LINE);

PrevDayClose.SetDefaultColor(CreateColor(116,189,239));
PrevDayClose.SetPaintingStrategy(PaintingStrategy.LINE);
PrevDayClose.SetStyle(Curve.LONG_DASH)
 
How would you apply this to the tos scanner to alert when price goes outside of "yesterday's range on a 5min chart? I know tos has limitations around custom scan having different time frames - in this case a 5min and daily time frame. Thank you.
 
How would you apply this to the tos scanner to alert when price goes outside of "yesterday's range on a 5min chart? I know tos has limitations around custom scan having different time frames - in this case a 5min and daily time frame. Thank you.

@jayboo876 Here is a real simple way to scan for stocks that are breaking above the previous day's high. Since it is after market hours now, try this scan when trading resumes on Monday

Code:
# High Low Previous Day Breakout Scan
# tomsk
# 12.7.2019

def CurrentDay = GetDay() == GetLastDay();
def previousHigh = if CurrentDay then high(period = AggregationPeriod.Day)[1] else Double.NaN;
def previousLow = if CurrentDay then low(period = AggregationPeriod.Day)[1] else Double.NaN;

plot scan = close crosses above previousHigh;
# End High Low Previous Day Breakout Scan

If you wish to scan for stocks that are breaking down from yesterday's low, then replace the scan statement with the following in the code above

Code:
plot scan = close crosses below previousLow;
 
I need help with a pretty simple script? I want to plot the previous OHLC price that draws a line across the chart (end to end) - with multiple time aggregation periods. Such that I can overlay (for instance) the 4hr previous closing price (drawn as a line) and overlay it on the 3min time frame. Also want to be able to turn on/off which of the price types (of the previous OHLC) I want to use at any time. I appreciate the help

Code:
# RH_PreviousDayHighLowRangeSTUDY
# Code by rhouser
# copyright 4/10/2013 All rights reserved.
# Permission granted to use, copy, modify to members of the Yahoo
TOS_thinkscript Group

#hint:<b>RH_PreviousDayHighLowRangeSTUDY</b>\nShows the high/low range from
the previous day, works on all timeframes from daily through intraday.

declare upper;

def day = GetDay();
def lastDay = GetLastDay();
def year = GetYear();
def lastYear = GetLastYear();
def yyyymmdd = GetYYYYMMDD();

def lastDate = HighestAll( if day == lastDay and year == lastYear
then yyyymmdd else Double.NaN );
def currentDate = if yyyymmdd < lastDate then yyyymmdd else lastDate;
def previousDay = if CountTradingDays( currentDate, lastDate ) == 2 then
yes else no;

plot YesterdaysHigh = HighestAll( if previousDay then high( period = "DAY" )
else Double.NaN );
plot YesterdaysLow = HighestAll( if previousDay then low( period = "DAY" )
else Double.NaN );

#================[ Look & Feel]==============
YesterdaysHigh.SetDefaultColor( Color.UPTICK );
YesterdaysHigh.SetLineWeight( 2 );
YesterdaysHigh.HideBubble();

YesterdaysLow.SetDefaultColor( Color.DOWNTICK );
YesterdaysLow.SetLineWeight( 2 );
YesterdaysLow.HideBubble();
#### EOC ####
 
@Utajiri give this a try, put this together based off of another previous ohlc indicator.

Although it doesn't plot across the entire chart, its a good starting point for what you want.

https://tos.mx/Kg3P3Du

Code:
#MTF Prev OHLC


def NA = Double.NaN;
input Aggregation1 = AggregationPeriod.DAY;
input Aggregation2 = AggregationPeriod.HOUR;
input Aggregation3 = AggregationPeriod.FIFTEEN_MIN;

input ShowAgg1O = yes;
input ShowAgg1H = yes;
input ShowAgg1L = yes;
input ShowAgg1C = yes;

input ShowAgg2O = no;
input ShowAgg2H = no;
input ShowAgg2L = no;
input ShowAgg2C = no;

input ShowAgg3O = no;
input ShowAgg3H = no;
input ShowAgg3L = no;
input ShowAgg3C = no;

input length1 = 1;
input length2 = 1;
input length3 = 1;

input displace1 = -1;
input displace2 = -1;
input displace3 = -1;

input showOnlyLastPeriod1 = no;
input showOnlyLastPeriod2 = no;
input showOnlyLastPeriod3 = no;

plot Agg1O;
plot Agg1H;
plot Agg1L;
plot Agg1C;

plot Agg2O;
plot Agg2H;
plot Agg2L;
plot Agg2C;

plot Agg3O;
plot Agg3H;
plot Agg3L;
plot Agg3C;

#Agg1
if showOnlyLastPeriod1 and !IsNaN(open(period = Aggregation1)[-1]) { Agg1O = Double.NaN; }
else { Agg1O = Highest(open(period = Aggregation1)[-displace1], length1); }

if showOnlyLastPeriod1 and !IsNaN(high(period = Aggregation1)[-1]) { Agg1H = Double.NaN; }
else { Agg1H = Highest(high(period = Aggregation1)[-displace1], length1); }

if showOnlyLastPeriod1 and !IsNaN(low(period = Aggregation1)[-1]) { Agg1L = Double.NaN; }
else { Agg1L = Highest(low(period = Aggregation1)[-displace1], length1); }

if showOnlyLastPeriod1 and !IsNaN(close(period = Aggregation1)[-1]) { Agg1C = Double.NaN; }
else { Agg1C = Highest(close(period = Aggregation1)[-displace1], length1); }

#Agg2
if showOnlyLastPeriod2 and !IsNaN(open(period = Aggregation2)[-1]) { Agg2O = Double.NaN; }
else { Agg2O = Highest(open(period = Aggregation2)[-displace2], length2); }

if showOnlyLastPeriod2 and !IsNaN(high(period = Aggregation2)[-1]) { Agg2H = Double.NaN; }
else { Agg2H = Highest(high(period = Aggregation2)[-displace2], length2); }

if showOnlyLastPeriod2 and !IsNaN(low(period = Aggregation2)[-1]) { Agg2L = Double.NaN; }
else { Agg2L = Highest(low(period = Aggregation2)[-displace2], length2); }

if showOnlyLastPeriod2 and !IsNaN(close(period = Aggregation2)[-1]) { Agg2C = Double.NaN; }
else { Agg2C = Highest(close(period = Aggregation2)[-displace2], length2); }

#Agg3

if showOnlyLastPeriod3 and !IsNaN(open(period = Aggregation3)[-1]) { Agg3O = Double.NaN; }
else { Agg3O = Highest(open(period = Aggregation3)[-displace3], length3); }

if showOnlyLastPeriod3 and !IsNaN(high(period = Aggregation3)[-1]) { Agg3H = Double.NaN; }
else { Agg3H = Highest(high(period = Aggregation3)[-displace3], length3); }

if showOnlyLastPeriod3 and !IsNaN(low(period = Aggregation3)[-1]) { Agg3L = Double.NaN; }
else { Agg3L = Highest(low(period = Aggregation3)[-displace3], length3); }

if showOnlyLastPeriod3 and !IsNaN(close(period = Aggregation3)[-1]) { Agg3C = Double.NaN; }
else { Agg3C = Highest(close(period = Aggregation3)[-displace3], length3); }


Agg1O.SetHiding(GetAggregationPeriod() >= Aggregation1 or !ShowAgg1O);
Agg1H.SetHiding(GetAggregationPeriod() >= Aggregation1 or !ShowAgg1H);
Agg1L.SetHiding(GetAggregationPeriod() >= Aggregation1 or !ShowAgg1L);
Agg1C.SetHiding(GetAggregationPeriod() >= Aggregation1 or !ShowAgg1C);

Agg2O.SetHiding(GetAggregationPeriod() >= Aggregation2 or !ShowAgg2O);
Agg2H.SetHiding(GetAggregationPeriod() >= Aggregation2 or !ShowAgg2H);
Agg2L.SetHiding(GetAggregationPeriod() >= Aggregation2 or !ShowAgg2L);
Agg2C.SetHiding(GetAggregationPeriod() >= Aggregation2 or !ShowAgg2C);

Agg3O.SetHiding(GetAggregationPeriod() >= Aggregation3 or !ShowAgg3O);
Agg3H.SetHiding(GetAggregationPeriod() >= Aggregation3 or !ShowAgg3H);
Agg3L.SetHiding(GetAggregationPeriod() >= Aggregation3 or !ShowAgg3L);
Agg3C.SetHiding(GetAggregationPeriod() >= Aggregation3 or !ShowAgg3C);

#Aggregation1 Format
Agg1O.SetPaintingStrategy(PaintingStrategy.HORIZONTAL);
Agg1O.SetDefaultColor(Color.WHITE);
Agg1H.SetPaintingStrategy(PaintingStrategy.HORIZONTAL);
Agg1H.SetDefaultColor(Color.GREEN);
Agg1L.SetPaintingStrategy(PaintingStrategy.HORIZONTAL);
Agg1L.SetDefaultColor(Color.RED);
Agg1C.SetPaintingStrategy(PaintingStrategy.HORIZONTAL);
Agg1C.SetDefaultColor(Color.YELLOW);

#Aggregation2 Format
Agg2O.SetPaintingStrategy(PaintingStrategy.HORIZONTAL);
Agg2O.SetDefaultColor(Color.WHITE);
Agg2H.SetPaintingStrategy(PaintingStrategy.HORIZONTAL);
Agg2H.SetDefaultColor(Color.GREEN);
Agg2L.SetPaintingStrategy(PaintingStrategy.HORIZONTAL);
Agg2L.SetDefaultColor(Color.RED);
Agg2C.SetPaintingStrategy(PaintingStrategy.HORIZONTAL);
Agg2C.SetDefaultColor(Color.YELLOW);

#Aggregation3 Format
Agg3O.SetPaintingStrategy(PaintingStrategy.HORIZONTAL);
Agg3O.SetDefaultColor(Color.WHITE);
Agg3H.SetPaintingStrategy(PaintingStrategy.HORIZONTAL);
Agg3H.SetDefaultColor(Color.GREEN);
Agg3L.SetPaintingStrategy(PaintingStrategy.HORIZONTAL);
Agg3L.SetDefaultColor(Color.RED);
Agg3C.SetPaintingStrategy(PaintingStrategy.HORIZONTAL);
Agg3C.SetDefaultColor(Color.YELLOW);
 
Last edited:
The way I use the Daily High/Low that is in TOS. I put it on a 5Min chart, but switch the high/low to a 30min High/Low or an Hour High low on my 5min chart, as I want to know when the 5 min breaks above the 30 or Hour and Not have to watch the 30 min or Hour chart. I dont believe that this script version has selectable time frame that would be very Nice also alerts on it would be great. Is that Possible? I also use this on the Daily chart and have a weekly high low breakout on it, for Longer term momentum moves.
 
Hello, I need some help to improvise the Daily high low indicator. I mainly used for scalping in 1min time-frame chart without pre-market session. I converted into TOS strategy for testing purposes but there is a problem with it. It creates the first order right away after opening candle. For example, If I set "marketOpen" time as "931" or 9:31am, It creates order at next candle or 9:32 according to the 9:31 candle. If 9:31 candle is red than it creates a short position if it's green than it creates long position. I tried to fix it by changing "marketOpen" time, let's say "940", same issue, order at 9:32 candle and 9:41 candle.

So my goal is to disable creating order at the second candle depending on "marketOpen" time OR in another word, ignore first candle and previous candle before "marketOpen" time. for instance, if my "marketOpen" time is 1000 or 10 am then ignore all candles from 9:30 am till 10 am.

mI6PJF1.png

gslL5sL.png

XtlpAdi.png


Link for strategy
https://tos.mx/ltZhUKr
Link for Workspace w/ stop loss added
https://tos.mx/qbPjsdD

Code:
input marketOpen = 931;
input marketClose = 1600;
input intraDaySpan = {Default "SameDay" , "OverNight"};
input numberOfDays = 1;
input numberOfYears = 0;

def okToPlot = GetLastDay() - numberOfDays <= GetDay() and GetLastYear() - numberOfYears <= GetYear() ;

def OpenCounter =  SecondsFromTime(marketOpen);
def CloseCounter = SecondsTillTime(marketClose);

def MarketHours = if OpenCounter >= 0 and CloseCounter >= 0 then 1 else 0;

def beforeMidnight = OpenCounter >= 0 and CloseCounter <= 0;
def afterMidnight = OpenCounter <= 0 and CloseCounter >= 0 ;

def Today ;
def hideChartBubbles ;
rec DailyHigh ;
rec DailyLow ;

switch (intraDaySpan) {
    case "SameDay":
    Today = if GetDay() != GetDay()[1] then 1 else 0;
    DailyHigh = if MarketHours then if high > DailyHigh[1] then high else DailyHigh[1] else high;
    DailyLow = if Today then low else if MarketHours then if low < DailyLow[1] then low else DailyLow[1] else low;
    hideChartBubbles = MarketHours;
    case "OverNight":
    Today = 0;
    DailyHigh = if beforeMidnight or afterMidnight then if high > DailyHigh[1] then high else DailyHigh[1] else  high;
    DailyLow = if beforeMidnight or afterMidnight then if low < DailyLow[1] then low else DailyLow[1] else low;
    hideChartBubbles = beforeMidnight or afterMidnight;
};

plot TodaysHigh = if okToPlot and hideChartBubbles  then DailyHigh else Double.NaN;
plot TodaysLow = if okToPlot and hideChartBubbles then DailyLow else Double.NaN;
TodaysHigh.SetDefaultColor(Color.GREEN);
TodaysLow.SetDefaultColor(Color.RED);


Def high= DailyHigh > DailyHigh[1] ;
Alert(high,"New High", Alert.BAR, Sound.Bell);
AddOrder(OrderType.BUY_AUTO, high , tickColor = GetColor(1), arrowColor = GetColor(1), name = ".");


Def low= DailyLow < DailyLow[1] ;
Alert(low, "New Low", Alert.BAR, Sound.Bell);
AddOrder(OrderType.Sell_AUTO, low , tickColor = GetColor(1), arrowColor = GetColor(1), name = ".");
 
Last edited:
Needing help setting up my scanner. I've been trying to figure out a way to scan for stocks touching previous day High/Low. All the other criteria I can figure out but this alludes me. Help!
 
@divinci01 Since you just want to plot and scan for the previous day's high and low, here is the script for that (taken from post #1)

Code:
# 5 min opening range
# Robert Payne
#Plot opening range high / low
input OpenRangeMinutes = 5;
input MarketOpenTime = 0930;
input ShowTodayOnly = yes;

def Today = if GetDay() == GetLastDay() then 1 else 0;

#Plot yesterday's high / low
plot Yhigh = if ShowTodayOnly and !Today then Double.NaN else high(period = "day" )[1];
plot Ylow = if ShowTodayOnly and !Today then Double.NaN else low(period = "day" )[1];

Yhigh.SetPaintingStrategy(PaintingStrategy.HORIZONTAL);
Yhigh.SetDefaultColor(Color.UPTICK);
Yhigh.SetLineWeight(2);
Ylow.SetPaintingStrategy(PaintingStrategy.HORIZONTAL);
Ylow.SetDefaultColor(Color.DOWNTICK);
Ylow.SetLineWeight(2);

Add it as a separate indicator and then setup your scanner to something like this:

fX5oM95.png
 
BenTen,

Thanks for posting this study. Would the scanner setup as shown result in the chart shown in post #1? Should 2 conditions be set up for "crosses below" and "crosses above"? I'm unclear on the condition set up.
 
@givemefood You should set up two separate scanners. One for "crosses below" and the other one for "crosses above"
 
Hello! Is it possible to have Fibonacci configuration for Yesterday high and low which can be measure down and up?
 
Hello....new here......is there a way to have a a line drawn that represents the previous days mid point (50%) between open and close (open+close/2)? Just the body....not the high and low.

Thanks,

Slap
 
@Slappytheking Try this:

Code:
#Plot yesterday's mid range

def Yhigh = high(period = "day" )[1];
def Ylow = low(period = "day" )[1];
plot mid = (Yhigh + Ylow) / 2;
 
Can it be this and get what I want?

#Plot yesterday's mid range

def Yhigh = open(period = "day" )[1];
def Ylow = close(period = "day" )[1];
plot mid = (Yhigh + Ylow) / 2;
 
@Slappytheking Sure, that works too.

I didn't know if you wanted to get the range from the previous day high and low or the previous day's high and open. It seems like you modified it to the previous day's high and open.
 

Join useThinkScript to post your question to a community of 21,000+ developers and traders.

Not the exact question you're looking for?

Start a new thread and receive assistance from our community.

87k+ Posts
256 Online
Create Post

The Market Trading Game Changer

Join 2,500+ subscribers inside the useThinkScript VIP Membership Club
  • Exclusive indicators
  • Proven strategies & setups
  • Private Discord community
  • ‘Buy The Dip’ signal alerts
  • Exclusive members-only content
  • Add-ons and resources
  • 1 full year of unlimited support

Frequently Asked Questions

What is useThinkScript?

useThinkScript is the #1 community of stock market investors using indicators and other tools to power their trading strategies. Traders of all skill levels use our forums to learn about scripting and indicators, help each other, and discover new ways to gain an edge in the markets.

How do I get started?

We get it. Our forum can be intimidating, if not overwhelming. With thousands of topics, tens of thousands of posts, our community has created an incredibly deep knowledge base for stock traders. No one can ever exhaust every resource provided on our site.

If you are new, or just looking for guidance, here are some helpful links to get you started.

What are the benefits of VIP Membership?
VIP members get exclusive access to these proven and tested premium indicators: Buy the Dip, Advanced Market Moves 2.0, Take Profit, and Volatility Trading Range. In addition, VIP members get access to over 50 VIP-only custom indicators, add-ons, and strategies, private VIP-only forums, private Discord channel to discuss trades and strategies in real-time, customer support, trade alerts, and much more. Learn all about VIP membership here.
How can I access the premium indicators?
To access the premium indicators, which are plug and play ready, sign up for VIP membership here.
Back
Top