KevCassTrader
New member
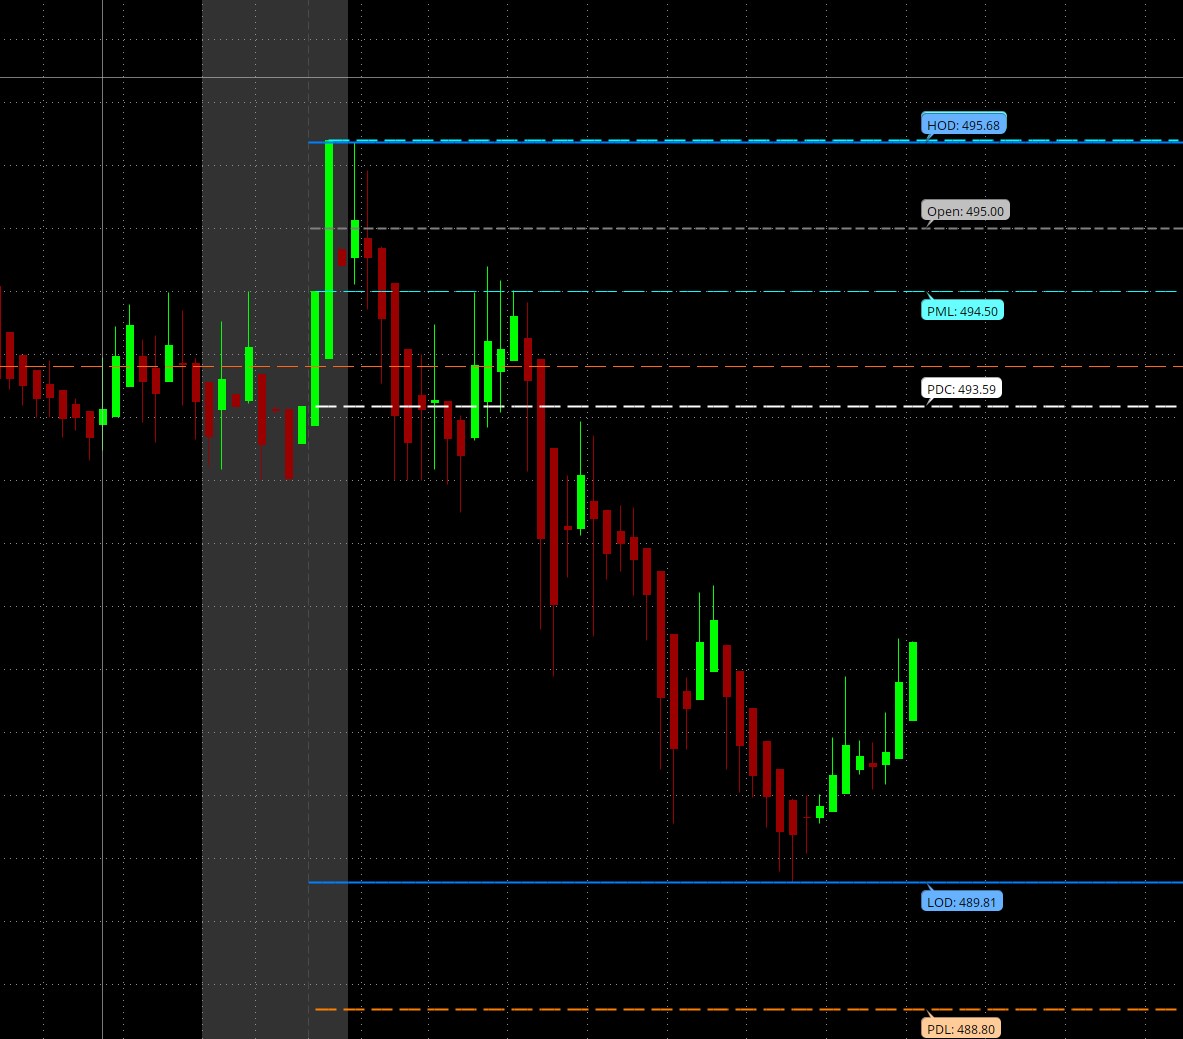
Hi, I'm using the code that Welkin kindly published within this chain for a study in ThinkorSwim. I love having this information readily available, however, I would benefit for a small tweak that I hoped someone could help me with. In addition to displaying chart bubbles, I'd like to display the same information as labels on the top of my chart. Fields shown below. Thanks in advance for your help! cheers
CODE
#[email protected]
def NA = Double.NaN;

input agg = AggregationPeriod.DAY;
input showOnlyLastPeriod = no;
input showBubbles = yes;
input showValuesInBubbles = yes;
input spaceBetween = 1;
plot currentOpen;
plot prevDayClose;
plot prevDayLow;
plot prevDayHigh;
def exp = IsNaN(close[spaceBetween]);

currentOpen = if exp then open("period"=agg) else NA;
prevDayClose = if exp then close("period"=agg)[1] else NA;
prevDayLow = if exp then low("period"=agg)[1] else NA;
prevDayHigh = if exp then high("period"=agg)[1] else NA;

AddChartBubble(showBubbles, if IsNaN(currentOpen[1]) and !IsNaN(currentOpen) then currentOpen else NA, if showValuesInBubbles then "CurrOpen $"+currentOpen else "CurrOpen", Color.WHITE, yes);
AddChartBubble(showBubbles, if IsNaN(prevDayClose[1]) and !IsNaN(prevDayClose) then prevDayClose else NA, if showValuesInBubbles then "PrevClose $"+prevDayClose else "PrevClose", Color.YELLOW, yes);
AddChartBubble(showBubbles, if IsNaN(prevDayLow[1]) and !IsNaN(prevDayLow) then prevDayLow else NA, if showValuesInBubbles then "PrevLow $"+prevDayLow else "PrevLow", Color.RED, yes);
AddChartBubble(showBubbles, if IsNaN(prevDayHigh[1]) and !IsNaN(prevDayHigh) then prevDayHigh else NA, if showValuesInBubbles then "PrevHigh $"+prevDayHigh else "PrevHigh", Color.GREEN, yes);

currentOpen.SetDefaultColor(Color.WHITE);
prevDayLow.SetDefaultColor(Color.RED);
prevDayHigh.SetDefaultColor(Color.GREEN);
prevDayClose.SetDefaultColor(Color.YELLOW);
currentOpen.SetPaintingStrategy(PaintingStrategy.HORIZONTAL);
prevDayLow.SetPaintingStrategy(PaintingStrategy.HORIZONTAL);
prevDayHigh.SetPaintingStrategy(PaintingStrategy.HORIZONTAL);
prevDayClose.SetPaintingStrategy(PaintingStrategy.HORIZONTAL);
- CurrOpen $
- PrevClose $
- PrevLow $
- PrevHigh $
CODE
#[email protected]
def NA = Double.NaN;
input agg = AggregationPeriod.DAY;
input showOnlyLastPeriod = no;
input showBubbles = yes;
input showValuesInBubbles = yes;
input spaceBetween = 1;
plot currentOpen;
plot prevDayClose;
plot prevDayLow;
plot prevDayHigh;
def exp = IsNaN(close[spaceBetween]);
currentOpen = if exp then open("period"=agg) else NA;
prevDayClose = if exp then close("period"=agg)[1] else NA;
prevDayLow = if exp then low("period"=agg)[1] else NA;
prevDayHigh = if exp then high("period"=agg)[1] else NA;
AddChartBubble(showBubbles, if IsNaN(currentOpen[1]) and !IsNaN(currentOpen) then currentOpen else NA, if showValuesInBubbles then "CurrOpen $"+currentOpen else "CurrOpen", Color.WHITE, yes);
AddChartBubble(showBubbles, if IsNaN(prevDayClose[1]) and !IsNaN(prevDayClose) then prevDayClose else NA, if showValuesInBubbles then "PrevClose $"+prevDayClose else "PrevClose", Color.YELLOW, yes);
AddChartBubble(showBubbles, if IsNaN(prevDayLow[1]) and !IsNaN(prevDayLow) then prevDayLow else NA, if showValuesInBubbles then "PrevLow $"+prevDayLow else "PrevLow", Color.RED, yes);
AddChartBubble(showBubbles, if IsNaN(prevDayHigh[1]) and !IsNaN(prevDayHigh) then prevDayHigh else NA, if showValuesInBubbles then "PrevHigh $"+prevDayHigh else "PrevHigh", Color.GREEN, yes);
currentOpen.SetDefaultColor(Color.WHITE);
prevDayLow.SetDefaultColor(Color.RED);
prevDayHigh.SetDefaultColor(Color.GREEN);
prevDayClose.SetDefaultColor(Color.YELLOW);
currentOpen.SetPaintingStrategy(PaintingStrategy.HORIZONTAL);
prevDayLow.SetPaintingStrategy(PaintingStrategy.HORIZONTAL);
prevDayHigh.SetPaintingStrategy(PaintingStrategy.HORIZONTAL);
prevDayClose.SetPaintingStrategy(PaintingStrategy.HORIZONTAL);

