Multi-Time Frame True Momentum Oscillator (MTF) for ThinkorSwim

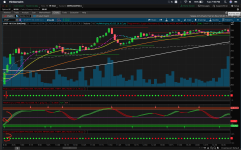
@HighBredCloud MTF_TMO_STSW for your review:

a.png


Code:
# filename: MR__EZ_MTF_TMO_STSW_
# idea source: vvcv and HighBredCloud
# mashup: netarchitech

#STSW = Schaff Trend Line and Schaff Wave Line
#Schaff Trend Line = Used for quick up/down trend declaration
#Schaff Wave Line = Trade Wave in the direction of trend as
#declared by Trend Line.
#Schaff Wave Line can be used alone to enter trend
#declared by the MACD.
#Schaff Wave can be used with the EMA for signals

declare lower;

input fastLengthTrend = 48;
input slowLengthTrend = 104;
input KPeriodTrend = 36;
input DPeriodTrend = 8;
input averageTypeTrend = AverageType.EXPONENTIAL;
input fastLengthWave = 12;
input slowLengthWave = 26;
input KPeriodWave = 9;
input DPeriodWave = 2;
input over_bought = 75;
input over_sold = 25;
input averageTypeWave = AverageType.EXPONENTIAL;

def macdTrend = MovingAverage(averageTypeTrend, close, fastLengthTrend) - MovingAverage(averageTypeTrend, close, slowLengthTrend);
def macdWave = MovingAverage(averageTypeWave, close, fastLengthWave) - MovingAverage(averageTypeWave, close, slowLengthWave);
def fastK1Trend = FastKCustom(macdTrend, KPeriodTrend);
def fastK1Wave = FastKCustom(macdWave, KPeriodWave);
def fastD1Trend = MovingAverage(averageTypeTrend, fastK1Trend, DPeriodTrend);
def fastD1Wave = MovingAverage(averageTypeWave, fastK1Wave, DPeriodWave);
def fastK2Trend = FastKCustom(fastD1Trend, KPeriodTrend);
def fastK2Wave = FastKCustom(fastD1Wave, KPeriodWave);
plot STCTrend = MovingAverage(averageTypeTrend, fastK2Trend, DPeriodTrend);
plot STCWave = MovingAverage(averageTypeWave, fastK2Wave, DPeriodWave);
plot OverBought = over_bought;
plot OverSold = over_sold;

STCTrend.SetDefaultColor(GetColor(8));
STCWave.SetDefaultColor(GetColor(8));
OverBought.SetDefaultColor(GetColor(7));
OverSold.SetDefaultColor(GetColor(7));

plot Fifty_Line = 50;
Fifty_Line.SetDefaultColor(GetColor(8));
Fifty_Line.HideTitle();
Fifty_Line.SetStyle(Curve.SHORT_DASH);

STCTrend.DefineColor("Up", GetColor(1));
STCTrend.DefineColor("Down", GetColor(0));
STCTrend.AssignValueColor(if STCTrend > STCTrend[1] then STCTrend.Color("Up") else STCTrend.Color("Down"));
STCWave.DefineColor("Up", GetColor(1));
STCWave.DefineColor("Down", GetColor(0));
STCWave.AssignValueColor(if STCWave > STCWave[1] then STCWave.Color("Up") else STCWave.Color("Down"));

#input lengthWave = 10;
#plot AvgExpWave = ExpAverage(STCWave, lengthWave);
#AvgExpWave.SetDefaultColor(GetColor(1));

input MinValue = 0; 
input MaxValue = 100;

plot PlotToNormalize1 = STCTrend ;
PlotToNormalize1.SetHiding(1);

plot NormalizedPlot1 =  (MaxValue - MinValue) *  (PlotToNormalize1 - LowestAll(PlotToNormalize1)) / (HighestAll(PlotToNormalize1) - LowestAll(PlotToNormalize1)) + MinValue;
NormalizedPlot1.SetPaintingStrategy(PaintingStrategy.LINE);
NormalizedPlot1.DefineColor("Up", GetColor(1));
NormalizedPlot1.DefineColor("Down", GetColor(0));
NormalizedPlot1.AssignValueColor(if NormalizedPlot1 > NormalizedPlot1[1] then NormalizedPlot1.Color("Up") else NormalizedPlot1.Color("Down"));
NormalizedPlot1.SetLineWeight(2);

plot PlotToNormalize2 = STCWave ;
PlotToNormalize2.SetHiding(1);

plot NormalizedPlot2 =  (MaxValue - MinValue) *  (PlotToNormalize2 - LowestAll(PlotToNormalize2)) / (HighestAll(PlotToNormalize2) - LowestAll(PlotToNormalize2)) + MinValue;
NormalizedPlot2.SetPaintingStrategy(PaintingStrategy.LINE);
NormalizedPlot2.DefineColor("Up", GetColor(1));
NormalizedPlot2.DefineColor("Down", GetColor(0));
NormalizedPlot2.AssignValueColor(if NormalizedPlot2 > NormalizedPlot2[1] then NormalizedPlot2.Color("Up") else NormalizedPlot2.Color("Down"));
NormalizedPlot2.SetLineWeight(2);

input length = 10; # default -> 14;
def calcLength = 5;
def smoothLength = 3;
input agg = AggregationPeriod.FIVE_MIN;
 
def o = open(period = agg);
def c = close(period = agg);
def data = fold i = 0 to length
           with s
           do s + (if c > getValue(o, i)
                   then 1
                   else if c < getValue(o, i)
                        then - 1
                        else 0);
def EMA5 = ExpAverage(data, calcLength);
plot Main = ExpAverage(EMA5, smoothLength);
plot Signal = ExpAverage(Main, smoothLength);
     Main.AssignValueColor(if Main > Signal
                            then color.GREEN
                            else color.RED);
     Signal.AssignValueColor(if Main > Signal
                            then color.GREEN
                            else color.RED);
     Main.SetLineWeight(3);
     Signal.SetLineWeight(3);
     Signal.HideBubble();
     Signal.HideTitle();
Main.hide();
Signal.hide();

plot PlotToNormalize3 = Main;
PlotToNormalize3.SetHiding(1);

plot NormalizedPlot3 =  (MaxValue - MinValue) *  (PlotToNormalize3 - LowestAll(PlotToNormalize3)) / (HighestAll(PlotToNormalize3) - LowestAll(PlotToNormalize3)) + MinValue;

plot PlotToNormalize4 = Signal ;
PlotToNormalize4.SetHiding(1);

plot NormalizedPlot4 =  (MaxValue - MinValue) *  (PlotToNormalize4 - LowestAll(PlotToNormalize4)) / (HighestAll(PlotToNormalize4) - LowestAll(PlotToNormalize4)) + MinValue;

NormalizedPlot3.SetPaintingStrategy(PaintingStrategy.LINE);
NormalizedPlot3.SetLineWeight(2);
NormalizedPlot3.AssignValueColor(if NormalizedPlot3 > NormalizedPlot4
                                 then color.GREEN
                                 else color.RED);

NormalizedPlot4.SetPaintingStrategy(PaintingStrategy.LINE);
NormalizedPlot4.SetLineWeight(2);
NormalizedPlot4.AssignValueColor(if NormalizedPlot3 > NormalizedPlot4
                                 then color.GREEN
                                 else color.RED);
 
input length2 = 10; # default -> 14;
def calcLength2 = 5;
def smoothLength2 = 3;
input agg2 = AggregationPeriod.FIFTEEN_MIN;
 
def o2 = open(period = agg2);
def c2 = close(period = agg2);
def data2 = fold i2 = 0 to length2
           with s2
           do s2 + (if c2 > getValue(o2, i2)
                   then 1
                   else if c2 < getValue(o2, i2)
                        then - 1
                        else 0);
def EMA52 = ExpAverage(data2, calcLength2);
plot Main2 = ExpAverage(EMA52, smoothLength2);
plot Signal2 = ExpAverage(Main2, smoothLength2);
     Main2.AssignValueColor(if Main2 > Signal2
                            then color.UPTICK
                            else color.DOWNTICK);
     Signal2.AssignValueColor(if Main2 > Signal2
                            then color.UPTICK
                            else color.DOWNTICK);
     Signal2.HideBubble();
     Signal2.HideTitle();
Main2.hide();
Signal2.hide();

plot PlotToNormalize5 = Main2;
PlotToNormalize5.SetHiding(1);

plot NormalizedPlot5 =  (MaxValue - MinValue) *  (PlotToNormalize5 - LowestAll(PlotToNormalize5)) / (HighestAll(PlotToNormalize5) - LowestAll(PlotToNormalize5)) + MinValue;

plot PlotToNormalize6 = Signal2;
PlotToNormalize6.SetHiding(1);

plot NormalizedPlot6 =  (MaxValue - MinValue) *  (PlotToNormalize6 - LowestAll(PlotToNormalize6)) / (HighestAll(PlotToNormalize6) - LowestAll(PlotToNormalize6)) + MinValue;

NormalizedPlot5.SetPaintingStrategy(PaintingStrategy.LINE);
NormalizedPlot5.SetLineWeight(2);
NormalizedPlot5.AssignValueColor(if NormalizedPlot5 > NormalizedPlot6
                                 then color.UPTICK
                                 else color.DOWNTICK);

NormalizedPlot6.SetPaintingStrategy(PaintingStrategy.LINE);
NormalizedPlot6.SetLineWeight(2);
NormalizedPlot6.AssignValueColor(if NormalizedPlot5 > NormalizedPlot6
                                 then color.UPTICK
                                 else color.DOWNTICK);

addCloud(NormalizedPlot3, NormalizedPlot4, color.GREEN, color.RED);
addCloud(NormalizedPlot5, NormalizedPlot6, color.UPTICK, color.DOWNTICK);

One caveat: I couldn't get the FisherTransform to work :(
 
@netarchitech well that was a surprise to see this...but I was just saying what you thought of those two indicators working together side by side...LOL...I didn't think you'd actually merge them. Personally I think the TMO MTF you made is already great all by its self. The last thing I want is to muddy up a perfectly functional indicator...haha. I was just posting this new indicator here in case other were interested to see what the TMO MTF works great with...

The only thing that I would like to see if you could change would be the colors on the 3rd TMO length to the ones I previously stated. How did your testing of the TMO MTF go?
 
Last edited:
@HighBredCloud I made the color corrections to the 3rd length of the MTF_TMO_Fisher_3 for your review :)

a.png


Code:
# filename: MR__EZ_MTF_TMO_Fisher_3_
# source: https://usethinkscript.com/threads/tmo-with-higher-agg_mobius-tsl.91/
# idea source: HighBredCloud
# mashup: netarchitech

# V01.01.11.22.2019

# TMO ((T)rue (M)omentum (O)scillator) With Higher Aggregation
# Mobius
# V01.05.2018
#hint: TMO calculates momentum using the DELTA of price. Giving a much better picture of trend, trend reversals and divergence than momentum oscillators using price.

declare lower;

input length = 10; # default -> 14;
def calcLength = 5;
def smoothLength = 3;
input agg = AggregationPeriod.FIVE_MIN;
 
def o = open(period = agg);
def c = close(period = agg);
def data = fold i = 0 to length
           with s
           do s + (if c > getValue(o, i)
                   then 1
                   else if c < getValue(o, i)
                        then - 1
                        else 0);
def EMA5 = ExpAverage(data, calcLength);
plot Main = ExpAverage(EMA5, smoothLength);
plot Signal = ExpAverage(Main, smoothLength);
     Main.AssignValueColor(if Main > Signal
                            then color.GREEN
                            else color.RED);
     Signal.AssignValueColor(if Main > Signal
                            then color.GREEN
                            else color.RED);
     Main.SetLineWeight(3);
     Signal.SetLineWeight(3);
     Signal.HideBubble();
     Signal.HideTitle();


# JQ_FisherTransform_wLabels v02
# assistance provided by AlphaInvestor, amalia, randyr and nube

# v02 9.23.2018 JQ added arrows

input Fisherprice = hl2;
input FisherLength = 10;
input TriggerLineOffset = 1; # Ehler's value of choice is 1
input TriggerLine_Color_Choice = {"magenta", "cyan", "pink", default "gray", "Mustard", "red", "green", "dark_gray", "Pale Yellow", "white"};
input deBug = no;

def maxHigh = Highest(Fisherprice, FisherLength);
def minLow = Lowest(Fisherprice, FisherLength);
def range = maxHigh - minLow;
def value = if IsNaN(Fisherprice)
then Double.NaN
else if IsNaN(range)
then value[1]
else if range == 0
then 0
else 0.66 * ((Fisherprice - minLow) / range - 0.5) + 0.67 * value[1];
def truncValue = if value > 0.99 then 0.999 else if value < -0.99 then -0.999 else value;
def fish = 0.5 * (Log((1 + truncValue) / (1 - truncValue)) + fish[1]);
def FTOneBarBack = fish[TriggerLineOffset];
def FT = fish;

plot FisherBullCross = if FT crosses above FTOneBarBack then lowestall(Main) else Double.NaN;
FisherBullCross.SetPaintingStrategy(PaintingStrategy.ARROW_UP);
FisherBullCross.SetDefaultColor(Color.UPTICK);

plot FisherBearCross = if FT crosses below FTOneBarBack then highestall(Main) else Double.NaN;
FisherBearCross.SetPaintingStrategy(PaintingStrategy.ARROW_DOWN);
FisherBearCross.SetDefaultColor(Color.DOWNTICK);


input length2 = 10; # default -> 14;
def calcLength2 = 5;
def smoothLength2 = 3;
input agg2 = AggregationPeriod.FIFTEEN_MIN;
 
def o2 = open(period = agg2);
def c2 = close(period = agg2);
def data2 = fold i2 = 0 to length2
           with s2
           do s2 + (if c2 > getValue(o2, i2)
                   then 1
                   else if c2 < getValue(o2, i2)
                        then - 1
                        else 0);
def EMA52 = ExpAverage(data2, calcLength2);
plot Main2 = ExpAverage(EMA52, smoothLength2);
plot Signal2 = ExpAverage(Main2, smoothLength2);
     Main2.AssignValueColor(if Main2 > Signal2
                            then color.UPTICK
                            else color.DOWNTICK);
     Signal2.AssignValueColor(if Main2 > Signal2
                            then color.UPTICK
                            else color.DOWNTICK);
     Signal2.HideBubble();
     Signal2.HideTitle();

input length3 = 10; # default -> 14;
def calcLength3 = 5;
def smoothLength3 = 3;
input agg3 = AggregationPeriod.THIRTY_MIN;
 
def o3 = open(period = agg3);
def c3 = close(period = agg3);
def data3 = fold i3 = 0 to length3
           with s3
           do s3 + (if c3 > getValue(o3, i3)
                   then 1
                   else if c3 < getValue(o3, i3)
                        then - 1
                        else 0);
def EMA53 = ExpAverage(data3, calcLength3);
plot Main3 = ExpAverage(EMA53, smoothLength3);
plot Signal3 = ExpAverage(Main3, smoothLength3);
Main3.AssignValueColor(if Main3 > Signal3
                                then CreateColor(0, 255, 255) #Cyan
                                else CreateColor(255, 102, 0)); #Orange
     Signal3.AssignValueColor(if Main3 > Signal3
                                  then CreateColor(0, 255, 255) #Cyan
                                  else CreateColor(255, 102, 0)); #Orange
     Signal3.HideBubble();
     Signal3.HideTitle();

addCloud(Main, Signal, color.GREEN, color.RED);
addCloud(Main2, Signal2, color.UPTICK, color.DOWNTICK);
addCloud(Main3, Signal3, color.DARK_GREEN, color.DARK_RED);

plot ZeroLine = 0;
     ZeroLine.SetDefaultColor(Color.ORANGE);
     ZeroLine.HideBubble();
     ZeroLine.HideTitle();

plot ob = if isNaN(c) then double.nan else round(length * .7);
ob.SetDefaultColor(Color.dark_red);
ob.HideBubble();
ob.HideTitle();
plot os = if isNaN(c) then double.nan else -round(length * .7);
os.SetDefaultColor(Color.dark_green);
os.HideBubble();
os.HideTitle();
addCloud(ob, length, color.dark_red, color.dark_red, no);
addCloud(-length, os, color.dark_green, color.dark_green);
 
@HighBredCloud Let's not muddy the waters, when you have an RSILg question, please put it in an RSILg thread. This is in the TMO MTF Thread, anyone looking for an answer to the questions you have would probably never find it here. Thanks!
 
@tomsk I agree...I am sure @BenTen can move this once a game plan is figured out and progress is being made. I wanted to gauge interest first to see IF what I am asking for makes sense and if it is doable...I have a potential another add on to this TMO...I just don't know if the dots can be implemented into the actual TMO indicator or not. IF they can can something like this be done? Refer to the pic.

1. Top portion is a SuperTrend represented in dots...This type of a SuperTrend is also with aggregation so the end user can run a SuperTrend with the candles painted on and one with the dots and a separate aggregation. I already have a script for the SuperTrend that I want to use that comes with time aggregation that I can post.

2. Middle section is TMO with Fisher

3. Lower portion is secondary TMO in dots form with time aggregation...

klbsQEk.png
Would you kindly post the SuperTrendMTF code with dots; it looks helpful! Thanks!
 

Attachments

  • klbsQEk.png
    klbsQEk.png
    506 KB · Views: 98
@netarchitech I am testing the TMO on tick charts...but I cannot get the MTF to work because of the tick chart...,however, I can get the non MTF TMO work...Is there a way to make this work? For example...Primary instance of TMO is set to non MTF format...but second and third instance are in minute form to see how the tick stacks up against the time based charts? I tried to copy and past codes from your MTF version to a regular TMO version but something went wrong...I just don't know if my coding skills or possibly something that I am attempting can't be done...your thoughts?

EDIT: To clarify in what I am asking...Can I be looking at a tick chart and have the 2nd and 3rd instance of TMO be aggregated to a time based timeframe such as 5 min and 15 min...while the primary be a tick chart that I am looking at?
 
@tomsk so if you're viewing a tick chart...there is no way to view the data from a 5 or 15 min chart to display?

@HighBredCloud Tick charts are different from time based charts. Think of a tick chart as the number of transactions that must occur before the next tick bar is started. Hence the notion of secondary aggregation in tick charts in meaningless and won't work as you'd expect
 
@HighBredCloud Tick charts are different from time based charts. Think of a tick chart as the number of transactions that must occur before the next tick bar is started. Hence the notion of secondary aggregation in tick charts in meaningless and won't work as you'd expect
@tomsk I know the difference tick vs time based charts...What I don't know is IF somehow there's a way to show time based data on a tick chart as a secondary aggregation...because IF that could be done than its a whole different ball game being able to view time based data on a tick chart...
 
@tomsk I agree...I am sure @BenTen can move this once a game plan is figured out and progress is being made. I wanted to gauge interest first to see IF what I am asking for makes sense and if it is doable...I have a potential another add on to this TMO...I just don't know if the dots can be implemented into the actual TMO indicator or not. IF they can can something like this be done? Refer to the pic.

1. Top portion is a SuperTrend represented in dots...This type of a SuperTrend is also with aggregation so the end user can run a SuperTrend with the candles painted on and one with the dots and a separate aggregation. I already have a script for the SuperTrend that I want to use that comes with time aggregation that I can post.

2. Middle section is TMO with Fisher

3. Lower portion is secondary TMO in dots form with time aggregation...

klbsQEk.png

@HighBredCloud, can you please share the code for Super Trend MTF dots 1 and 3? Thanks :)
 

Attachments

  • klbsQEk.png
    klbsQEk.png
    506 KB · Views: 87
Hello all!!!
Could somebody let me know what is aggregation for and if I am trading futures 1 3 10 min, which version of TMO with Fisher is the best.
Thanks in aavance
 
I am trying to add Lazy Bear Ehlers Universal Oscillator dots from the CSA indicator made by @tomsk to the TMO MTF made by @netarchitech ...I have managed to successfully added FREMA dots but I can't get the oscillator to work...Can you guys help me out? Trying to use less indicators to save screen space...Thanks in advance. Here's how far I got with my coding skillz of basic copy and paste...


Code:
# filename: MR__EZ_TMO_MTF_Fisher_2Agg_
# source: https://usethinkscript.com/d/91-tmo-with-higher-agg-mobius-tsl

# TMO ((T)rue (M)omentum (O)scillator) With Higher Aggregation
# Mobius
# V01.05.2018
#hint: TMO calculates momentum using the DELTA of price. Giving a much better picture of trend, trend reversals and divergence than momentum oscillators using price.

# Global Defs

input DotSize = 3;
input n = 3;

def n1 = n + 1;
def PosUp = 1; # Positive and Up
def PosDn = 2; # Positive and Down
def NegDn = 3; # Negative and Down
def NegUp = 4; # Negative and Up

# Ehlers Universal Oscillator
# LazyBear
# initial port by netarchitech
# 2019.11.05
# source: https://www.tradingview.com/script/ieFYbVdC-Ehlers-Universal-Oscillator-LazyBear/

input bandedge = 20;
input EUOLengthMA = 9;

def whitenoise = (close - close[2]) / 2;
def a1 = ExpAverage(-1.414 * 3.14159 / bandedge);
def b1 = 2.0 * a1 * Cos(1.414 * 180 / bandedge);
def c2 = b1;
def c3 = -a1 * a1;
def c1 = 1 - c2 - c3;

def filt = c1 * (whitenoise + (whitenoise[1])) / 2 + c2 * (filt[1]) + c3 * (filt[2]);
def filt1 = if TotalSum(1) == 0 then 0
else if TotalSum(1) == 2 then c2 * filt1[1]
else if TotalSum(1) == 3 then c2 * filt1[1] + c3 * (filt1[2])
else filt;

def pk = if TotalSum(1) == 2 then .0000001
else if AbsValue(filt1) > pk[1] then AbsValue(filt1)
else 0.991 * pk[1];
def denom = if pk == 0 then -1 else pk;
def euo = if denom == -1 then euo[1] else filt1 / pk;
def euoMA = ExpAverage(euo, EUOLengthMA);
def Universal_Diff = euo;
def Universal_State = if Universal_Diff >= 0
then if Universal_Diff > Universal_Diff[1]
then PosUp
else PosDn
else if Universal_Diff < Universal_Diff[1]
then NegDn
else NegUp;
plot Universal_Dot = if IsNaN(close) then Double.NaN else 5;
Universal_Dot.SetPaintingStrategy(PaintingStrategy.POINTS);
Universal_Dot.SetLineWeight(DotSize);
Universal_Dot.DefineColor("Positive and Up", Color.GREEN);
Universal_Dot.DefineColor("Positive and Down", Color.DARK_GREEN);
Universal_Dot.DefineColor("Negative and Down", Color.RED);
Universal_Dot.DefineColor("Negative and Up", Color.DARK_RED);
Universal_Dot.AssignValueColor(if Universal_State == PosUp then Universal_Dot.Color("Positive and Up")
else if Universal_State == PosDn then Universal_Dot.Color("Positive and Down")
else if Universal_State == NegDn then Universal_Dot.Color("Negative and Down")
else Universal_Dot.Color("Negative and Up"));
AddChartBubble(!IsNaN(close[n1]) and IsNaN(close[n]), 5, "Univ Osc", Color.YELLOW, yes);
# End Code Ehlers Universal Oscillator

declare lower;

input length = 14; # default -> 14;
def calcLength = 5;
def smoothLength = 3;
input agg = AggregationPeriod.FIVE_MIN;

def o = open(period = agg);
def c = close(period = agg);
def data = fold i = 0 to length
           with s
           do s + (if c > GetValue(o, i)
                   then 1
                   else if c < GetValue(o, i)
                        then - 1
                        else 0);
def EMA5 = ExpAverage(data, calcLength);
plot Main = ExpAverage(EMA5, smoothLength);
plot Signal = ExpAverage(Main, smoothLength);
Main.AssignValueColor(if Main > Signal
                            then Color.GREEN
                            else Color.RED);
Signal.AssignValueColor(if Main > Signal
                            then Color.GREEN
                            else Color.RED);
Main.SetLineWeight(1);
Signal.SetLineWeight(1);
Signal.HideBubble();
Signal.HideTitle();


# JQ_FisherTransform_wLabels v02
# assistance provided by AlphaInvestor, amalia, randyr and nube

# v02 9.23.2018 JQ added arrows

input Fisherprice = hl2;
input FisherLength = 10;
input TriggerLineOffset = 1; # Ehler's value of choice is 1
input TriggerLine_Color_Choice = {"magenta", "cyan", "pink", default "gray", "Mustard", "red", "green", "dark_gray", "Pale Yellow", "white"};
input deBug = no;

def maxHigh = Highest(Fisherprice, FisherLength);
def minLow = Lowest(Fisherprice, FisherLength);
def range = maxHigh - minLow;
def value = if IsNaN(Fisherprice)
then Double.NaN
else if IsNaN(range)
then value[1]
else if range == 0
then 0
else 0.66 * ((Fisherprice - minLow) / range - 0.5) + 0.67 * value[1];
def truncValue = if value > 0.99 then 0.999 else if value < -0.99 then -0.999 else value;
def fish = 0.5 * (Log((1 + truncValue) / (1 - truncValue)) + fish[1]);
def FTOneBarBack = fish[TriggerLineOffset];
def FT = fish;

plot FisherBullCross = if FT crosses above FTOneBarBack then LowestAll(Main) else Double.NaN;
FisherBullCross.SetPaintingStrategy(PaintingStrategy.ARROW_UP);
FisherBullCross.SetDefaultColor(Color.UPTICK);

plot FisherBearCross = if FT crosses below FTOneBarBack then HighestAll(Main) else Double.NaN;
FisherBearCross.SetPaintingStrategy(PaintingStrategy.ARROW_DOWN);
FisherBearCross.SetDefaultColor(Color.DOWNTICK);


input length2 = 10; # default -> 14;
def calcLength2 = 5;
def smoothLength2 = 3;
input agg2 = AggregationPeriod.FIFTEEN_MIN;

def o2 = open(period = agg2);
def c2 = close(period = agg2);
def data2 = fold i2 = 0 to length2
           with s2
           do s2 + (if c2 > GetValue(o2, i2)
                   then 1
                   else if c2 < GetValue(o2, i2)
                        then - 1
                        else 0);
def EMA52 = ExpAverage(data2, calcLength2);
plot Main2 = ExpAverage(EMA52, smoothLength2);
plot Signal2 = ExpAverage(Main2, smoothLength2);
Main2.AssignValueColor(if Main2 > Signal2
                            then Color.UPTICK
                            else Color.DOWNTICK);
Signal2.AssignValueColor(if Main2 > Signal2
                            then Color.UPTICK
                            else Color.DOWNTICK);
Signal2.HideBubble();
Signal2.HideTitle();

AddCloud(Main, Signal, Color.GREEN, Color.RED);
AddCloud(Main2, Signal2, Color.UPTICK, Color.DOWNTICK);

plot ZeroLine = 0;
ZeroLine.SetDefaultColor(Color.YELLOW);
ZeroLine.HideBubble();
ZeroLine.HideTitle();

plot ob = if IsNaN(c) then Double.NaN else Round(length * .7);
ob.SetDefaultColor(Color.DARK_ORANGE);
ob.HideBubble();
ob.HideTitle();
plot os = if IsNaN(c) then Double.NaN else -Round(length * .7);
os.SetDefaultColor(Color.CYAN);
os.HideBubble();
os.HideTitle();
AddCloud(ob, length, Color.DARK_ORANGE, Color.DARK_ORANGE, no);
AddCloud(-length, os, Color.CYAN, Color.CYAN);

# Forward / Reverse EMA
# (c) 2017 John F. Ehlers
# Ported to TOS 07.16.2017
# Mobius

# Inputs:
input AA = .1;

# Vars:
def CC;
def RE1;
def RE2;
def RE3;
def RE4;
def RE5;
def RE6;
def RE7;
def RE8;
def EMA;

CC = if CC[1] == 0 then .9 else 1 – AA;
EMA = AA * close + CC * EMA[1];
RE1 = CC * EMA + EMA[1];
RE2 = Power(CC, 2) * RE1 + RE1[1];
RE3 = Power(CC, 4) * RE2 + RE2[1];
RE4 = Power(CC, 8) * RE3 + RE3[1];
RE5 = Power(CC, 16) * RE4 + RE4[1];
RE6 = Power(CC, 32) * RE5 + RE5[1];
RE7 = Power(CC, 64) * RE6 + RE6[1];
RE8 = Power(CC, 128) * RE7 + RE7[1];

def FREMA_Diff = EMA – AA * RE8;
def FREMA_State = if FREMA_Diff >= 0
then if FREMA_Diff > FREMA_Diff[1]
then PosUp
else PosDn
else if FREMA_Diff < FREMA_Diff[1]
then NegDn
else NegUp;
plot FREMA_Dot = if IsNaN(close) then Double.NaN else 3;
FREMA_Dot.SetPaintingStrategy(PaintingStrategy.POINTS);
FREMA_Dot.SetLineWeight(DotSize);
FREMA_Dot.DefineColor("Positive and Up", Color.GREEN);
FREMA_Dot.DefineColor("Positive and Down", Color.DARK_GREEN);
FREMA_Dot.DefineColor("Negative and Down", Color.RED);
FREMA_Dot.DefineColor("Negative and Up", Color.DARK_RED);
FREMA_Dot.AssignValueColor(if FREMA_State == PosUp then FREMA_Dot.Color("Positive and Up")
else if FREMA_State == PosDn then FREMA_Dot.Color("Positive and Down")
else if FREMA_State == NegDn then FREMA_Dot.Color("Negative and Down")
else FREMA_Dot.Color("Negative and Up"));
AddChartBubble(!IsNaN(close[n1]) and IsNaN(close[n]), 3, "FREMA", Color.YELLOW, yes);
# End Code Ehlers Forward / Reverse EMA
 
Below is a code for TMO with 2 MTF aggregations with MACD/FREMA dots for anyone that is interested.

Code:
# filename: MR__EZ_TMO_MTF_Fisher_2Agg_
# source: https://usethinkscript.com/d/91-tmo-with-higher-agg-mobius-tsl

# TMO ((T)rue (M)omentum (O)scillator) With Higher Aggregation
# Mobius
# V01.05.2018
#hint: TMO calculates momentum using the DELTA of price. Giving a much better picture of trend, trend reversals and divergence than momentum oscillators using price.

# Global Defs

input DotSize = 3;
input n = 3;

def n1 = n + 1;
def PosUp = 1; # Positive and Up
def PosDn = 2; # Positive and Down
def NegDn = 3; # Negative and Down
def NegUp = 4; # Negative and Up

# MACD with a more Normal Distribution
# Mobius
# V01.09.2015
#
# Plots a Gaussian distribution. If Normal Distribution is met, then at
# minimum, 68.2% of the close values should be inside a One Standard Deviation
# Envelope and 95.4% of the close values should be inside a 2 Standard
# Deviation Envelope.

input MACDFastLength = 12;
input MACDSlowLength = 26;
input MACDLength = 9;

# Four Pole Filter
script g{
input length = 4;
input betaDev = 2;
input price = OHLC4;
def c;
def w;
def beta;
def alpha;
def G;
c = price;
w = (2 * Double.Pi / length);
beta = (1 - Cos(w)) / (Power(1.414, 2.0 / betaDev) - 1 );
alpha = (-beta + Sqrt(beta * beta + 2 * beta));
G = Power(alpha, 4) * c +
4 * (1 – alpha) * G[1] – 6 * Power( 1 - alpha, 2 ) * G[2] +
4 * Power( 1 - alpha, 3 ) * G[3] - Power( 1 - alpha, 4 ) * G[4];
plot Line = G;
}
# Modified MACD
def MACD_Value = g(length = MACDFastLength) - g(length = MACDSlowLength);
def MACD_Avg = g(price = MACD_Value, length = MACDLength);
def MACD_Diff = MACD_Value - MACD_Avg;
def MACD_State = if MACD_Diff >= 0
then if MACD_Diff > MACD_Diff[1]
then PosUp
else PosDn
else if MACD_Diff < MACD_Diff[1]
then NegDn
else NegUp;
plot MACD_Dot = if IsNaN(close) then Double.NaN else 1;
MACD_Dot.SetPaintingStrategy(PaintingStrategy.POINTS);
MACD_Dot.SetLineWeight(DotSize);
MACD_Dot.DefineColor("Positive and Up", Color.GREEN);
MACD_Dot.DefineColor("Positive and Down", Color.DARK_GREEN);
MACD_Dot.DefineColor("Negative and Down", Color.RED);
MACD_Dot.DefineColor("Negative and Up", Color.DARK_RED);
MACD_Dot.AssignValueColor(if MACD_State == PosUp then MACD_Dot.Color("Positive and Up")
else if MACD_State == PosDn then MACD_Dot.Color("Positive and Down")
else if MACD_State == NegDn then MACD_Dot.Color("Negative and Down")
else MACD_Dot.Color("Negative and Up"));
AddChartBubble(!IsNaN(close[n1]) and IsNaN(close[n]), 1, "MACD", Color.Yellow, yes);
# End Code Modified MACD - Gaussian

declare lower;

input length = 14; # default -> 14;
def calcLength = 5;
def smoothLength = 3;
input agg = AggregationPeriod.FIVE_MIN;

def o = open(period = agg);
def c = close(period = agg);
def data = fold i = 0 to length
           with s
           do s + (if c > GetValue(o, i)
                   then 1
                   else if c < GetValue(o, i)
                        then - 1
                        else 0);
def EMA5 = ExpAverage(data, calcLength);
plot Main = ExpAverage(EMA5, smoothLength);
plot Signal = ExpAverage(Main, smoothLength);
Main.AssignValueColor(if Main > Signal
                            then Color.GREEN
                            else Color.RED);
Signal.AssignValueColor(if Main > Signal
                            then Color.GREEN
                            else Color.RED);
Main.SetLineWeight(1);
Signal.SetLineWeight(1);
Signal.HideBubble();
Signal.HideTitle();


# JQ_FisherTransform_wLabels v02
# assistance provided by AlphaInvestor, amalia, randyr and nube

# v02 9.23.2018 JQ added arrows

input Fisherprice = hl2;
input FisherLength = 10;
input TriggerLineOffset = 1; # Ehler's value of choice is 1
input TriggerLine_Color_Choice = {"magenta", "cyan", "pink", default "gray", "Mustard", "red", "green", "dark_gray", "Pale Yellow", "white"};
input deBug = no;

def maxHigh = Highest(Fisherprice, FisherLength);
def minLow = Lowest(Fisherprice, FisherLength);
def range = maxHigh - minLow;
def value = if IsNaN(Fisherprice)
then Double.NaN
else if IsNaN(range)
then value[1]
else if range == 0
then 0
else 0.66 * ((Fisherprice - minLow) / range - 0.5) + 0.67 * value[1];
def truncValue = if value > 0.99 then 0.999 else if value < -0.99 then -0.999 else value;
def fish = 0.5 * (Log((1 + truncValue) / (1 - truncValue)) + fish[1]);
def FTOneBarBack = fish[TriggerLineOffset];
def FT = fish;

plot FisherBullCross = if FT crosses above FTOneBarBack then LowestAll(Main) else Double.NaN;
FisherBullCross.SetPaintingStrategy(PaintingStrategy.ARROW_UP);
FisherBullCross.SetDefaultColor(Color.UPTICK);

plot FisherBearCross = if FT crosses below FTOneBarBack then HighestAll(Main) else Double.NaN;
FisherBearCross.SetPaintingStrategy(PaintingStrategy.ARROW_DOWN);
FisherBearCross.SetDefaultColor(Color.DOWNTICK);


input length2 = 10; # default -> 14;
def calcLength2 = 5;
def smoothLength2 = 3;
input agg2 = AggregationPeriod.FIFTEEN_MIN;

def o2 = open(period = agg2);
def c2 = close(period = agg2);
def data2 = fold i2 = 0 to length2
           with s2
           do s2 + (if c2 > GetValue(o2, i2)
                   then 1
                   else if c2 < GetValue(o2, i2)
                        then - 1
                        else 0);
def EMA52 = ExpAverage(data2, calcLength2);
plot Main2 = ExpAverage(EMA52, smoothLength2);
plot Signal2 = ExpAverage(Main2, smoothLength2);
Main2.AssignValueColor(if Main2 > Signal2
                            then Color.UPTICK
                            else Color.DOWNTICK);
Signal2.AssignValueColor(if Main2 > Signal2
                            then Color.UPTICK
                            else Color.DOWNTICK);
Signal2.HideBubble();
Signal2.HideTitle();

AddCloud(Main, Signal, Color.GREEN, Color.RED);
AddCloud(Main2, Signal2, Color.UPTICK, Color.DOWNTICK);

plot ZeroLine = 0;
ZeroLine.SetDefaultColor(Color.YELLOW);
ZeroLine.HideBubble();
ZeroLine.HideTitle();

plot ob = if IsNaN(c) then Double.NaN else Round(length * .7);
ob.SetDefaultColor(Color.DARK_ORANGE);
ob.HideBubble();
ob.HideTitle();
plot os = if IsNaN(c) then Double.NaN else -Round(length * .7);
os.SetDefaultColor(Color.CYAN);
os.HideBubble();
os.HideTitle();
AddCloud(ob, length, Color.DARK_ORANGE, Color.DARK_ORANGE, no);
AddCloud(-length, os, Color.CYAN, Color.CYAN);

# Forward / Reverse EMA
# (c) 2017 John F. Ehlers
# Ported to TOS 07.16.2017
# Mobius

# Inputs:
input AA = .1;

# Vars:
def CC;
def RE1;
def RE2;
def RE3;
def RE4;
def RE5;
def RE6;
def RE7;
def RE8;
def EMA;

CC = if CC[1] == 0 then .9 else 1 – AA;
EMA = AA * close + CC * EMA[1];
RE1 = CC * EMA + EMA[1];
RE2 = Power(CC, 2) * RE1 + RE1[1];
RE3 = Power(CC, 4) * RE2 + RE2[1];
RE4 = Power(CC, 8) * RE3 + RE3[1];
RE5 = Power(CC, 16) * RE4 + RE4[1];
RE6 = Power(CC, 32) * RE5 + RE5[1];
RE7 = Power(CC, 64) * RE6 + RE6[1];
RE8 = Power(CC, 128) * RE7 + RE7[1];

def FREMA_Diff = EMA – AA * RE8;
def FREMA_State = if FREMA_Diff >= 0
then if FREMA_Diff > FREMA_Diff[1]
then PosUp
else PosDn
else if FREMA_Diff < FREMA_Diff[1]
then NegDn
else NegUp;
plot FREMA_Dot = if IsNaN(close) then Double.NaN else 3;
FREMA_Dot.SetPaintingStrategy(PaintingStrategy.POINTS);
FREMA_Dot.SetLineWeight(DotSize);
FREMA_Dot.DefineColor("Positive and Up", Color.GREEN);
FREMA_Dot.DefineColor("Positive and Down", Color.DARK_GREEN);
FREMA_Dot.DefineColor("Negative and Down", Color.RED);
FREMA_Dot.DefineColor("Negative and Up", Color.DARK_RED);
FREMA_Dot.AssignValueColor(if FREMA_State == PosUp then FREMA_Dot.Color("Positive and Up")
else if FREMA_State == PosDn then FREMA_Dot.Color("Positive and Down")
else if FREMA_State == NegDn then FREMA_Dot.Color("Negative and Down")
else FREMA_Dot.Color("Negative and Up"));
AddChartBubble(!IsNaN(close[n1]) and IsNaN(close[n]), 3, "FREMA", Color.YELLOW, yes);
# End Code Ehlers Forward / Reverse EMA
 
Awesome! Is there a single aggregation version of this available for those that want to use tick charts? That would be nice as well.

Also, I google FREMA and I found some info, but I'm not really sure I see a huge advantage to it, can anyone explain how they are getting added value from it? Thanks!
 
Team, Is it possible to created "MTF indicator for Support and Resistance"... If i remember correctly, @horserider posted S/R indicator long time back but that one shows based chart time frame Example: If we select Weekly its shows only Weekly If we select Monthly its shows only Monthly ...etc. Instead of showing based on selection, is it possible to show all time frame in one chart? irrespective of the time selection.

I knew this thread not related to S/R but i see that this hread more active for MTF that's Y i post this query in this thread.. Please excuse :unsure:
 

Join useThinkScript to post your question to a community of 21,000+ developers and traders.

Similar threads

Not the exact question you're looking for?

Start a new thread and receive assistance from our community.

87k+ Posts
462 Online
Create Post

Similar threads

Similar threads

The Market Trading Game Changer

Join 2,500+ subscribers inside the useThinkScript VIP Membership Club
  • Exclusive indicators
  • Proven strategies & setups
  • Private Discord community
  • ‘Buy The Dip’ signal alerts
  • Exclusive members-only content
  • Add-ons and resources
  • 1 full year of unlimited support

Frequently Asked Questions

What is useThinkScript?

useThinkScript is the #1 community of stock market investors using indicators and other tools to power their trading strategies. Traders of all skill levels use our forums to learn about scripting and indicators, help each other, and discover new ways to gain an edge in the markets.

How do I get started?

We get it. Our forum can be intimidating, if not overwhelming. With thousands of topics, tens of thousands of posts, our community has created an incredibly deep knowledge base for stock traders. No one can ever exhaust every resource provided on our site.

If you are new, or just looking for guidance, here are some helpful links to get you started.

What are the benefits of VIP Membership?
VIP members get exclusive access to these proven and tested premium indicators: Buy the Dip, Advanced Market Moves 2.0, Take Profit, and Volatility Trading Range. In addition, VIP members get access to over 50 VIP-only custom indicators, add-ons, and strategies, private VIP-only forums, private Discord channel to discuss trades and strategies in real-time, customer support, trade alerts, and much more. Learn all about VIP membership here.
How can I access the premium indicators?
To access the premium indicators, which are plug and play ready, sign up for VIP membership here.
Back
Top