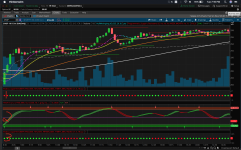
Repaints Multi-Time Frame True Momentum Oscillator (MTF) for ThinkorSwim

Repaints

tomsk

Well-known member
VIP
For those that are interested here is the official / clean version of Mobius True Momentum Oscillator (TMO). There are other versions out there that slap on additional features such as from JohnnyQuotron as posted above by @HighBredCloud
shareable study link: http://tos.mx/AHOt1aZ Click here for --> Easiest way to load shared links
Code:
# TMO ((T)rue (M)omentum (O)scilator)
# Mobius
# V01.05.2018
#hint: TMO calculates momentum using the delta of price. Giving a much better picture of trend, tend reversals and divergence than momentum oscillators using price.

declare Lower;

input length = 14;
input calcLength = 5;
input smoothLength = 3;

def o = open;
def c = close;
def data = fold i = 0 to length
           with s
           do s + (if c > getValue(o, i)
                   then 1
                   else if c < getValue(o, i)
                        then - 1
                        else 0);
def EMA5 = ExpAverage(data, calcLength);
plot Main = ExpAverage(EMA5, smoothLength);
plot Signal = ExpAverage(Main, smoothLength);
     Main.AssignValueColor(if Main > Signal
                           then color.green
                           else color.red);
     Signal.AssignValueColor(if Main > Signal
                             then color.green
                             else color.red);
     Signal.HideBubble();
     Signal.HideTitle();
addCloud(Main, Signal, color.green, color.red);
plot zero = if isNaN(c) then double.nan else 0;
     zero.SetDefaultColor(Color.gray);
     zero.hideBubble();
     zero.hideTitle();
plot ob = if isNaN(c) then double.nan else round(length * .7);
     ob.SetDefaultColor(Color.gray);
     ob.HideBubble();
     ob.HideTitle();
plot os = if isNaN(c) then double.nan else -round(length * .7);
     os.SetDefaultColor(Color.gray);
     os.HideBubble();
     os.HideTitle();
addCloud(ob, length, color.light_red, color.light_red, no);
addCloud(-length, os, color.light_green, color.light_green);
 
Last edited by a moderator:

Join useThinkScript to post your question to a community of 21,000+ developers and traders.

@tomsk The addition was only the Fisher Transform arrows from what I can see...When those are set to CLOSE from the original setting reversal is spotted even earlier than the actual TMO indicator changes colors..., however, in a choppy market it does tend to throw false signals.

The one you posted also does not have the time aggregation...which I personally find very useful and would be needed for the indicator to function as intended by Mobius as described in my post above.

What do you think of the idea of combining TMO and making the secondary TMO into dots?
 
Last edited:
Here is a clean unadulerated version of Mobius TMO with Higher Aggregation for you to play with

Code:
# TMO ((T)rue (M)omentum (O)scillator) With Higher Aggregation
# Mobius
# V01.05.2018
# 5.15.2018
#hint: TMO calculates momentum using the delta of price. Giving a much better picture of trend, tend reversals and divergence than momentum oscillators using price.

declare Lower;

input length = 14;
input calcLength = 5;
input smoothLength = 3;
input agg = AggregationPeriod.Fifteen_min;

def o = open(period = agg);;
def c = close(period = agg);
def data = fold i = 0 to length
           with s
           do s + (if c > getValue(o, i)
                   then 1
                   else if c < getValue(o, i)
                        then - 1
                        else 0);
def EMA5 = ExpAverage(data, calcLength);
plot Main = ExpAverage(EMA5, smoothLength);
plot Signal = ExpAverage(Main, smoothLength);
     Main.AssignValueColor(if Main > Signal
                           then color.green
                           else color.red);
     Signal.AssignValueColor(if Main > Signal
                             then color.green
                             else color.red);
     Signal.HideBubble();
     Signal.HideTitle();
addCloud(Main, Signal, color.green, color.red);
plot zero = if isNaN(c) then double.nan else 0;
     zero.SetDefaultColor(Color.gray);
     zero.hideBubble();
     zero.hideTitle();
plot ob = if isNaN(c) then double.nan else round(length * .7);
     ob.SetDefaultColor(Color.gray);
     ob.HideBubble();
     ob.HideTitle();
plot os = if isNaN(c) then double.nan else -round(length * .7);
     os.SetDefaultColor(Color.gray);
     os.HideBubble();
     os.HideTitle();
addCloud(ob, length, color.light_red, color.light_red, no);
addCloud(-length, os, color.light_green, color.light_green);
# End Code TMO with Higher Aggregation
 
@tomsk It looks the same as the one I posted...it should also function the same...minus that fact that it does not come with the Fisher Transform...ANY extras can be turned off if not wanted by the end user...BUT to convert into the dots I think the code you posted would be the best...so thanks for posting it. Since you have done the whole dots before with the CSA indicator...do you want to give it a shot at this? I tagged @netarchitech in this...I should have asked you too...
 
@tomsk It looks the same as the one I posted...it should also function the same...minus that fact that it does not come with the Fisher Transform...ANY extras can be turned off if not wanted by the end user...BUT to convert into the dots I think the code you posted would be the best...so thanks for posting it. Since you have done the whole dots before with the CSA indicator...do you want to give it a shot at this? I tagged @netarchitech in this...I should have asked you too...

It may look the same but it isn't. My post above is the base code that Johnny Quotron used used to add the Fisher extensions
Compare the two codes carefully and you'll see what I mean
 
Last edited:
It looks the same but it isn't. My post above is the base code that Johnny Quotron used used to add the Fisher extensions
Compare the two codes carefully and you'll see what I mean
@tomsk The code above that I posted...I should explain...I found a TMO with time aggregation..If I remember correctly @markos posted it with the ONLY thing that he changed from it was that he switched the OB from RED to GREEN and OS fro GREEN to RED...I switched those back...then I found TMO with Fisher...Since I could not find both TMO with time aggregation and with Fisher Transform...I took the part of the Fisher Transform and added it to the script of the TMO with time aggregation...My **** poor attempt of coding actually worked without throwing any errors...

With that said...Can you please check the code that I posted because I am looking at both and they are identical...Or at least throw me a bone where or on what timeframe to look for the differences because I think they are the same...This is not the Johnny Quotron version.
 
Think we should move the discussion elsewhere if we're going to be discussing TMO specificity as this thread is for the Universal Oscillator
better be proactive or @BenTen would nudge us
@tomsk I agree...I am sure @BenTen can move this once a game plan is figured out and progress is being made. I wanted to gauge interest first to see IF what I am asking for makes sense and if it is doable...I have a potential another add on to this TMO...I just don't know if the dots can be implemented into the actual TMO indicator or not. IF they can can something like this be done? Refer to the pic.

1. Top portion is a SuperTrend represented in dots...This type of a SuperTrend is also with aggregation so the end user can run a SuperTrend with the candles painted on and one with the dots and a separate aggregation. I already have a script for the SuperTrend that I want to use that comes with time aggregation that I can post.

2. Middle section is TMO with Fisher

3. Lower portion is secondary TMO in dots form with time aggregation...

klbsQEk.png
 

Attachments

  • klbsQEk.png
    klbsQEk.png
    506 KB · Views: 396
Last edited by a moderator:
@tomsk Great info for sure and something to take into consideration...But I can't help to ask what is your concern here pertaining this idea? Please share so that it is known...

Even Mobius suggested to use "dual TMO" indicators with the second one being aggregated to a 5-10 times the original timeframe...

I find the dots being the most useful as TMO itself is effective on the color change that reflects polarity change and not by the OB/OS or ZERO line...as far as I know. right?

The added idea about SuperTrend merging into the TMO indicator also is something different that you stated in your link. I respect Mobius work and everything in this idea is combining his ideas and scripts together...The SuperTrend in particular will allow for a separate SuperTrend to be ran in the upper study such as the Price Trend SuperTrend...

Please clear up any misconceptions I may have about this particular project before anyones time is wasted. Is the issue with this idea the effectiveness? Overall simplicity or readability? What is it?
 
Upon reviewing and actually testing the True Momentum Oscillator in a way that Mobius suggested by overlaying two instances of TMO over one another with the second TMO being 5-10 higher then the original TMO I would like to clarify and correct post #58.

I tested this on a 5 min chart with the first TMO being set to 5 min...the second was set to 30 min. When I overlapped both into one study I unchecked everything except for the main and signal line...My findings show TMO absolutely does work in mysterious ways that I haven't noticed before.

Whenever the the 5 min TMO was above the 30 min TMO in a LONG position that displayed a strong upward trend when the smaller timeframe was above a longer timeframe TMO. Whenever the smaller timeframe was below the higher timeframe in a LONG position even tho both were the same color the trend was not as strong. However, when the 5 min TMO crossed the ZERO line and was crossing the 30 min TMO in an upward trend that's when a bigger move up was seen.

see below:


And vice versa for SHORT positions...whenever the shorter timeframe 5 min was below the longer timeframe TMO 30 min the trend was much strong in a downward direction.

In summary...the ZERO line absolutely does play into effect with TMO...So TMO is not just effective by the polarity change like I thought and what I read somewhere on this forum. Even the OB/OS lines could play into effect. The nice thing is that when two TMO indicators are overlaid on top of each other they still share the same ZERO line and there for the same OB/OS lines.

With all this in mind I find that creating dots on the secondary TMO like I originally thought is a mistake...BECAUSE of everything that I mentioned above.

In regards to the Fisher Transform that was incorporated into the TMO...here's my take. It does not hurt to have it there...especially when the shorter timeframe TMO is above the longer TMO in a LONG position the Fisher does give an entry or exit signal sooner than the actual color change...During choppy market there are, however, more false signals generated...If that's an issue I suggest disabling the Fisher Transform from the user interface.

IF anyone else knows more about TMO indicator that I may not know please chime in...

So what I think would be the best approach would be to merge 2 instances of TMO into one indicator with small enhancements to make the readability easier with the following criteria:

1. Change the OB/OS lines to a different color since it gets hard to read when the 2 TMO's are either in the OB or OS conditions...Either Darker RED or Darker GREEN or other colors that won't clash with the Main and Signal lines of the TMO...

***NOTE***I also tested the 5 min TMO and the 15 min TMO...and here is my take: This setting will generate more entries...but also the moves may not be as BIG as 5 min and 30 min...HOWEVER there are more opportunities incase anyone misses the entry on the 5 min and 30 min TMO...I personally feel that in order to get in on the 5 min and 30 min TMO...one must be watching the stock from opening bell or you will miss the big moves.

THIS leads me to think that possibly having 3 instances of TMO to be a better solution something such as 5 min 15 min and 30 min...and catch the bounces between each line crossings.

This does bring a problem when all 3 instances of TMO are the same color...it muddies to a point where its hard to tell which TMO lines belong to which times...Possible solution would be having the ability to change colors on the TMO lines to distinguish between them. I guess the option of 3 instances of TMO would be nice and necessary for more opportunities to enter a trade...Having a customizable TMO that would allow the end user to chose how many TMO instances to run by unclicking from 3 to 2 to 1 for example would be ideal.


@netarchitech is that something that you can do or is it something that you'd prefer others to attempt...?
 
is that something that you can do or is it something that you'd prefer others to attempt...?
@HighBredCloud Thanks for the excellent analysis of the TMO situation :cool: On that note, I would certainly welcome any member of the community who would like to join the team and contribute their skills towards the completion of outstanding projects...

THIS leads me to think that possibly having 3 instances of TMO to be a better solution something such as 5 min 15 min and 30 min...and catch the bounces between each line crossings.
OK...sounds like a TMO_MTF...I have to dig through my code archive, I think I have some code I can repurpose to at least get the project going :)

This does bring a problem when all 3 instances of TMO are the same color...it muddies to a point where its hard to tell which TMO lines belong to which times...Possible solution would be having the ability to change colors on the TMO lines to distinguish between them. I guess the option of 3 instances of TMO would be nice and necessary for more opportunities to enter a trade...Having a customizable TMO that would allow the end user to chose how many TMO instances to run by unclicking from 3 to 2 to 1 for example would be ideal.
@HighBredCloud Pick the colors you would like and we'll incorporate them into the TMO_MTF...Thanks...The "Show Plot" checkbox in the "Customizing" window is where the user would enable or disable instances of the TMOs...
 
a.png


b.png


Code:
# filename: MR__EZ_TMO_MTF_
# source: https://usethinkscript.com/d/91-tmo-with-higher-agg-mobius-tsl

# TMO ((T)rue (M)omentum (O)scillator) With Higher Aggregation
# Mobius
# V01.05.2018
#hint: TMO calculates momentum using the DELTA of price. Giving a much better picture of trend, trend reversals and divergence than momentum oscillators using price.

declare lower;

input length = 10; # default -> 14;
def calcLength = 5;
def smoothLength = 3;
input agg = AggregationPeriod.FIVE_MIN;

def o = open(period = agg);
def c = close(period = agg);
def data = fold i = 0 to length
           with s
           do s + (if c > getValue(o, i)
                   then 1
                   else if c < getValue(o, i)
                        then - 1
                        else 0);
def EMA5 = ExpAverage(data, calcLength);
plot Main = ExpAverage(EMA5, smoothLength);
plot Signal = ExpAverage(Main, smoothLength);
     Main.AssignValueColor(if Main > Signal
                                then CreateColor(0, 191, 0) #Green
                                else CreateColor(191, 0, 0)); #Red;
     Signal.AssignValueColor(if Main > Signal
                                  then CreateColor(0, 191, 0) #Green
                                  else CreateColor(191, 0, 0)); #Red
     Main.SetLineWeight(3);
     Signal.SetLineWeight(3);
     Signal.HideBubble();
     Signal.HideTitle();


input length2 = 10; # default -> 14;
def calcLength2 = 5;
def smoothLength2 = 3;
input agg2 = AggregationPeriod.FIFTEEN_MIN;

def o2 = open(period = agg2);
def c2 = close(period = agg2);
def data2 = fold i2 = 0 to length2
           with s2
           do s2 + (if c2 > getValue(o2, i2)
                   then 1
                   else if c2 < getValue(o2, i2)
                        then - 1
                        else 0);
def EMA52 = ExpAverage(data2, calcLength2);
plot Main2 = ExpAverage(EMA52, smoothLength2);
plot Signal2 = ExpAverage(Main2, smoothLength2);
     Main2.AssignValueColor(if Main2 > Signal2
                            then color.UPTICK
                            else color.DOWNTICK);
     Signal2.AssignValueColor(if Main2 > Signal2
                            then color.UPTICK
                            else color.DOWNTICK);
     Signal2.HideBubble();
     Signal2.HideTitle();

input length3 = 10; # default -> 14;
def calcLength3 = 5;
def smoothLength3 = 3;
input agg3 = AggregationPeriod.THIRTY_MIN;

def o3 = open(period = agg3);
def c3 = close(period = agg3);
def data3 = fold i3 = 0 to length3
           with s3
           do s3 + (if c3 > getValue(o3, i3)
                   then 1
                   else if c3 < getValue(o3, i3)
                        then - 1
                        else 0);
def EMA53 = ExpAverage(data3, calcLength3);
plot Main3 = ExpAverage(EMA53, smoothLength3);
plot Signal3 = ExpAverage(Main3, smoothLength3);
     Main3.AssignValueColor(if Main3 > Signal3
                            then color.UPTICK
                            else color.DOWNTICK);
     Signal3.AssignValueColor(if Main3 > Signal3
                            then color.UPTICK
                            else color.DOWNTICK);
     Signal3.HideBubble();
     Signal3.HideTitle();

addCloud(Main, Signal, color.GREEN, color.RED);
addCloud(Main2, Signal2, color.UPTICK, color.DOWNTICK);
addCloud(Main3, Signal3, color.DARK_GREEN, color.DARK_RED);

plot ZeroLine = 0;
     ZeroLine.SetDefaultColor(Color.ORANGE);
     ZeroLine.HideBubble();
     ZeroLine.HideTitle();
 
Out of curiosity for the main instance of TMO can you use the scrip with the Fisher Transform?
I can try...Could you provide me with or point me in the direction of the TMO FisherTransform?

the one I posted I attempted of merging two TMO's together...to my surprise it worked...
See! I knew you could do it...You're well on your way to thinkscripting :cool:

In any event...what I thought I did was take a regular Mobius code that with higher aggregation and just pasted the Fisher part in there...To me both the TMO that I posted and the one @tomsk posted looked the same when plotted in TOS...
OK...let's get both together and have a look...

can you perhaps add a feature for the user to chose that themselves?
@HighBredCloud Unfortunately, the colors are dynamically set in the script...If you have an idea of what you would like to look at we could adjust the colors and go from there...As for me, I put my crayons away a long time ago now...Remember? :ROFLMAO:
 
@netarchitech Below is the TMO with Fisher that I merged together...I will post the one that @tomsk posted as well with higher aggregation for you to compare if they are the same with the only difference being the Fisher Transform...

IF I had to chose colors now...lets just keep things the way they are now not to confuse people...I guess for the OB/OS lines I liked the same darker REDS and GREENS you used on the PercentR_MAC...if I recall correctly I think its the same colors as the version @tomsk posted...but his has no Fisher...

If you could just do a once over and see if those two scripts are the same TMO except for Fisher and the one I posted has brighter colors on the OB/OS conditions...I just want to be sure as they look the same but not sure. Well I tried...kinda worked as no errors came back to my surprise...LOL...

I circled in RED parts of the TMO version that I have that you could possibly take out as it does absolutely nothing...please see below:


In fact it is enough for ONLY the primary TMO to have Fisher Transform...the other 2 don't need them...ALL must have higher aggregation...So I don't know but perhaps you can use the TMO version that @tomsk posted for TMO 2 and 3?

My TMO higher Aggregation with Fisher Transform:

Code:
#TMO True Momentum Oscillator with Higher Aggregation _Mobius
#Tuesday, May 15, 2018 12:36 PM
## OneNote Archive Name: TMO True Momentum Oscillator with Higher Aggregation _Mobius
## Archive Section: Momentum
## Suggested Tos Name: TrueMomentumOscillator_w_HigherAggregation_Mobius
## Archive Date: 5.15.2018
## Archive Notes:
## 08:43 Mobius: Well give it a few days to get altered, munched, distorted and twisted. Then when it get back to being used as intended someone will start making money with it.
## 08:45 Mobius: Oh and in my view - It's highest and best use is as designed with a secondary aggregation plotted either on it or with it around 5 to 10 time higher.
## "##" indicates an addition or adjustment by the OneNote Archivist
## Original Code Follows
# TMO ((T)rue (M)omentum (O)scillator) With Higher Aggregation
# Mobius
# V01.05.2018
#hint: TMO calculates momentum using the delta of price. Giving a much better picture of trend, tend reversals and divergence than momentum oscillators using price.

declare Lower;

input length = 14;
input calcLength = 5;
input smoothLength = 3;
input agg = AggregationPeriod.weeK;
input displayFisherLabels = no;

def o = open(period = agg);
def c = close(period = agg);
def data = fold i = 0 to length
           with s
           do s + (if c > getValue(o, i)
                   then 1
                   else if c < getValue(o, i)
                        then - 1
                        else 0);
def EMA5 = ExpAverage(data, calcLength);
plot Main = ExpAverage(EMA5, smoothLength);
plot Signal = ExpAverage(Main, smoothLength);
     Main.AssignValueColor(if Main > Signal
                           then color.green
                           else color.Red);
     Signal.AssignValueColor(if Main > Signal
                             then color.green
                             else color.red);
     Signal.HideBubble();
     Signal.HideTitle();
addCloud(Main, Signal, Color.LIGHT_GREEN, color.red);
plot zero = if isNaN(c) then double.nan else 0;
     zero.SetDefaultColor(Color.gray);
     zero.hideBubble();
     zero.hideTitle();
plot ob = if isNaN(c) then double.nan else round(length * .8);
     ob.SetDefaultColor(Color.gray);
     ob.HideBubble();
     ob.HideTitle();
plot os = if isNaN(c) then double.nan else -round(length * .8);
     os.SetDefaultColor(Color.gray);
     os.HideBubble();
     os.HideTitle();
addCloud(ob, length, Color.LIGHT_RED, Color.LIGHT_RED, Yes);
addCloud(-length, os, Color.GREEN, Color.GREEN, showBorder = Yes);
# End Code TMO with Higher Aggregation

# JQ_FisherTransform_wLabels v02
# assistance provided by AlphaInvestor, amalia, randyr and nube

# v02 9.23.2018 JQ added arrows

input Fisherprice = hl2;
input FisherLength = 10;
input TriggerLineOffset = 1; # Ehler's value of choice is 1
input TriggerLine_Color_Choice = {"magenta", "cyan", "pink", default "gray", "Mustard", "red", "green", "dark_gray", "Pale Yellow", "white"};
input deBug = no;

input BuyLabelText = " FisherTransform Buy ";
input SellLebelText = " FisherTransform Sell ";

def maxHigh = Highest(Fisherprice, FisherLength);
def minLow = Lowest(Fisherprice, FisherLength);
def range = maxHigh - minLow;
def value = if IsNaN(Fisherprice)
then Double.NaN
else if IsNaN(range)
then value[1]
else if range == 0
then 0
else 0.66 * ((Fisherprice - minLow) / range - 0.5) + 0.67 * value[1];
def truncValue = if value > 0.99 then 0.999 else if value < -0.99 then -0.999 else value;
def fish = 0.5 * (Log((1 + truncValue) / (1 - truncValue)) + fish[1]);
def FTOneBarBack = fish[TriggerLineOffset];
def FT = fish;

plot FisherBullCross = if FT crosses above FTOneBarBack then lowestall(Main) else Double.NaN;
FisherBullCross.SetPaintingStrategy(PaintingStrategy.ARROW_UP);
FisherBullCross.SetDefaultColor(Color.UPTICK);

plot FisherBearCross = if FT crosses below FTOneBarBack then highestall(Main) else Double.NaN;
FisherBearCross.SetPaintingStrategy(PaintingStrategy.ARROW_DOWN);
FisherBearCross.SetDefaultColor(Color.DOWNTICK);


AddLabel (displayFisherLabels, "" + if FT >= FTOneBarBack then BuyLabelText else SellLebelText + " ",
(if FT > FTOneBarBack
then Color.LIGHT_GREEN
else if FT < FTOneBarBack
then Color.LIGHT_RED
else Color.GRAY));
 
@netarchitech I just saw your post #12...didn't see it as I was looking for @tomsk TMO version with higher aggregation...but I think you have the same code..mine was the only one that had a slightly unique look to it. Let me test the one that you just made...
 
@netarchitech I dig the color format of the Main and Signal line on what you've done...definitely can tell them apart now...I guess from my code can you add Fisher to the primary TMO? and the OB/OS fields with the colors probably the same as in PercentR_MAC? I don't know what do you think? I am asking for you to take your crayons out on this one to see what will look good and yet be clear when all 3 instances are present...Can you make the OB/OS lines something that the user can pick and chose or is that also part of the code thats dynamic in color?
 
Let me test the one that you just made...
Sounds good @HighBredCloud

I guess from my code can you add Fisher to the primary TMO?
We'll give it a shot :)

I dig the color format of the Main and Signal line on what you've done...
Thanks @HighBredCloud :)

.Can you make the OB/OS lines something that the user can pick and chose or is that also part of the code thats dynamic in color?
I don't know...I didn't realize that zero bounded Oscillators have OB/OS levels...I don't remember seeing a MACD with OB/OS...Where would we put them? The scale maxes out at 10/-10 I believe...
 
@netarchitech

Here is the version of TMO that @tomsk posted with higher aggregation...I just compared mine...his and yours...Looks like mine and @tomsk are the same...but yours is different.

TMO higher aggregation:

Code:
# TMO ((T)rue (M)omentum (O)scillator) With Higher Aggregation
# Mobius
# V01.05.2018
# 5.15.2018
#hint: TMO calculates momentum using the delta of price. Giving a much better picture of trend, tend reversals and divergence than momentum oscillators using price.

declare Lower;

input length = 14;
input calcLength = 5;
input smoothLength = 3;
input agg = AggregationPeriod.Fifteen_min;

def o = open(period = agg);;
def c = close(period = agg);
def data = fold i = 0 to length
           with s
           do s + (if c > getValue(o, i)
                   then 1
                   else if c < getValue(o, i)
                        then - 1
                        else 0);
def EMA5 = ExpAverage(data, calcLength);
plot Main = ExpAverage(EMA5, smoothLength);
plot Signal = ExpAverage(Main, smoothLength);
     Main.AssignValueColor(if Main > Signal
                           then color.green
                           else color.red);
     Signal.AssignValueColor(if Main > Signal
                             then color.green
                             else color.red);
     Signal.HideBubble();
     Signal.HideTitle();
addCloud(Main, Signal, color.green, color.red);
plot zero = if isNaN(c) then double.nan else 0;
     zero.SetDefaultColor(Color.gray);
     zero.hideBubble();
     zero.hideTitle();
plot ob = if isNaN(c) then double.nan else round(length * .7);
     ob.SetDefaultColor(Color.gray);
     ob.HideBubble();
     ob.HideTitle();
plot os = if isNaN(c) then double.nan else -round(length * .7);
     os.SetDefaultColor(Color.gray);
     os.HideBubble();
     os.HideTitle();
addCloud(ob, length, color.light_red, color.light_red, no);
addCloud(-length, os, color.light_green, color.light_green);
# End Code TMO with Higher Aggregation
 

Similar threads

Not the exact question you're looking for?

Start a new thread and receive assistance from our community.

87k+ Posts
151 Online
Create Post

Similar threads

Similar threads

The Market Trading Game Changer

Join 2,500+ subscribers inside the useThinkScript VIP Membership Club
  • Exclusive indicators
  • Proven strategies & setups
  • Private Discord community
  • ‘Buy The Dip’ signal alerts
  • Exclusive members-only content
  • Add-ons and resources
  • 1 full year of unlimited support

Frequently Asked Questions

What is useThinkScript?

useThinkScript is the #1 community of stock market investors using indicators and other tools to power their trading strategies. Traders of all skill levels use our forums to learn about scripting and indicators, help each other, and discover new ways to gain an edge in the markets.

How do I get started?

We get it. Our forum can be intimidating, if not overwhelming. With thousands of topics, tens of thousands of posts, our community has created an incredibly deep knowledge base for stock traders. No one can ever exhaust every resource provided on our site.

If you are new, or just looking for guidance, here are some helpful links to get you started.

What are the benefits of VIP Membership?
VIP members get exclusive access to these proven and tested premium indicators: Buy the Dip, Advanced Market Moves 2.0, Take Profit, and Volatility Trading Range. In addition, VIP members get access to over 50 VIP-only custom indicators, add-ons, and strategies, private VIP-only forums, private Discord channel to discuss trades and strategies in real-time, customer support, trade alerts, and much more. Learn all about VIP membership here.
How can I access the premium indicators?
To access the premium indicators, which are plug and play ready, sign up for VIP membership here.
Back
Top