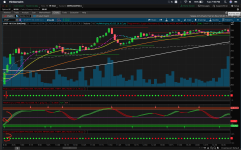
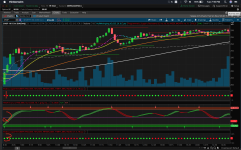
@HighBredCloud MTF_TMO_STSW for your review:

One caveat: I couldn't get the FisherTransform to work
Code:
# filename: MR__EZ_MTF_TMO_STSW_
# idea source: vvcv and HighBredCloud
# mashup: netarchitech

#STSW = Schaff Trend Line and Schaff Wave Line
#Schaff Trend Line = Used for quick up/down trend declaration
#Schaff Wave Line = Trade Wave in the direction of trend as
#declared by Trend Line.
#Schaff Wave Line can be used alone to enter trend
#declared by the MACD.
#Schaff Wave can be used with the EMA for signals

declare lower;

input fastLengthTrend = 48;
input slowLengthTrend = 104;
input KPeriodTrend = 36;
input DPeriodTrend = 8;
input averageTypeTrend = AverageType.EXPONENTIAL;
input fastLengthWave = 12;
input slowLengthWave = 26;
input KPeriodWave = 9;
input DPeriodWave = 2;
input over_bought = 75;
input over_sold = 25;
input averageTypeWave = AverageType.EXPONENTIAL;

def macdTrend = MovingAverage(averageTypeTrend, close, fastLengthTrend) - MovingAverage(averageTypeTrend, close, slowLengthTrend);
def macdWave = MovingAverage(averageTypeWave, close, fastLengthWave) - MovingAverage(averageTypeWave, close, slowLengthWave);
def fastK1Trend = FastKCustom(macdTrend, KPeriodTrend);
def fastK1Wave = FastKCustom(macdWave, KPeriodWave);
def fastD1Trend = MovingAverage(averageTypeTrend, fastK1Trend, DPeriodTrend);
def fastD1Wave = MovingAverage(averageTypeWave, fastK1Wave, DPeriodWave);
def fastK2Trend = FastKCustom(fastD1Trend, KPeriodTrend);
def fastK2Wave = FastKCustom(fastD1Wave, KPeriodWave);
plot STCTrend = MovingAverage(averageTypeTrend, fastK2Trend, DPeriodTrend);
plot STCWave = MovingAverage(averageTypeWave, fastK2Wave, DPeriodWave);
plot OverBought = over_bought;
plot OverSold = over_sold;

STCTrend.SetDefaultColor(GetColor(8));
STCWave.SetDefaultColor(GetColor(8));
OverBought.SetDefaultColor(GetColor(7));
OverSold.SetDefaultColor(GetColor(7));

plot Fifty_Line = 50;
Fifty_Line.SetDefaultColor(GetColor(8));
Fifty_Line.HideTitle();
Fifty_Line.SetStyle(Curve.SHORT_DASH);

STCTrend.DefineColor("Up", GetColor(1));
STCTrend.DefineColor("Down", GetColor(0));
STCTrend.AssignValueColor(if STCTrend > STCTrend[1] then STCTrend.Color("Up") else STCTrend.Color("Down"));
STCWave.DefineColor("Up", GetColor(1));
STCWave.DefineColor("Down", GetColor(0));
STCWave.AssignValueColor(if STCWave > STCWave[1] then STCWave.Color("Up") else STCWave.Color("Down"));

#input lengthWave = 10;
#plot AvgExpWave = ExpAverage(STCWave, lengthWave);
#AvgExpWave.SetDefaultColor(GetColor(1));

input MinValue = 0;
input MaxValue = 100;

plot PlotToNormalize1 = STCTrend ;
PlotToNormalize1.SetHiding(1);

plot NormalizedPlot1 =  (MaxValue - MinValue) *  (PlotToNormalize1 - LowestAll(PlotToNormalize1)) / (HighestAll(PlotToNormalize1) - LowestAll(PlotToNormalize1)) + MinValue;
NormalizedPlot1.SetPaintingStrategy(PaintingStrategy.LINE);
NormalizedPlot1.DefineColor("Up", GetColor(1));
NormalizedPlot1.DefineColor("Down", GetColor(0));
NormalizedPlot1.AssignValueColor(if NormalizedPlot1 > NormalizedPlot1[1] then NormalizedPlot1.Color("Up") else NormalizedPlot1.Color("Down"));
NormalizedPlot1.SetLineWeight(2);

plot PlotToNormalize2 = STCWave ;
PlotToNormalize2.SetHiding(1);

plot NormalizedPlot2 =  (MaxValue - MinValue) *  (PlotToNormalize2 - LowestAll(PlotToNormalize2)) / (HighestAll(PlotToNormalize2) - LowestAll(PlotToNormalize2)) + MinValue;
NormalizedPlot2.SetPaintingStrategy(PaintingStrategy.LINE);
NormalizedPlot2.DefineColor("Up", GetColor(1));
NormalizedPlot2.DefineColor("Down", GetColor(0));
NormalizedPlot2.AssignValueColor(if NormalizedPlot2 > NormalizedPlot2[1] then NormalizedPlot2.Color("Up") else NormalizedPlot2.Color("Down"));
NormalizedPlot2.SetLineWeight(2);

input length = 10; # default -> 14;
def calcLength = 5;
def smoothLength = 3;
input agg = AggregationPeriod.FIVE_MIN;

def o = open(period = agg);
def c = close(period = agg);
def data = fold i = 0 to length
           with s
           do s + (if c > getValue(o, i)
                   then 1
                   else if c < getValue(o, i)
                        then - 1
                        else 0);
def EMA5 = ExpAverage(data, calcLength);
plot Main = ExpAverage(EMA5, smoothLength);
plot Signal = ExpAverage(Main, smoothLength);
     Main.AssignValueColor(if Main > Signal
                            then color.GREEN
                            else color.RED);
     Signal.AssignValueColor(if Main > Signal
                            then color.GREEN
                            else color.RED);
     Main.SetLineWeight(3);
     Signal.SetLineWeight(3);
     Signal.HideBubble();
     Signal.HideTitle();
Main.hide();
Signal.hide();

plot PlotToNormalize3 = Main;
PlotToNormalize3.SetHiding(1);

plot NormalizedPlot3 =  (MaxValue - MinValue) *  (PlotToNormalize3 - LowestAll(PlotToNormalize3)) / (HighestAll(PlotToNormalize3) - LowestAll(PlotToNormalize3)) + MinValue;

plot PlotToNormalize4 = Signal ;
PlotToNormalize4.SetHiding(1);

plot NormalizedPlot4 =  (MaxValue - MinValue) *  (PlotToNormalize4 - LowestAll(PlotToNormalize4)) / (HighestAll(PlotToNormalize4) - LowestAll(PlotToNormalize4)) + MinValue;

NormalizedPlot3.SetPaintingStrategy(PaintingStrategy.LINE);
NormalizedPlot3.SetLineWeight(2);
NormalizedPlot3.AssignValueColor(if NormalizedPlot3 > NormalizedPlot4
                                 then color.GREEN
                                 else color.RED);

NormalizedPlot4.SetPaintingStrategy(PaintingStrategy.LINE);
NormalizedPlot4.SetLineWeight(2);
NormalizedPlot4.AssignValueColor(if NormalizedPlot3 > NormalizedPlot4
                                 then color.GREEN
                                 else color.RED);

input length2 = 10; # default -> 14;
def calcLength2 = 5;
def smoothLength2 = 3;
input agg2 = AggregationPeriod.FIFTEEN_MIN;

def o2 = open(period = agg2);
def c2 = close(period = agg2);
def data2 = fold i2 = 0 to length2
           with s2
           do s2 + (if c2 > getValue(o2, i2)
                   then 1
                   else if c2 < getValue(o2, i2)
                        then - 1
                        else 0);
def EMA52 = ExpAverage(data2, calcLength2);
plot Main2 = ExpAverage(EMA52, smoothLength2);
plot Signal2 = ExpAverage(Main2, smoothLength2);
     Main2.AssignValueColor(if Main2 > Signal2
                            then color.UPTICK
                            else color.DOWNTICK);
     Signal2.AssignValueColor(if Main2 > Signal2
                            then color.UPTICK
                            else color.DOWNTICK);
     Signal2.HideBubble();
     Signal2.HideTitle();
Main2.hide();
Signal2.hide();

plot PlotToNormalize5 = Main2;
PlotToNormalize5.SetHiding(1);

plot NormalizedPlot5 =  (MaxValue - MinValue) *  (PlotToNormalize5 - LowestAll(PlotToNormalize5)) / (HighestAll(PlotToNormalize5) - LowestAll(PlotToNormalize5)) + MinValue;

plot PlotToNormalize6 = Signal2;
PlotToNormalize6.SetHiding(1);

plot NormalizedPlot6 =  (MaxValue - MinValue) *  (PlotToNormalize6 - LowestAll(PlotToNormalize6)) / (HighestAll(PlotToNormalize6) - LowestAll(PlotToNormalize6)) + MinValue;

NormalizedPlot5.SetPaintingStrategy(PaintingStrategy.LINE);
NormalizedPlot5.SetLineWeight(2);
NormalizedPlot5.AssignValueColor(if NormalizedPlot5 > NormalizedPlot6
                                 then color.UPTICK
                                 else color.DOWNTICK);

NormalizedPlot6.SetPaintingStrategy(PaintingStrategy.LINE);
NormalizedPlot6.SetLineWeight(2);
NormalizedPlot6.AssignValueColor(if NormalizedPlot5 > NormalizedPlot6
                                 then color.UPTICK
                                 else color.DOWNTICK);

addCloud(NormalizedPlot3, NormalizedPlot4, color.GREEN, color.RED);
addCloud(NormalizedPlot5, NormalizedPlot6, color.UPTICK, color.DOWNTICK);
One caveat: I couldn't get the FisherTransform to work


