
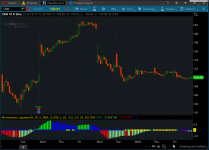
One script but two indicators. A momentum oscillator with volatility squeeze created by Mobius.

Here are his notes:
Here are his notes:
- Long Signal: When Momentum is ascending with value at or above 0 and green Point appears at zero line indicating the Volatility squeeze is over and volatility is expanding.
- Short Signal: When Momentum is descending with value above 0 and first yellow point appears a volatility compression has begun that will likely resolve to a lower value.
- Neutral: If Momentum is below 0 and Squeeze indicates the direction is indeterminate.
- Labels: Labels have been added for Squeeze Signals and Divergence Signals. Alter Momentum line to Weighted Scatterplot Loess line. More predictive
thinkScript Code
Rich (BB code):
# Momentum Oscillator with Volatility Squeeze
# Mobius
# V01.06.2013

declare lower;

input MDetrend =  8; #hint MDetrend: Look-back period for Momentum oscillator
input fastEMA  = 20; #hint fastEMA: Exponential MA period for the Momentum oscillator
input slowEMA  =  5; #hint slowEMA: Exponential MA slowing period for the Momo oscillator
input AverageType = {default SMA, EMA, LRL};
input price = close; #hint price: value used in all calculations
input displace = 0;  #hint displace: displaced period for squeeze calculations
input length = 20;   #hint length: periods or length for the squeeze calculations
input Num_Dev_Dn = -2.0; #hint Num_Dev_Dn: Multiplier for the lower BB Band
input Num_Dev_Up = 2.0;  #hint Num_Dev_Up: Multiplier for the upper BB Band
input BLength = 20;      #hint BLength: periods or length for the bandwidth/squeeze calcs
input SLength = 20;      #hint SLength" periods or length for the squeeze calcs

script BB {
    input price = close;
    input displace = 0;
    input length = 20;
    input Numb_Dev_Dn = -2.0;
    input Numb_Dev_Up = 2.0;
    def StDev = StDev(price, length);
    plot Mid = Inertia(price, length);
    plot Up = Mid + (Numb_Dev_Up * StDev);
    plot DN = Mid + (Numb_Dev_Dn * StDev);
}

def upperBand;
def lowerBand;
def midLine;

switch (AverageType) {
case SMA:
    upperBand = reference BollingerBands(price, displace, length, Num_Dev_Dn, Num_Dev_Up).UpperBand;
    lowerBand = reference BollingerBands(price, displace, length, Num_Dev_Dn, Num_Dev_Up).LowerBand;
    midLine = reference BollingerBands(price, displace, length, Num_Dev_Dn, Num_Dev_Up).MidLine;
case EMA:
    upperBand = reference BollingerBands(price, displace, length, Num_Dev_Dn, Num_Dev_Up, averageType = AverageType.EXPONENTIAL).UpperBand;
    lowerBand = reference BollingerBands(price, displace, length, Num_Dev_Dn, Num_Dev_Up, averageType = AverageType.EXPONENTIAL).LowerBand;
    midLine = reference BollingerBands(price, displace, length, Num_Dev_Dn, Num_Dev_Up, averageType = AverageType.EXPONENTIAL).MidLine;
case LRL:
    upperBand = BB(price, displace, length, Num_Dev_Dn, Num_Dev_Up).Up;
    lowerBand = BB(price, displace, length, Num_Dev_Dn, Num_Dev_Up).Dn;
    midLine = BB(price, displace, length, Num_Dev_Dn, Num_Dev_Up).Mid;
}

def w = (upperBand - lowerBand) / midLine * 100;
def b = Highest(w, BLength);
def s = Lowest(w, SLength);

plot SqEnter = if w <= s
                then 0
                else Double.NaN;
SqEnter.SetPaintingStrategy(PaintingStrategy.POINTS);
SqEnter.SetLineWeight(4);
SqEnter.SetDefaultColor(Color.YELLOW);
plot SqExit = if w[1] <= s[1] and w > s
               then 0
               else Double.NaN;
SqExit.SetPaintingStrategy(PaintingStrategy.POINTS);
SqExit.SetLineWeight(4);
SqExit.SetDefaultColor(Color.GREEN);

AddLabel(SqEnter or SqExit, "In Squeeze");

# Momentum
plot M = ExpAverage(price - price[MDetrend], fastEMA);
M.SetPaintingStrategy(PaintingStrategy.HISTOGRAM);
M.SetLineWeight(5);
M.AssignValueColor(if M < 0 and M > M[1]
                         then Color.LIGHT_GREEN
                         else if M > 0 and M > M[1]
                         then Color.GREEN
                         else if M > 0 and M < M[1]
                         then Color.BLUE
                         else Color.RED);
plot SlowM = ExpAverage(M, slowEMA);
SlowM.SetPaintingStrategy(PaintingStrategy.HISTOGRAM);
SlowM.SetLineWeight(5);
SlowM.AssignValueColor(if SlowM < 0 and SlowM > SlowM[1]
                             then Color.LIGHT_GREEN
                             else if SlowM > 0 and SlowM > SlowM[1]
                             then Color.GREEN
                             else if SlowM > 0 and SlowM < SlowM[1]
                             then Color.BLUE
                             else Color.RED);

plot zero = if IsNaN(close)
             then Double.NaN
             else if IsNaN(SqEnter) or IsNaN(SqExit) then 0 else Double.NaN;
zero.SetPaintingStrategy(PaintingStrategy.POINTS);
zero.SetLineWeight(3);
zero.SetDefaultColor(Color.BLUE);

# Divergence
def mean = Inertia(HL2, length);
def lowestLow = if low > mean
                   then Double.NaN
                   else if low crosses below mean
                   then low
                   else if low < mean and
                           low < low[1] and
                           low < lowestLow[1]
                   then low
                   else lowestLow[1];
def lowestM = if low > mean
                 then Double.NaN
                 else if M crosses below 0
                 then M
                 else if M < 0 and
                         M < M[1] and
                         M < lowestM[1]
                 then M
                 else lowestM[1];
def Ldivergence = if low <= lowestLow and
                        M > lowestM
                     then 0
                     else Double.NaN;

def highestHigh = if high < mean
                     then Double.NaN
                     else if high crosses above mean
                     then high
                     else if high > mean and
                             high > high[1] and
                             high > highestHigh[1]
                     then high
                     else highestHigh[1];
def HighestM = if high < mean
                  then Double.NaN
                  else if M crosses above 0
                  then M
                  else if M > 0 and
                          M > M[1] and
                          M > HighestM[1]
                  then M
                  else HighestM[1];

def Hdivergence = if high <= highestHigh and
                        M < HighestM
                     then 0
                     else Double.NaN;

AddLabel(SqEnter == 0, "In Squeeze" , if M >= 0 and M > M[1]
                                        then Color.GREEN
                                        else if M > 0 and M < M[1]
                                        then Color.RED
                                        else Color.YELLOW);
AddLabel(SqExit == 0, "In Squeeze" , if M >= 0 and M > M[1]
                                       then Color.GREEN
                                       else if M > 0 and M < M[1]
                                       then Color.RED
                                       else Color.YELLOW);
AddLabel(Ldivergence == 0, "Divergent Low", Color.WHITE);
AddLabel(Hdivergence == 0, "Divergent High", Color.WHITE);

# End Code
Shareable Link
https://tos.mx/po63VnAttachments
Last edited: