Momentum Oscillator with Volatility Squeeze for ThinkorSwim

BenTen

Administrative
Staff member
Staff
VIP
Lifetime
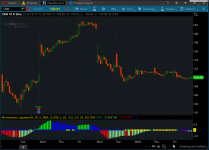
One script but two indicators. A momentum oscillator with volatility squeeze created by Mobius.

dLiAefq.png


Here are his notes:

  • Long Signal: When Momentum is ascending with value at or above 0 and green Point appears at zero line indicating the Volatility squeeze is over and volatility is expanding.
  • Short Signal: When Momentum is descending with value above 0 and first yellow point appears a volatility compression has begun that will likely resolve to a lower value.
  • Neutral: If Momentum is below 0 and Squeeze indicates the direction is indeterminate.
  • Labels: Labels have been added for Squeeze Signals and Divergence Signals. Alter Momentum line to Weighted Scatterplot Loess line. More predictive

thinkScript Code

Rich (BB code):
# Momentum Oscillator with Volatility Squeeze
# Mobius
# V01.06.2013

declare lower;

input MDetrend =  8; #hint MDetrend: Look-back period for Momentum oscillator
input fastEMA  = 20; #hint fastEMA: Exponential MA period for the Momentum oscillator
input slowEMA  =  5; #hint slowEMA: Exponential MA slowing period for the Momo oscillator
input AverageType = {default SMA, EMA, LRL};
input price = close; #hint price: value used in all calculations
input displace = 0;  #hint displace: displaced period for squeeze calculations
input length = 20;   #hint length: periods or length for the squeeze calculations
input Num_Dev_Dn = -2.0; #hint Num_Dev_Dn: Multiplier for the lower BB Band
input Num_Dev_Up = 2.0;  #hint Num_Dev_Up: Multiplier for the upper BB Band
input BLength = 20;      #hint BLength: periods or length for the bandwidth/squeeze calcs
input SLength = 20;      #hint SLength" periods or length for the squeeze calcs

script BB {
    input price = close;
    input displace = 0;
    input length = 20;
    input Numb_Dev_Dn = -2.0;
    input Numb_Dev_Up = 2.0;
    def StDev = StDev(price, length);
    plot Mid = Inertia(price, length);
    plot Up = Mid + (Numb_Dev_Up * StDev);
    plot DN = Mid + (Numb_Dev_Dn * StDev);
}

def upperBand;
def lowerBand;
def midLine;

switch (AverageType) {
case SMA:
    upperBand = reference BollingerBands(price, displace, length, Num_Dev_Dn, Num_Dev_Up).UpperBand;
    lowerBand = reference BollingerBands(price, displace, length, Num_Dev_Dn, Num_Dev_Up).LowerBand;
    midLine = reference BollingerBands(price, displace, length, Num_Dev_Dn, Num_Dev_Up).MidLine;
case EMA:
    upperBand = reference BollingerBands(price, displace, length, Num_Dev_Dn, Num_Dev_Up, averageType = AverageType.EXPONENTIAL).UpperBand;
    lowerBand = reference BollingerBands(price, displace, length, Num_Dev_Dn, Num_Dev_Up, averageType = AverageType.EXPONENTIAL).LowerBand;
    midLine = reference BollingerBands(price, displace, length, Num_Dev_Dn, Num_Dev_Up, averageType = AverageType.EXPONENTIAL).MidLine;
case LRL:
    upperBand = BB(price, displace, length, Num_Dev_Dn, Num_Dev_Up).Up;
    lowerBand = BB(price, displace, length, Num_Dev_Dn, Num_Dev_Up).Dn;
    midLine = BB(price, displace, length, Num_Dev_Dn, Num_Dev_Up).Mid;
}

def w = (upperBand - lowerBand) / midLine * 100;
def b = Highest(w, BLength);
def s = Lowest(w, SLength);

plot SqEnter = if w <= s
                then 0
                else Double.NaN;
SqEnter.SetPaintingStrategy(PaintingStrategy.POINTS);
SqEnter.SetLineWeight(4);
SqEnter.SetDefaultColor(Color.YELLOW);
plot SqExit = if w[1] <= s[1] and w > s
               then 0
               else Double.NaN;
SqExit.SetPaintingStrategy(PaintingStrategy.POINTS);
SqExit.SetLineWeight(4);
SqExit.SetDefaultColor(Color.GREEN);

AddLabel(SqEnter or SqExit, "In Squeeze");

# Momentum
plot M = ExpAverage(price - price[MDetrend], fastEMA);
M.SetPaintingStrategy(PaintingStrategy.HISTOGRAM);
M.SetLineWeight(5);
M.AssignValueColor(if M < 0 and M > M[1]
                         then Color.LIGHT_GREEN
                         else if M > 0 and M > M[1]
                         then Color.GREEN
                         else if M > 0 and M < M[1]
                         then Color.BLUE
                         else Color.RED);
plot SlowM = ExpAverage(M, slowEMA);
SlowM.SetPaintingStrategy(PaintingStrategy.HISTOGRAM);
SlowM.SetLineWeight(5);
SlowM.AssignValueColor(if SlowM < 0 and SlowM > SlowM[1]
                             then Color.LIGHT_GREEN
                             else if SlowM > 0 and SlowM > SlowM[1]
                             then Color.GREEN
                             else if SlowM > 0 and SlowM < SlowM[1]
                             then Color.BLUE
                             else Color.RED);

plot zero = if IsNaN(close)
             then Double.NaN
             else if IsNaN(SqEnter) or IsNaN(SqExit) then 0 else Double.NaN;
zero.SetPaintingStrategy(PaintingStrategy.POINTS);
zero.SetLineWeight(3);
zero.SetDefaultColor(Color.BLUE);

# Divergence
def mean = Inertia(HL2, length);
def lowestLow = if low > mean
                   then Double.NaN
                   else if low crosses below mean
                   then low
                   else if low < mean and
                           low < low[1] and
                           low < lowestLow[1]
                   then low
                   else lowestLow[1];
def lowestM = if low > mean
                 then Double.NaN
                 else if M crosses below 0
                 then M
                 else if M < 0 and
                         M < M[1] and
                         M < lowestM[1]
                 then M
                 else lowestM[1];
def Ldivergence = if low <= lowestLow and
                        M > lowestM
                     then 0
                     else Double.NaN;

def highestHigh = if high < mean
                     then Double.NaN
                     else if high crosses above mean
                     then high
                     else if high > mean and
                             high > high[1] and
                             high > highestHigh[1]
                     then high
                     else highestHigh[1];
def HighestM = if high < mean
                  then Double.NaN
                  else if M crosses above 0
                  then M
                  else if M > 0 and
                          M > M[1] and
                          M > HighestM[1]
                  then M
                  else HighestM[1];

def Hdivergence = if high <= highestHigh and
                        M < HighestM
                     then 0
                     else Double.NaN;

AddLabel(SqEnter == 0, "In Squeeze" , if M >= 0 and M > M[1]
                                        then Color.GREEN
                                        else if M > 0 and M < M[1]
                                        then Color.RED
                                        else Color.YELLOW);
AddLabel(SqExit == 0, "In Squeeze" , if M >= 0 and M > M[1]
                                       then Color.GREEN
                                       else if M > 0 and M < M[1]
                                       then Color.RED
                                       else Color.YELLOW);
AddLabel(Ldivergence == 0, "Divergent Low", Color.WHITE);
AddLabel(Hdivergence == 0, "Divergent High", Color.WHITE);

# End Code

Shareable Link

https://tos.mx/po63Vn
 

Attachments

  • dLiAefq.png
    dLiAefq.png
    323 KB · Views: 262
Last edited:

Join useThinkScript to post your question to a community of 21,000+ developers and traders.

@BenTen Can you explian what is meant by "Divergent Low" and "Divergent High" labels? Does "Divergent Low" means bullish or bearish?

So "divergent low" is bearish and "divergent high" is bullish?
 
Last edited by a moderator:
@BenTen Can you explian what is meant by "Divergent Low" and "Divergent High" labels? Does "Divergent Low" means bullish or bearish?

So "divergent low" is bearish and "divergent high" is bullish?
There is no bullish or bearish, These are terms used in trending strategies.

Divergences are used in mean reversion strategies.
A Divergent Low is a negative divergence in a bearish setup of lower low prices and where the oscillator displays a positive divergence,

If your question is: Can the Divergent Low be used to foretell a bullish trend. Yes, you can, when used in combination with other non-collinear indicators ,
 
Last edited:
One script but two indicators. A momentum oscillator with volatility squeeze created by Mobius.

View attachment 4620

Here are his notes:


thinkScript Code

Rich (BB code):
# Momentum Oscillator with Volatility Squeeze
# Mobius
# V01.06.2013

declare lower;

input MDetrend =  8; #hint MDetrend: Look-back period for Momentum oscillator
input fastEMA  = 20; #hint fastEMA: Exponential MA period for the Momentum oscillator
input slowEMA  =  5; #hint slowEMA: Exponential MA slowing period for the Momo oscillator
input AverageType = {default SMA, EMA, LRL};
input price = close; #hint price: value used in all calculations
input displace = 0;  #hint displace: displaced period for squeeze calculations
input length = 20;   #hint length: periods or length for the squeeze calculations
input Num_Dev_Dn = -2.0; #hint Num_Dev_Dn: Multiplier for the lower BB Band
input Num_Dev_Up = 2.0;  #hint Num_Dev_Up: Multiplier for the upper BB Band
input BLength = 20;      #hint BLength: periods or length for the bandwidth/squeeze calcs
input SLength = 20;      #hint SLength" periods or length for the squeeze calcs

script BB {
    input price = close;
    input displace = 0;
    input length = 20;
    input Numb_Dev_Dn = -2.0;
    input Numb_Dev_Up = 2.0;
    def StDev = StDev(price, length);
    plot Mid = Inertia(price, length);
    plot Up = Mid + (Numb_Dev_Up * StDev);
    plot DN = Mid + (Numb_Dev_Dn * StDev);
}

def upperBand;
def lowerBand;
def midLine;

switch (AverageType) {
case SMA:
    upperBand = reference BollingerBands(price, displace, length, Num_Dev_Dn, Num_Dev_Up).UpperBand;
    lowerBand = reference BollingerBands(price, displace, length, Num_Dev_Dn, Num_Dev_Up).LowerBand;
    midLine = reference BollingerBands(price, displace, length, Num_Dev_Dn, Num_Dev_Up).MidLine;
case EMA:
    upperBand = reference BollingerBands(price, displace, length, Num_Dev_Dn, Num_Dev_Up, averageType = AverageType.EXPONENTIAL).UpperBand;
    lowerBand = reference BollingerBands(price, displace, length, Num_Dev_Dn, Num_Dev_Up, averageType = AverageType.EXPONENTIAL).LowerBand;
    midLine = reference BollingerBands(price, displace, length, Num_Dev_Dn, Num_Dev_Up, averageType = AverageType.EXPONENTIAL).MidLine;
case LRL:
    upperBand = BB(price, displace, length, Num_Dev_Dn, Num_Dev_Up).Up;
    lowerBand = BB(price, displace, length, Num_Dev_Dn, Num_Dev_Up).Dn;
    midLine = BB(price, displace, length, Num_Dev_Dn, Num_Dev_Up).Mid;
}

def w = (upperBand - lowerBand) / midLine * 100;
def b = Highest(w, BLength);
def s = Lowest(w, SLength);

plot SqEnter = if w <= s
                then 0
                else Double.NaN;
SqEnter.SetPaintingStrategy(PaintingStrategy.POINTS);
SqEnter.SetLineWeight(4);
SqEnter.SetDefaultColor(Color.YELLOW);
plot SqExit = if w[1] <= s[1] and w > s
               then 0
               else Double.NaN;
SqExit.SetPaintingStrategy(PaintingStrategy.POINTS);
SqExit.SetLineWeight(4);
SqExit.SetDefaultColor(Color.GREEN);

AddLabel(SqEnter or SqExit, "In Squeeze");

# Momentum
plot M = ExpAverage(price - price[MDetrend], fastEMA);
M.SetPaintingStrategy(PaintingStrategy.HISTOGRAM);
M.SetLineWeight(5);
M.AssignValueColor(if M < 0 and M > M[1]
                         then Color.LIGHT_GREEN
                         else if M > 0 and M > M[1]
                         then Color.GREEN
                         else if M > 0 and M < M[1]
                         then Color.BLUE
                         else Color.RED);
plot SlowM = ExpAverage(M, slowEMA);
SlowM.SetPaintingStrategy(PaintingStrategy.HISTOGRAM);
SlowM.SetLineWeight(5);
SlowM.AssignValueColor(if SlowM < 0 and SlowM > SlowM[1]
                             then Color.LIGHT_GREEN
                             else if SlowM > 0 and SlowM > SlowM[1]
                             then Color.GREEN
                             else if SlowM > 0 and SlowM < SlowM[1]
                             then Color.BLUE
                             else Color.RED);

plot zero = if IsNaN(close)
             then Double.NaN
             else if IsNaN(SqEnter) or IsNaN(SqExit) then 0 else Double.NaN;
zero.SetPaintingStrategy(PaintingStrategy.POINTS);
zero.SetLineWeight(3);
zero.SetDefaultColor(Color.BLUE);

# Divergence
def mean = Inertia(HL2, length);
def lowestLow = if low > mean
                   then Double.NaN
                   else if low crosses below mean
                   then low
                   else if low < mean and
                           low < low[1] and
                           low < lowestLow[1]
                   then low
                   else lowestLow[1];
def lowestM = if low > mean
                 then Double.NaN
                 else if M crosses below 0
                 then M
                 else if M < 0 and
                         M < M[1] and
                         M < lowestM[1]
                 then M
                 else lowestM[1];
def Ldivergence = if low <= lowestLow and
                        M > lowestM
                     then 0
                     else Double.NaN;

def highestHigh = if high < mean
                     then Double.NaN
                     else if high crosses above mean
                     then high
                     else if high > mean and
                             high > high[1] and
                             high > highestHigh[1]
                     then high
                     else highestHigh[1];
def HighestM = if high < mean
                  then Double.NaN
                  else if M crosses above 0
                  then M
                  else if M > 0 and
                          M > M[1] and
                          M > HighestM[1]
                  then M
                  else HighestM[1];

def Hdivergence = if high <= highestHigh and
                        M < HighestM
                     then 0
                     else Double.NaN;

AddLabel(SqEnter == 0, "In Squeeze" , if M >= 0 and M > M[1]
                                        then Color.GREEN
                                        else if M > 0 and M < M[1]
                                        then Color.RED
                                        else Color.YELLOW);
AddLabel(SqExit == 0, "In Squeeze" , if M >= 0 and M > M[1]
                                       then Color.GREEN
                                       else if M > 0 and M < M[1]
                                       then Color.RED
                                       else Color.YELLOW);
AddLabel(Ldivergence == 0, "Divergent Low", Color.WHITE);
AddLabel(Hdivergence == 0, "Divergent High", Color.WHITE);

# End Code

Shareable Link

https://tos.mx/po63Vn
Is there anyway to better coincide/match the parameters with the TTM Squeeze?
 
Is there anyway to better coincide/match the parameters with the TTM Squeeze?
The TTM Squeeze is a locked script. So the exact parameters are unknown.
Without having the exact specifications, no it is not possible to "better coincide/match the parameters with the TTM Squeeze"
 

Similar threads

Not the exact question you're looking for?

Start a new thread and receive assistance from our community.

87k+ Posts
244 Online
Create Post

Similar threads

Similar threads

The Market Trading Game Changer

Join 2,500+ subscribers inside the useThinkScript VIP Membership Club
  • Exclusive indicators
  • Proven strategies & setups
  • Private Discord community
  • ‘Buy The Dip’ signal alerts
  • Exclusive members-only content
  • Add-ons and resources
  • 1 full year of unlimited support

Frequently Asked Questions

What is useThinkScript?

useThinkScript is the #1 community of stock market investors using indicators and other tools to power their trading strategies. Traders of all skill levels use our forums to learn about scripting and indicators, help each other, and discover new ways to gain an edge in the markets.

How do I get started?

We get it. Our forum can be intimidating, if not overwhelming. With thousands of topics, tens of thousands of posts, our community has created an incredibly deep knowledge base for stock traders. No one can ever exhaust every resource provided on our site.

If you are new, or just looking for guidance, here are some helpful links to get you started.

What are the benefits of VIP Membership?
VIP members get exclusive access to these proven and tested premium indicators: Buy the Dip, Advanced Market Moves 2.0, Take Profit, and Volatility Trading Range. In addition, VIP members get access to over 50 VIP-only custom indicators, add-ons, and strategies, private VIP-only forums, private Discord channel to discuss trades and strategies in real-time, customer support, trade alerts, and much more. Learn all about VIP membership here.
How can I access the premium indicators?
To access the premium indicators, which are plug and play ready, sign up for VIP membership here.
Back
Top