RedToGreen
Active member
Edit: code Updated 6-27-23
Edit for name change.
"The Phoenix" was partially born from @Christopher84 and his Study, Confirmation candles.
This uses some other study's than CC and is measuring the Average of Momentum (Consensus) Whereas "Consensus" can be quite low but a valid long entry may setup
This is by no means finished, though I am satisfied in it's current state.
WL columns are needed.
Let me know what you think - I'm open to any suggestions
Enjoy
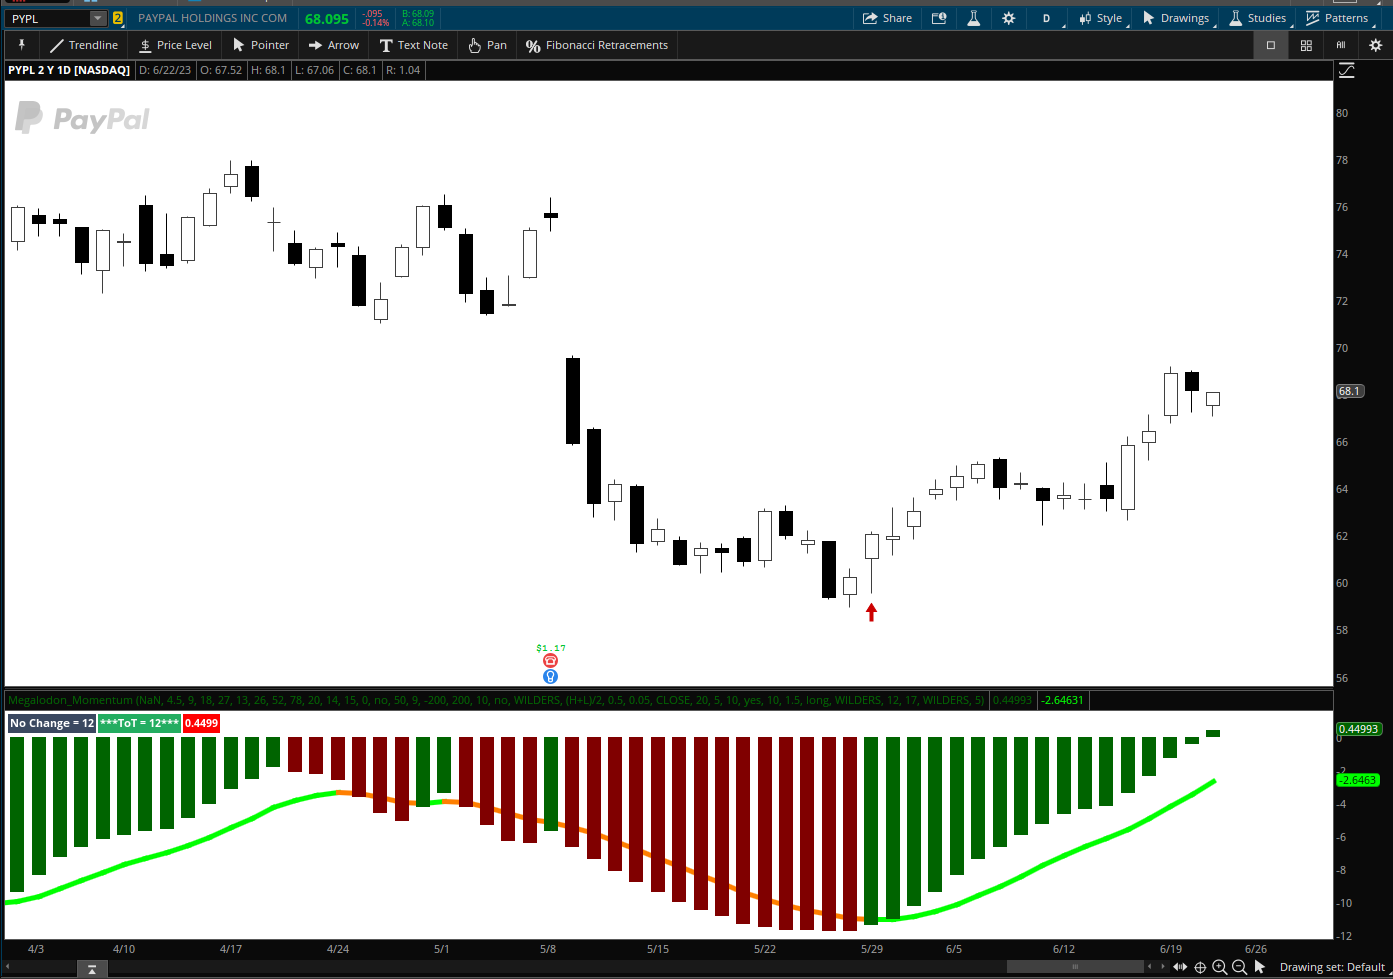
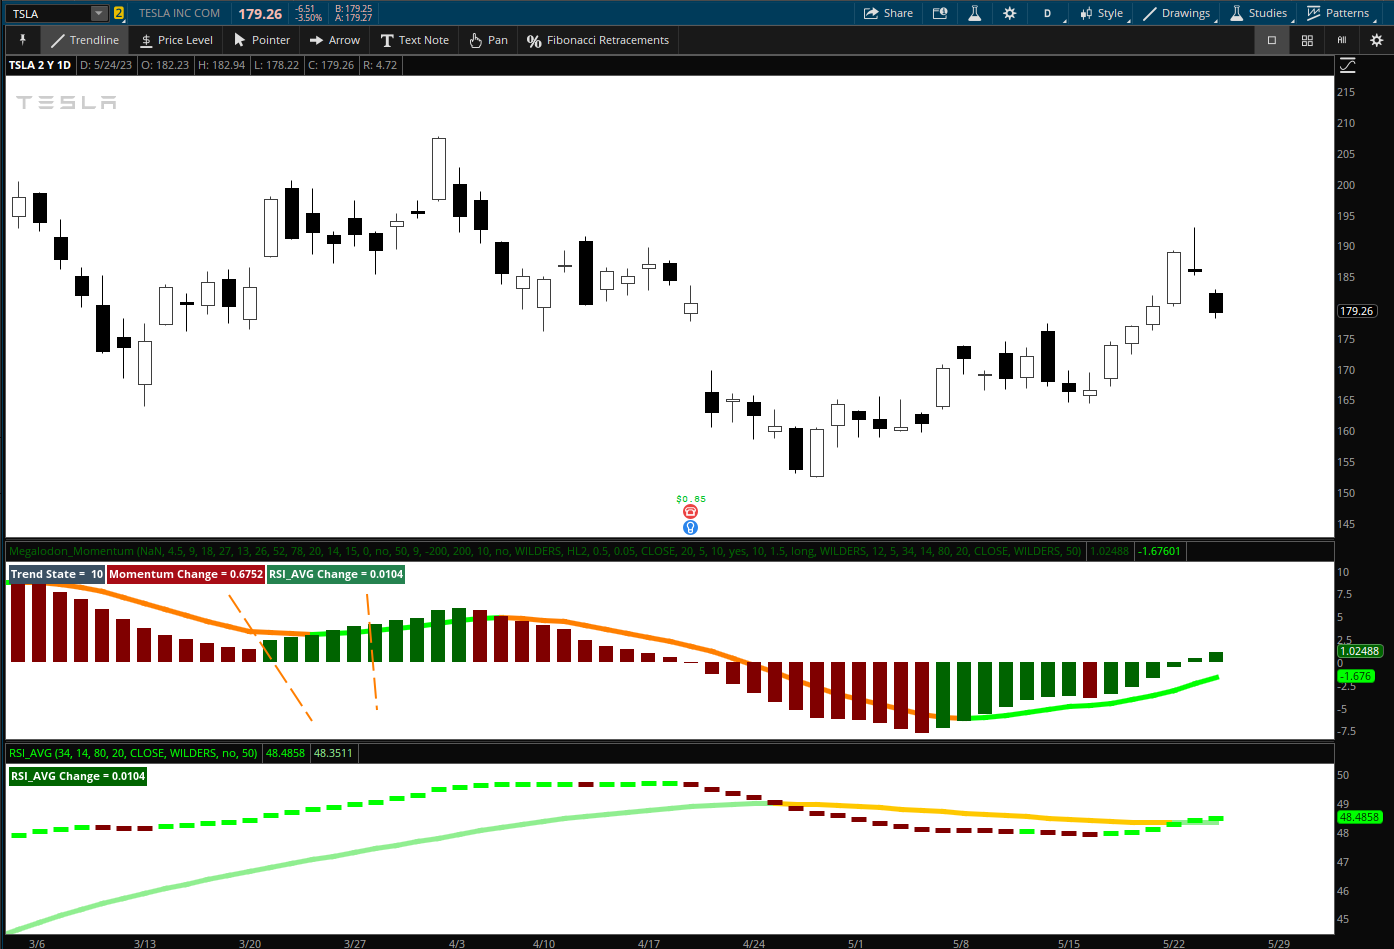
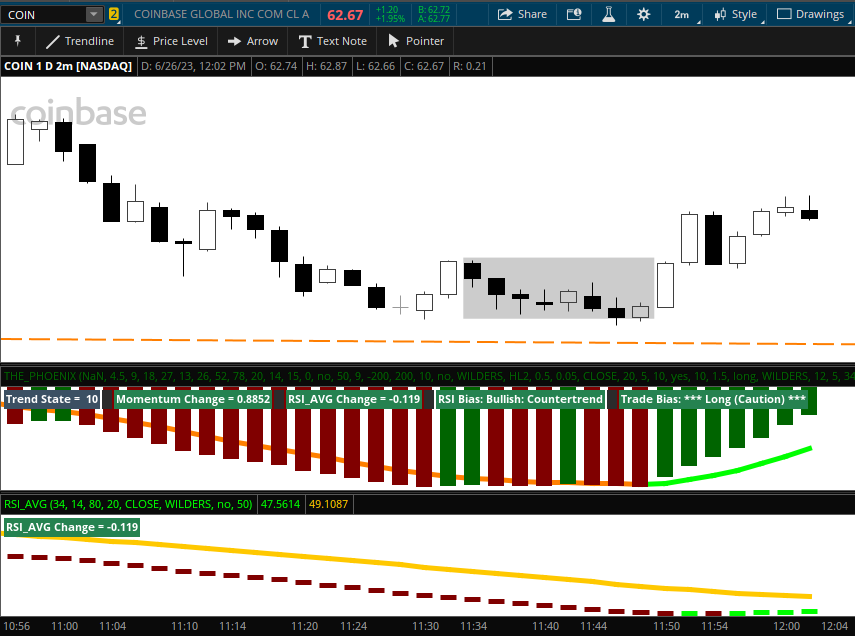
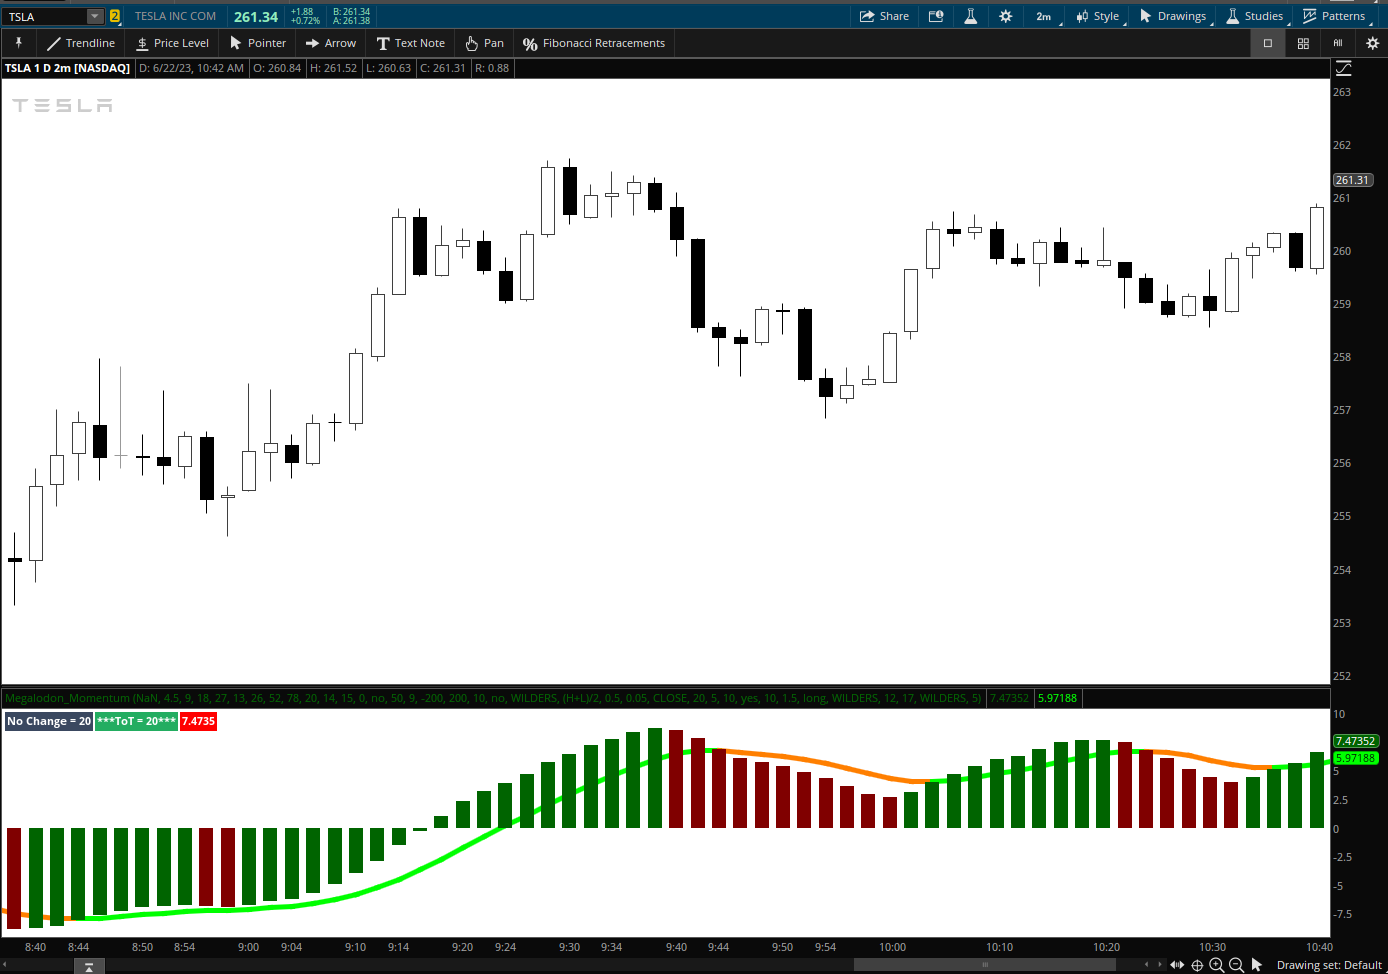
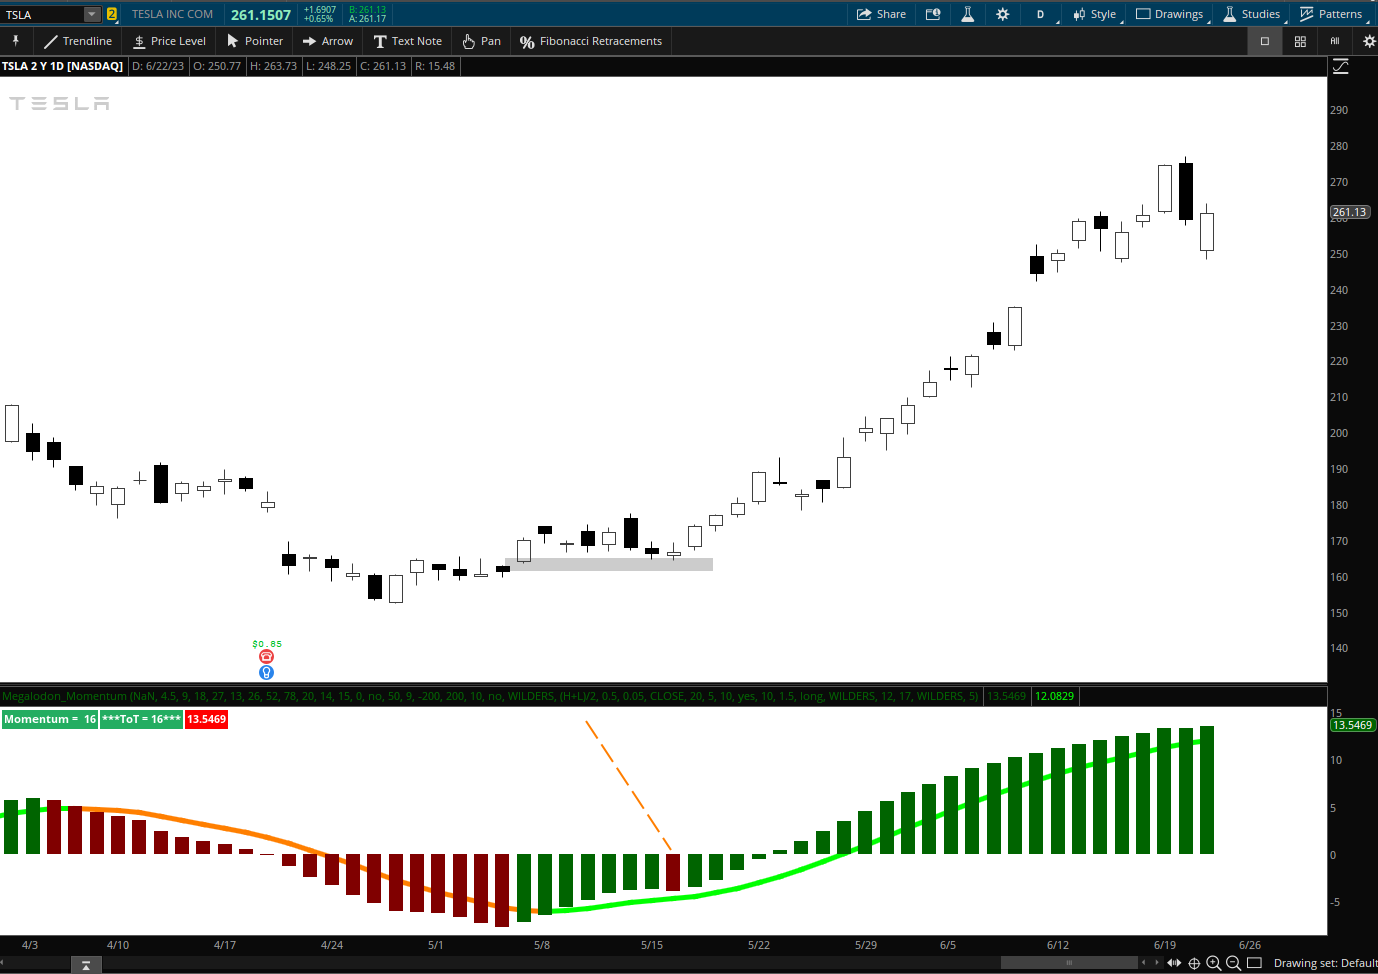
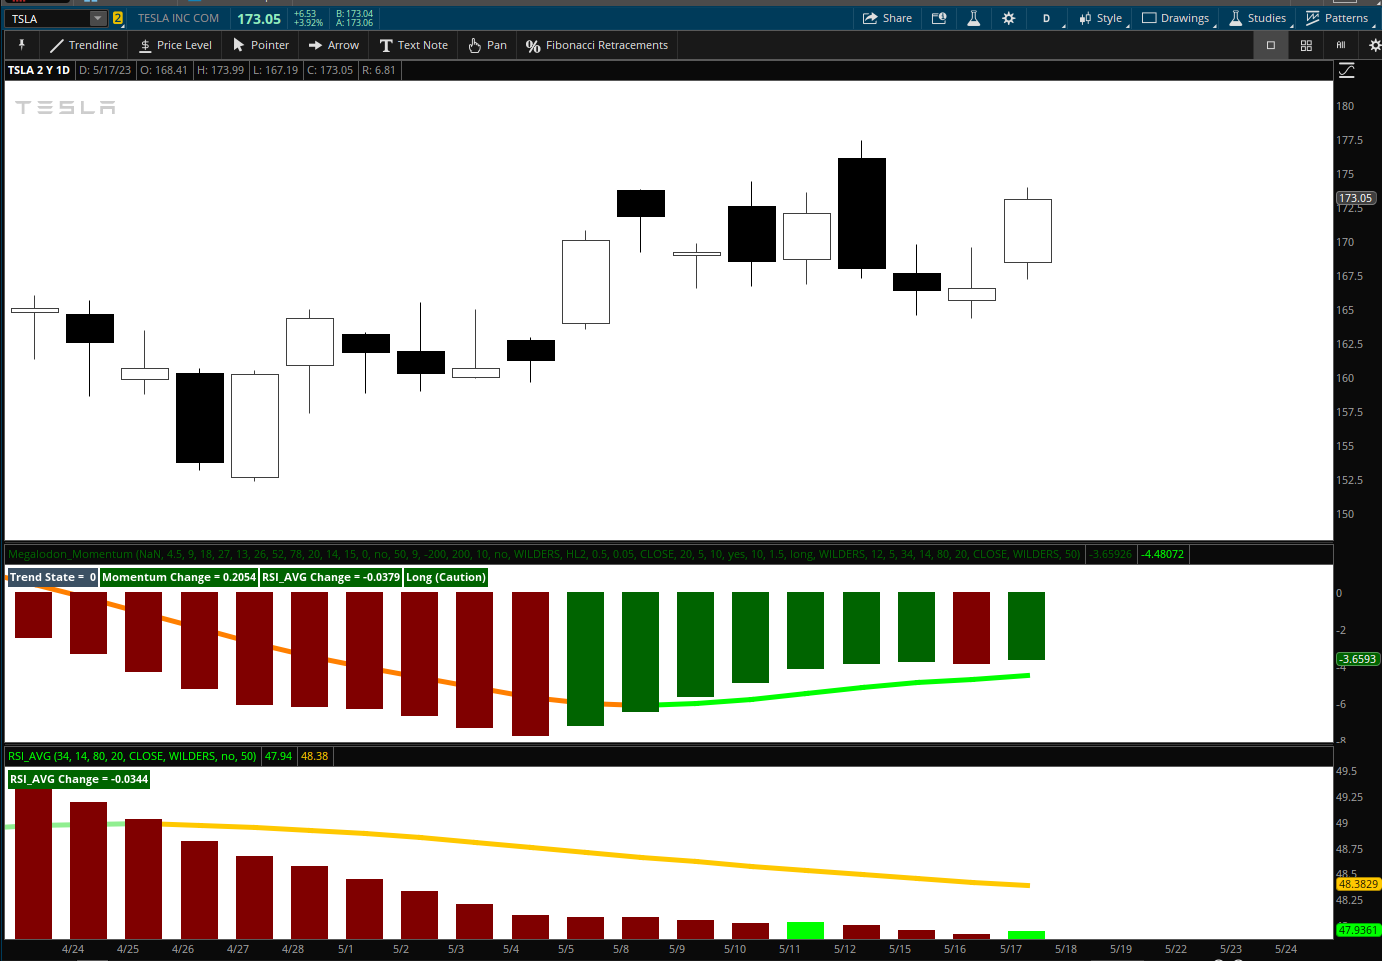
TSLA 2 Min
Edit for name change.
"The Phoenix" was partially born from @Christopher84 and his Study, Confirmation candles.
This uses some other study's than CC and is measuring the Average of Momentum (Consensus) Whereas "Consensus" can be quite low but a valid long entry may setup
This is by no means finished, though I am satisfied in it's current state.
WL columns are needed.
Let me know what you think - I'm open to any suggestions
Enjoy
TSLA 2 Min
Code:
#THE PHOENIX v1.3 Created by Hypnotic Options AKA, RedToGreen
#7-10-2023
# Updated - deleted un-needed code,
#Added label reflecting the change of MOM avg line
#Trend State = (Longs - Shorts) AKA "Consensus"
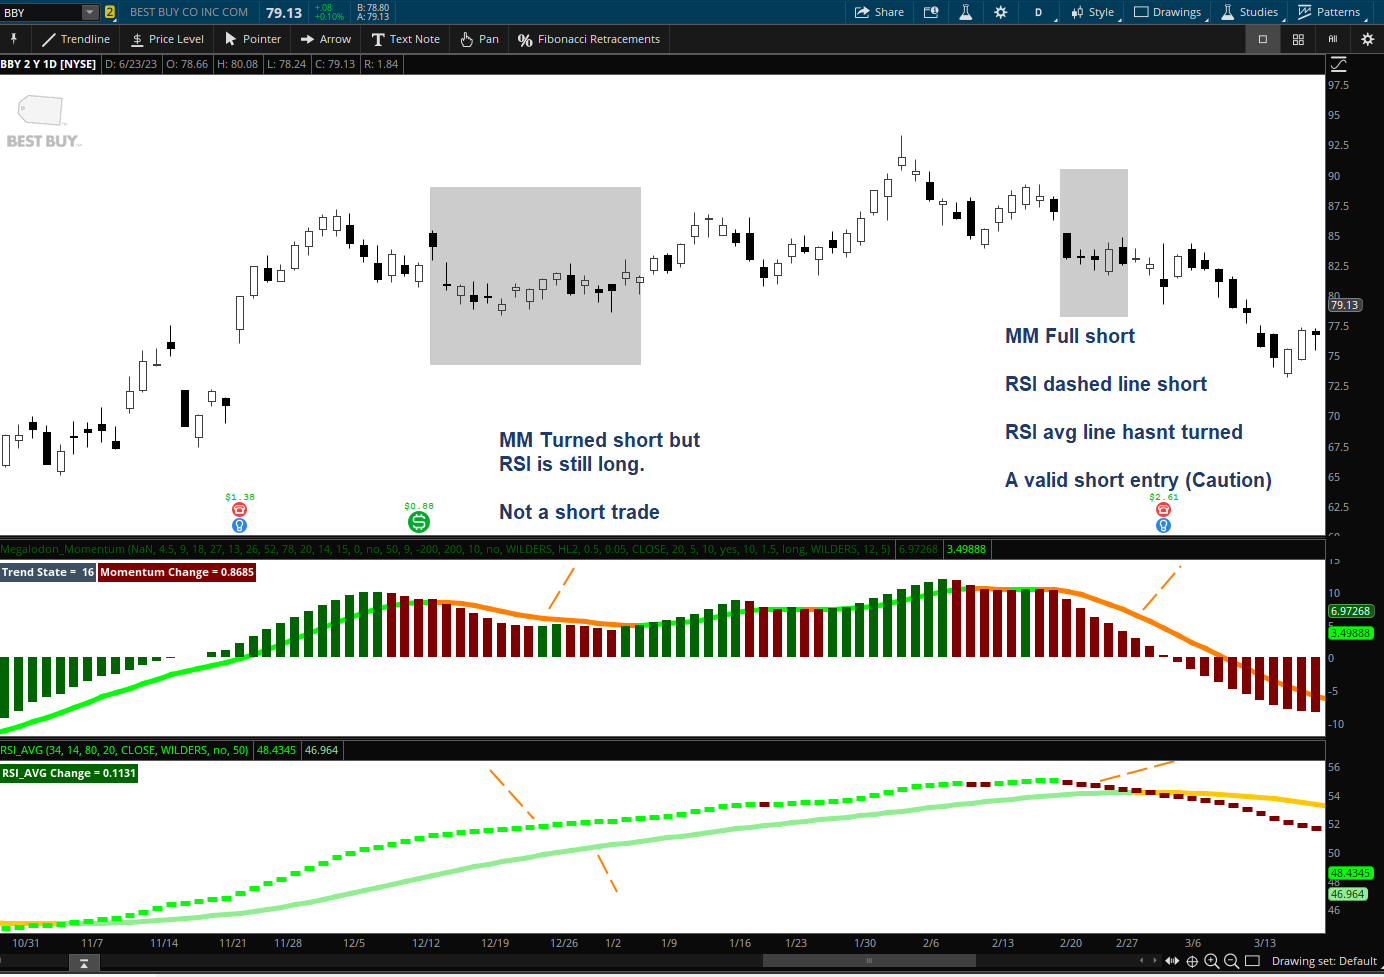
#6-24-2023 Added RSI AVG Study with signals
#6-25-2023 Added Conditions to RSI label to reflect it's current status
# Indicator Officially Renamed to "The Phoenix"
declare lower;
# TK Dragon Histogram 12-31-2022 by HypnoticOptions
input DN = Double.NaN;
input T4 = 4.5;
input T9 = 9;
input T18 = 18;
input T27 = 27;
input K13 = 13;
input K26 = 26;
input K52 = 52;
input K78 = 78;
########################################################
# Tenkan_Kijun #
##################################################
def Tenkan4 = (Highest(high, T4) + Lowest(low, T4)) / 2 ;
def Kijun13 = (Highest(high, K13) + Lowest(low, K13)) / 2;
def A2 = (Tenkan4[K13] + Kijun13[K13]) / 2;
def B2 = (Highest(high[K13], 2 * K13) + Lowest(low[K13], 2 * K13)) / 2;
#plot Chikou = close[-K13];
def Tenkan9 = (Highest(high, T9) + Lowest(low, T9)) / 2 ;
def Kijun26 = (Highest(high, K26) + Lowest(low, K26)) / 2;
def A3 = (Tenkan9[K26] + Kijun26[K26]) / 2;
def B3 = (Highest(high[K26], 2 * K26) + Lowest(low[K26], 2 * K26)) / 2;
def Tenkan18 = (Highest(high, T18) + Lowest(low, T18)) / 2;
def Kijun52 = (Highest(high, K52) + Lowest(low, K52)) / 2;
def A4 = (Tenkan18[K52] + Kijun52[K52]) / 2;
def B4 = (Highest(high[K52], 2 * K52) + Lowest(low[K52], 2 * K52)) / 2;
def Tenkan27 = (Highest(high, T27) + Lowest(low, T27)) / 2;
def Kijun78 = (Highest(high, K78) + Lowest(low, K78)) / 2;
def A5 = (Tenkan27[K78] + Kijun78[K78]) / 2;
def B5 = (Highest(high[K78], 2 * K78) + Lowest(low[K78], 2 * K78)) / 2;
#####################################################
# CHIKOU #
#######################################################
def Chikou13 = close[-K13] ;
def Chikou26 = close[-K26] ;
def Chikou52 = close[-K52] ;
def Chikou78 = close[-K78] ;
#def Lagg2 = Chikou26[26] - Chikou13[26];
#def Lagg3 = Chikou52[52] - Chikou26[52];
#def Lagg4 = Chikou78[78] - Chikou52[78];
########################################################
# Longs #
##################################################
def TKL4_13 = Tenkan4 > Kijun13; #***
def TKL4_52 = Tenkan4 > Kijun52;
def FutureBullishCloudB = A2[-13] > B2[-13];
def FutureBullishCloudC = A3[-26] > B3[-26];
def FutureBullishCloudD = A4[-52] > B4[-52];
def FutureBullishCloudE = A5[-78] > B5[-78];
def Lag2L = Chikou26[26] > Chikou13[26];
def Lag3L = Chikou52[52] > Chikou26[52];
def Lag4L = Chikou78[78] > Chikou52[78];
########################################################
# Shorts #
##################################################
def TKS4_13 = Tenkan4 < Kijun13; #***
def TKS4_52 = Tenkan4 < Kijun52;
def FutureBearishCloudB = A2[-13] < B2[-13];
def FutureBearishCloudC = A3[-26] < B3[-26];
def FutureBearishCloudD = A4[-52] < B4[-52];
def FutureBearishCloudE = A5[-78] < B5[-78];
def Lag2S = Chikou26[26] < Chikou13[26];
def Lag3S = Chikou52[52] < Chikou26[52];
def Lag4S = Chikou78[78] < Chikou52[78];
#################################################
#RGMB VOLUME by Hypnotic_Options AKA - Me
input LengthV5 = 20;
input lengthV = 14;
input length_mom = 15;
input lengthVolAVG = 6;
input displace = 0;
input showBreakoutSignals = no;
#input ShowChartLabels = yes;
def ZeroLine = 0;
def O = open;
def H = high;
def C = close;
def L = low;
def V = volume;
def buying = V * (C - L) / (H - L);
def selling = V * (H - C) / (H - L);
#Buy/sell difference================================
def buy1 = buying + buying[1];
def buy2 = buying + buying[1] + buying[2];
def buy3 = buying + buying[1] + buying[2] + buying[3];
def buy4 = buying + buying[1] + buying[2] + buying[3] + buying[4];
def buy5 = buying + buying[1] + buying[2] + buying[3] + buying[4] + buying[5];
def buy6 = buying + buying[1] + buying[2] + buying[3] + buying[4] + buying[5] + buying[6];
def buy7 = buying + buying[1] + buying[2] + buying[3] + buying[4] + buying[5] + buying[6] + buying[7];
def buy8 = buying + buying[1] + buying[2] + buying[3] + buying[4] + buying[5] + buying[6] + buying[7] + buying[8];
def buy9 = buying + buying[1] + buying[2] + buying[3] + buying[4] + buying[5] + buying[6] + buying[7] + buying[8] + buying[9];
def buy10 = buying + buying[1] + buying[2] + buying[3] + buying[4] + buying[5] + buying[6] + buying[7] + buying[8] + buying[9] + buying[10];
def curbuyVolume5 = (buy1 + buy2 + buy3 + buy4 + buy5) / 5;
def curbuyvol10 = (buy1 + buy2 + buy3 + buy4 + buy5 + buy6 + buy7 + buy8 + buy9 + buy10) / 10;
def sell1 = selling + selling[1];
def sell2 = selling + selling[1] + selling[2];
def sell3 = selling + selling[1] + selling[2] + selling[3];
def sell4 = selling + selling[1] + selling[2] + selling[3] + selling[4];
def sell5 = selling + selling[1] + selling[2] + selling[3] + selling[4] + selling[5];
def sell6 = selling + selling[1] + selling[2] + selling[3] + selling[4] + selling[5] + selling[6];
def sell7 = selling + selling[1] + selling[2] + selling[3] + selling[4] + selling[5] + selling[6] + selling[7];
def sell8 = selling + selling[1] + selling[2] + selling[3] + selling[4] + selling[5] + selling[6] + selling[7] + selling[8];
def sell9 = selling + selling[1] + selling[2] + selling[3] + selling[4] + selling[5] + selling[6] + selling[7] + selling[8] + selling[9];
def sell10 = selling + selling[1] + selling[2] + selling[3] + selling[4] + selling[5] + selling[6] + selling[7] + selling[8] + selling[9] + selling[10];
def cursellVolume5 = (sell1 + sell2 + sell3 + sell4 + sell5) / 5;
def cursellvol10 = (sell1 + sell2 + sell3 + sell4 + sell5 + sell6 + sell7 + sell8 + sell9 + sell10) / 10;
def Sellbuydiff5 = (curbuyVolume5 - cursellVolume5);
def Sellbuydiff10 = (curbuyvol10 - cursellvol10);
def v5Avg = WildersAverage(curbuyVolume5, LengthV5) ;
def Buyline = WildersAverage(curbuyvol10[-displace], lengthV);
def Sellline = WildersAverage(cursellvol10[-displace], lengthV);
def Buylineavg = wildersAverage(buyline[-displace], lengthVolAVG) ;
def Selllineavg = wildersAverage(sellline[-displace], lengthVolAVG) ;
#def BuyLineAVG_Change = (Buylineavg - Buylineavg[1]);
###########################
# CCI AVERAGE #
###########################
input cciLength = 50;
input cciAvgLength = 9;
input over_sold = -200;
input over_bought = 200;
###
def pricecci = close + low + high;
def linDev = LinDev(pricecci, cciLength);
def CCI = if linDev == 0 then 0 else (pricecci - Average(pricecci, cciLength)) / linDev / 0.015;
###
def CCIAvg = Average(CCI, cciAvgLength);
def OverBought = over_bought;
def OverSold = over_sold;
def CCI_X_Up = CCI crosses above ZeroLine within 3 bars;
def CCI_X_Down = CCI crosses below ZeroLine within 3 bars;
#AddLabel(yes, " " + ccicountG + " ", color.DARK_GREEN);
#AddLabel(yes, " " + ccicountR + " ", color.DARK_RED);
#addlabel(yes, " ", color.DARK_GRAY);
###################
# DMI OSC #
###################
input lengthdmi = 10;
input averageTypedmi = AverageType.WILDERS;
input DMI_L = 8;
def diPlus = DMI(lengthdmi, averageTypedmi)."DI+";
def diMinus = DMI(lengthdmi, averageTypedmi)."DI-";
def Osc = diPlus - diMinus;
def DMI_A = wildersAverage(osc, DMI_L);
#########################
# VOLATILITY STOP
#########################
## Volatility Trailing Stop
## Version 1.1
## By Steve Coombs
## This ATR Trailing Stop is calculated using the Highest Close in an uptrend or
## the Lowest Close in a downtrend, rather than just the Close that is used
## in the standard TOS ATRTrailing Stop
#input StopLabel = yes; #ATRStop Label is Stop value from yesterdays ATR calculation
input ShowStop = yes;
input ATRPeriod = 10;
input ATRFactor = 1.5;
input firstTrade = {default long, short};
input averageType = AverageType.WILDERS;
Assert(ATRFactor > 0, "'atr factor' must be positive: " + ATRFactor);
def trueRange = TrueRange(high, close, low);
def loss = ATRFactor * MovingAverage(averageType, trueRange, ATRPeriod);
def state = {default init, long, short};
def trail;
def mclose;
switch (state[1]) {
case init:
if (!IsNaN(loss)) {
switch (firstTrade) {
case long:
state = state.long;
mclose = close;
trail = close - loss;
case short:
state = state.short;
mclose = close;
trail = close + loss;
}
} else {
state = state.init;
trail = Double.NaN;
mclose = Double.NaN;
}
case long:
if (close > trail[1]) {
state = state.long;
mclose = Max(mclose[1], close);
trail = Max (trail[1], mclose - loss);
} else {
state = state.short;
mclose = close;
trail = mclose + loss;
}
case short:
if (close < trail[1]) {
state = state.short;
mclose = Min(mclose[1], close);
trail = Min(trail[1], mclose + loss);
} else {
state = state.long;
mclose = close + 0;
trail = mclose - loss;
}
}
###################################################
#### CMF ######
input CMFL = 15;
input CMFL_Avg = 6;
def tmp_var =
if high == low then
volume
else
(close - low - (high - close)) / (high - low) * volume
;
def sum_close = Sum(tmp_var, CMFL);
def total = Sum(volume, CMFL);
def CMF =
if total == 0 then
0
else
sum_close / total
;
def CMF_P = WildersAverage(CMF, CMFL);
def CMF_P_AVG = WildersAverage(cmf_P, CMFL_Avg) ;
######### ROC ##########################
#
# TD Ameritrade IP Company, Inc. (c) 2008-2023
#
input lengthOBV = 8;
def OBV = TotalSum(Sign(close - close[1]) * volume);
def OBV_AVG = wildersAverage(obv,lengthOBV);
##################
####### MONEYFlow ######################
#
# TD Ameritrade IP Company, Inc. (c) 2008-2023
#
input priceM = close;
input flowL = 5;
def MF = TotalSum(if pricem < pricem[1] then -pricem * volume else if pricem > pricem[1] then pricem * volume else 0);
def Flow = wildersAverage(MF, flowL);
def MFlow_Up = flow > flow[1];
def MFlow_Dwn = flow < flow[1];
##############################
# filename: _MAMA_MDI_Combo_Lower_
# Here is Ehler's MAMA:
# hint: <b>Ehler's Mesa Adaptive Moving Average</b> using Ray's clean version
# of the homodyne discriminator.
#
# MIT License
# Copyright (c) <2010> <Radford Juang>
#
#Permission is hereby granted, free of charge, to any person obtaining a copy
#of this software and associated documentation files (the "Software"), to deal
#in the Software without restriction, including without limitation the rights
#to use, copy, modify, merge, publish, distribute, sublicense, and/or sell
#copies of the Software, and to permit persons to whom the Software is
#furnished to do so, subject to the following conditions:
#
#The above copyright notice and this permission notice shall be included in
#all copies or substantial portions of the Software.
#
#THE SOFTWARE IS PROVIDED "AS IS", WITHOUT WARRANTY OF ANY KIND, EXPRESS OR
#IMPLIED, INCLUDING BUT NOT LIMITED TO THE WARRANTIES OF MERCHANTABILITY,
#FITNESS FOR A PARTICULAR PURPOSE AND NONINFRINGEMENT. IN NO EVENT SHALL THE
#AUTHORS OR COPYRIGHT HOLDERS BE LIABLE FOR ANY CLAIM, DAMAGES OR OTHER
#LIABILITY, WHETHER IN AN ACTION OF CONTRACT, TORT OR OTHERWISE, ARISING FROM,
#OUT OF OR IN CONNECTION WITH THE SOFTWARE OR THE USE OR OTHER DEALINGS IN
#THE SOFTWARE.
#
script WMA_Smooth {
input price = hl2;
plot smooth = (4 * price
+ 3 * price[1]
+ 2 * price[2]
+ price[3]) / 10;
}
script Phase_Accumulation {
# This is Ehler's Phase Accumulation code. It has a full cycle delay.
# However, it computes the correction factor to a very high degree.
#
input price = hl2;
rec Smooth;
rec Detrender;
rec Period;
rec Q1;
rec I1;
rec I1p;
rec Q1p;
rec Phase1;
rec Phase;
rec DeltaPhase;
rec DeltaPhase1;
rec InstPeriod1;
rec InstPeriod;
def CorrectionFactor;
if BarNumber() <= 5
then {
Period = 0;
Smooth = 0;
Detrender = 0;
CorrectionFactor = 0;
Q1 = 0;
I1 = 0;
Q1p = 0;
I1p = 0;
Phase = 0;
Phase1 = 0;
DeltaPhase1 = 0;
DeltaPhase = 0;
InstPeriod = 0;
InstPeriod1 = 0;
} else {
CorrectionFactor = 0.075 * Period[1] + 0.54;
# Smooth and detrend my smoothed signal:
Smooth = WMA_Smooth(price);
Detrender = ( 0.0962 * Smooth
+ 0.5769 * Smooth[2]
- 0.5769 * Smooth[4]
- 0.0962 * Smooth[6] ) * CorrectionFactor;
# Compute Quadrature and Phase of Detrended signal:
Q1p = ( 0.0962 * Detrender
+ 0.5769 * Detrender[2]
- 0.5769 * Detrender[4]
- 0.0962 * Detrender[6] ) * CorrectionFactor;
I1p = Detrender[3];
# Smooth out Quadrature and Phase:
I1 = 0.15 * I1p + 0.85 * I1p[1];
Q1 = 0.15 * Q1p + 0.85 * Q1p[1];
# Determine Phase
if I1 != 0
then {
# Normally, ATAN gives results from -pi/2 to pi/2.
# We need to map this to circular coordinates 0 to 2pi
if Q1 >= 0 and I1 > 0
then { # Quarant 1
Phase1 = ATan(AbsValue(Q1 / I1));
} else if Q1 >= 0 and I1 < 0
then { # Quadrant 2
Phase1 = Double.Pi - ATan(AbsValue(Q1 / I1));
} else if Q1 < 0 and I1 < 0
then { # Quadrant 3
Phase1 = Double.Pi + ATan(AbsValue(Q1 / I1));
} else { # Quadrant 4
Phase1 = 2 * Double.Pi - ATan(AbsValue(Q1 / I1));
}
} else if Q1 > 0
then { # I1 == 0, Q1 is positive
Phase1 = Double.Pi / 2;
} else if Q1 < 0
then { # I1 == 0, Q1 is negative
Phase1 = 3 * Double.Pi / 2;
} else { # I1 and Q1 == 0
Phase1 = 0;
}
# Convert phase to degrees
Phase = Phase1 * 180 / Double.Pi;
if Phase[1] < 90 and Phase > 270
then {
# This occurs when there is a big jump from 360-0
DeltaPhase1 = 360 + Phase[1] - Phase;
} else {
DeltaPhase1 = Phase[1] - Phase;
}
# Limit our delta phases between 7 and 60
if DeltaPhase1 < 7
then {
DeltaPhase = 7;
} else if DeltaPhase1 > 60
then {
DeltaPhase = 60;
} else {
DeltaPhase = DeltaPhase1;
}
# Determine Instantaneous period:
InstPeriod1 =
-1 * (fold i = 0 to 40 with v=0 do
if v < 0 then
v
else if v > 360 then
-i
else
v + GetValue(DeltaPhase, i, 41)
);
if InstPeriod1 <= 0
then {
InstPeriod = InstPeriod[1];
} else {
InstPeriod = InstPeriod1;
}
Period = 0.25 * InstPeriod + 0.75 * Period[1];
}
plot DC = Period;
}
script Ehler_MAMA {
input price = hl2;
input FastLimit = 0.5;
input SlowLimit = 0.05;
rec Period;
rec Period_raw;
rec Period_cap;
rec Period_lim;
rec Smooth;
rec Detrender;
rec I1;
rec Q1;
rec jI;
rec jQ;
rec I2;
rec Q2;
rec I2_raw;
rec Q2_raw;
rec Phase;
rec DeltaPhase;
rec DeltaPhase_raw;
rec alpha;
rec alpha_raw;
rec Re;
rec Im;
rec Re_raw;
rec Im_raw;
rec SmoothPeriod;
rec vmama;
rec vfama;
def CorrectionFactor = Phase_Accumulation(price).CorrectionFactor;
if BarNumber() <= 5
then {
Smooth = 0;
Detrender = 0;
Period = 0;
Period_raw = 0;
Period_cap = 0;
Period_lim = 0;
I1 = 0;
Q1 = 0;
I2 = 0;
Q2 = 0;
jI = 0;
jQ = 0;
I2_raw = 0;
Q2_raw = 0;
Re = 0;
Im = 0;
Re_raw = 0;
Im_raw = 0;
SmoothPeriod = 0;
Phase = 0;
DeltaPhase = 0;
DeltaPhase_raw = 0;
alpha = 0;
alpha_raw = 0;
vmama = 0;
vfama = 0;
} else {
# Smooth and detrend my smoothed signal:
Smooth = WMA_Smooth(price);
Detrender = ( 0.0962 * Smooth
+ 0.5769 * Smooth[2]
- 0.5769 * Smooth[4]
- 0.0962 * Smooth[6] ) * CorrectionFactor;
Q1 = ( 0.0962 * Detrender
+ 0.5769 * Detrender[2]
- 0.5769 * Detrender[4]
- 0.0962 * Detrender[6] ) * CorrectionFactor;
I1 = Detrender[3];
jI = ( 0.0962 * I1
+ 0.5769 * I1[2]
- 0.5769 * I1[4]
- 0.0962 * I1[6] ) * CorrectionFactor;
jQ = ( 0.0962 * Q1
+ 0.5769 * Q1[2]
- 0.5769 * Q1[4]
- 0.0962 * Q1[6] ) * CorrectionFactor;
# This is the complex conjugate
I2_raw = I1 - jQ;
Q2_raw = Q1 + jI;
I2 = 0.2 * I2_raw + 0.8 * I2_raw[1];
Q2 = 0.2 * Q2_raw + 0.8 * Q2_raw[1];
Re_raw = I2 * I2[1] + Q2 * Q2[1];
Im_raw = I2 * Q2[1] - Q2 * I2[1];
Re = 0.2 * Re_raw + 0.8 * Re_raw[1];
Im = 0.2 * Im_raw + 0.8 * Im_raw[1];
# Compute the phase
if Re != 0 and Im != 0
then {
Period_raw = 2 * Double.Pi / ATan(Im / Re);
} else {
Period_raw = 0;
}
if Period_raw > 1.5 * Period_raw[1]
then {
Period_cap = 1.5 * Period_raw[1];
} else if Period_raw < 0.67 * Period_raw[1] {
Period_cap = 0.67 * Period_raw[1];
} else {
Period_cap = Period_raw;
}
if Period_cap < 6
then {
Period_lim = 6;
} else if Period_cap > 50
then {
Period_lim = 50;
} else {
Period_lim = Period_cap;
}
Period = 0.2 * Period_lim + 0.8 * Period_lim[1];
SmoothPeriod = 0.33 * Period + 0.67 * SmoothPeriod[1];
if I1 != 0
then {
Phase = ATan(Q1 / I1);
} else if Q1 > 0
then { # Quadrant 1:
Phase = Double.Pi / 2;
} else if Q1 < 0
then { # Quadrant 4:
Phase = -Double.Pi / 2;
} else { # Both numerator and denominator are 0.
Phase = 0;
}
DeltaPhase_raw = Phase[1] - Phase;
if DeltaPhase_raw < 1
then {
DeltaPhase = 1;
} else {
DeltaPhase = DeltaPhase_raw;
}
alpha_raw = FastLimit / DeltaPhase;
if alpha_raw < SlowLimit
then {
alpha = SlowLimit;
} else {
alpha = alpha_raw;
}
vmama = alpha * price + (1 - alpha) * vmama[1];
vfama = 0.5 * alpha * vmama + (1 - 0.5 * alpha) * vfama[1];
}
plot MAMA = vmama;
plot FAMA = vfama;
}
#declare upper;
input price = hl2;
input FastLimit = 0.5;
input SlowLimit = 0.05;
#AddLabel(yes, Concat("MAMA: ", Concat("",
#if MAMA > FAMA then "Bull" else "Bear")),
#if MAMA > FAMA then Color.GREEN else Color.RED);
# McGinley Dynamic Indicator
# Mobius
# V02.11.2011
# D = D1 + ((I - D1) / ( N * (I/D1)^4))
# where D1= yesterday's Dynamic, I = today's price, N = smoothing factor.
input valueMcD = close;
input length = 20;
input Slength = 5;
def A1 = ExpAverage(valueMcD, length)[1];
def MDI = A1 + ((valueMcD - A1) / Sqr(valueMcD / A1));
input periods = 10;
rec _md = CompoundValue( 1, _md[1] + (( close - _md[1] ) / ( periods *
Power( close / _md[1], 4 ) ) ), close );
def MD = _md;
def FAMA = Ehler_MAMA(price, FastLimit, SlowLimit).FAMA;
def MAMA = Ehler_MAMA(price, FastLimit, SlowLimit).MAMA;
###########################################################################
################### SIGNALS ############
def BuyLine5Up = v5Avg > v5Avg[1];
def BuylineUp = Buyline > Buyline[1] ;
def Long5vol = curbuyVolume5 > cursellVolume5;
def Long10Vol = curbuyvol10 > cursellvol10;
def Buy_AVG_UP = Buylineavg > Buylineavg[1];
def CMF_Long = CMF_P > CMF_P[1];
def CMF_Short = CMF_P < CMF_P[1];
def CMF_P_AVG_UP = CMF_P_AVG > CMF_P_AVG[1];
def CMF_P_AVG_Down = CMF_P_AVG < CMF_P_AVG[1];
def CCI_AVG_Long = CCIAvg > CCIAvg[1];
def CCI_AVG_Short = CCIAvg < CCIAvg[1];
def DMILong = Osc > ZeroLine;
def DMIShort = Osc < ZeroLine;
def DMIUP = DMI_A > DMI_A[1];
def DMIDown = DMI_A < DMI_A[1];
def MAMA_FAMA_L = MAMA > FAMA;
def MAMA_FAMA_S = MAMA < FAMA;
def MAMA_McG_L = MAMA > MD;
def MAMA_McG_S = MAMA < MD;
def Trail_L = state == state.long;
def Trail_S = state == state.short;
def ROC_UP = OBV_AVG > OBV_AVG[1];
def ROC_Down = OBV_AVG < OBV_AVG[1];
def BuylineDown = Buyline < Buyline[1] ;
def SelllineUp = Sellline > Sellline[1] ;
def SelllineDown = Sellline < Sellline[1] ;
def Short5vol = curbuyVolume5 < cursellVolume5;
def Short10Vol = curbuyvol10 < cursellvol10;
def BuyLine5Down = v5Avg < v5Avg[1];
def Buy_AVG_Down = Buylineavg < Buylineavg[1];
def Sell_AVG_Down = Selllineavg < Selllineavg[1];
def Sell_AVG_UP = Selllineavg > Selllineavg[1];
######## AGREEMENT LEVELS #############
###### Confirmation, derived from Christopher84's Confirmation candles
def AgreeTotalL = CCI_AVG_Long + DMILong + DMIUP + MAMA_FAMA_L + MAMA_McG_L + Trail_L + Long5vol + Long10Vol + CMF_Long + TKL4_13 + TKL4_52 + FutureBullishCloudB + FutureBullishCloudC + FutureBullishCloudD + Lag2L + Lag3L + Lag4L + cmf_P_AVG_UP + BuyLineUp + SellLineDown + Buy_AVG_UP + Sell_AVG_Down + Mflow_Up + ROC_UP;
def AgreeTotalS = CCI_AVG_Short + DMIShort + DMIDown + MAMA_FAMA_S + MAMA_McG_S + Trail_S + Short5vol + Short10Vol + CMF_Short + TKS4_13 + TKS4_52 + FutureBearishCloudB + FutureBearishCloudC + FutureBearishCloudD + Lag2S + Lag3S + Lag4S + cmf_P_AVG_Down + SellLineUp + BuyLineDown + Buy_AVG_Down + Sell_AVG_UP + Mflow_Dwn + ROC_Down;
def ConTotal = AgreeTotalL - AgreeTotalS;
def MomTotalUp = ConTotal[1] < ConTotal;
def MomTotalDown = Contotal[1] > ConTotal;
###########################
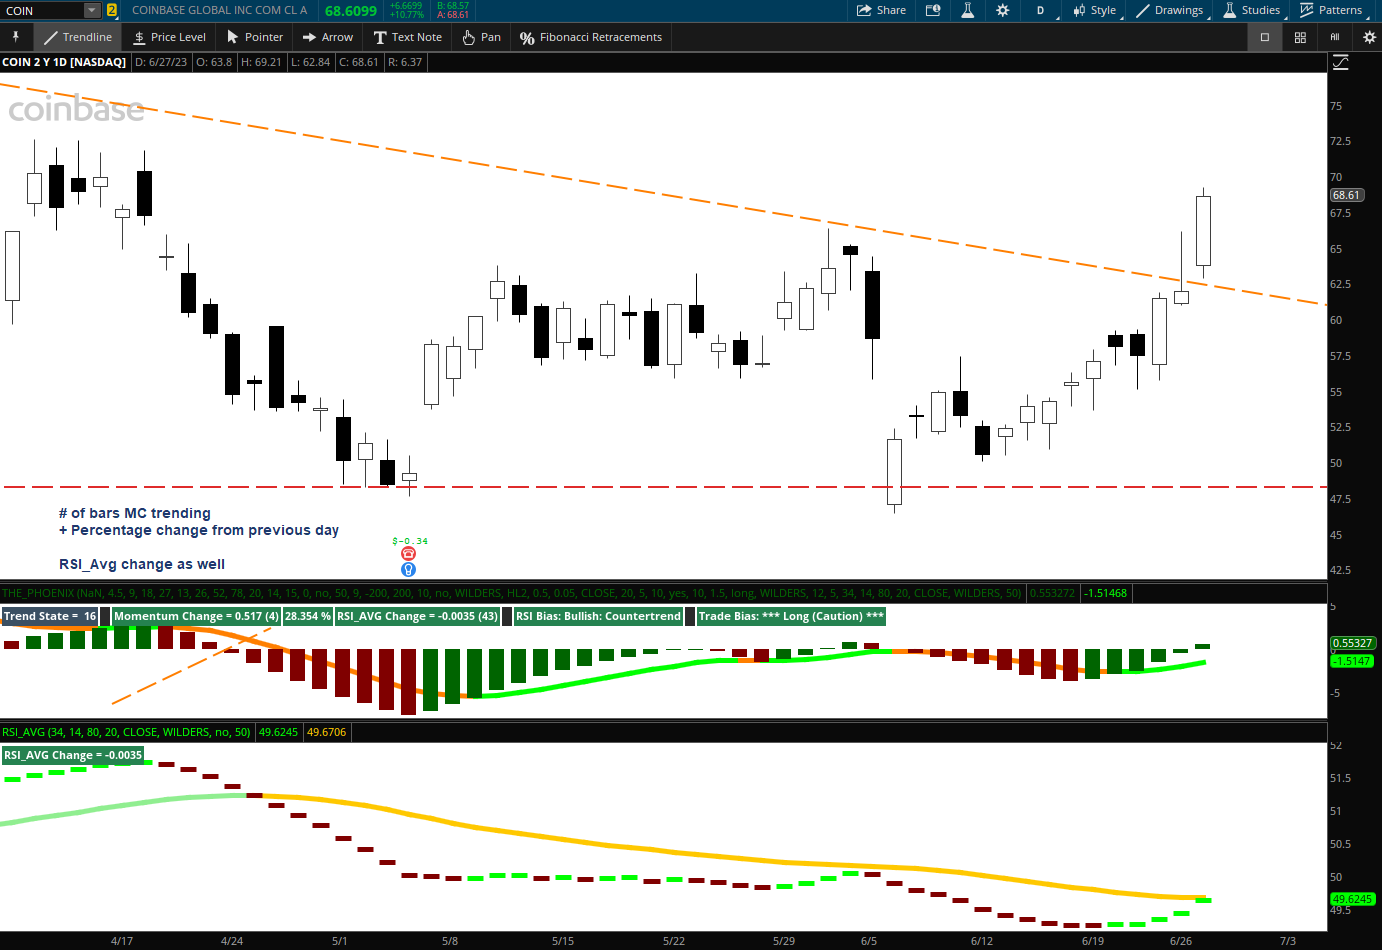
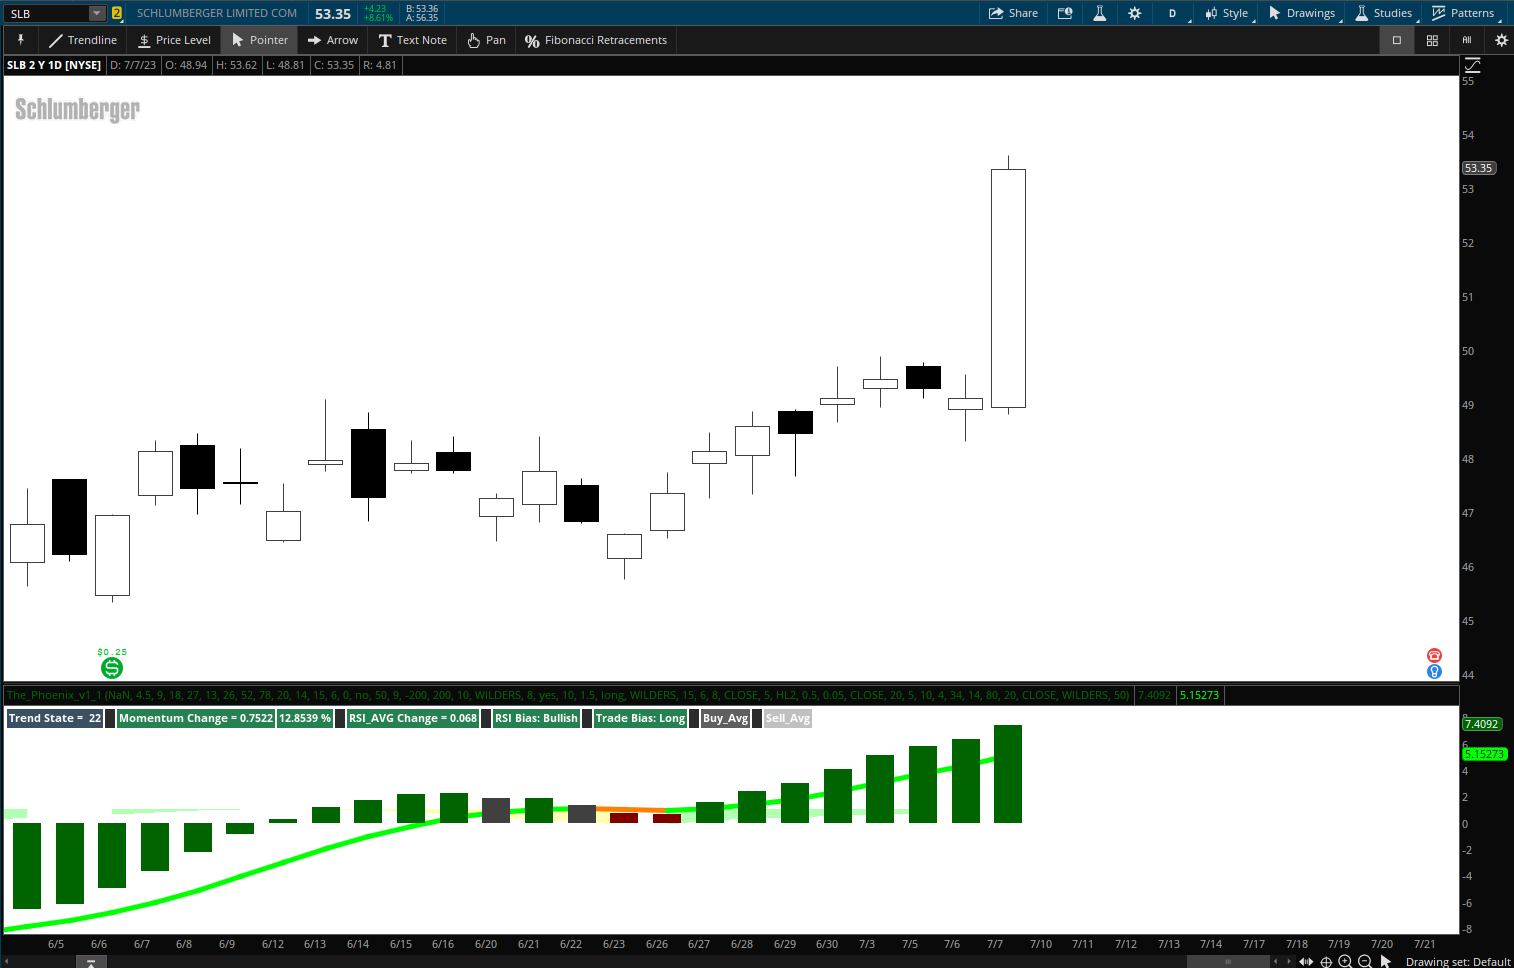
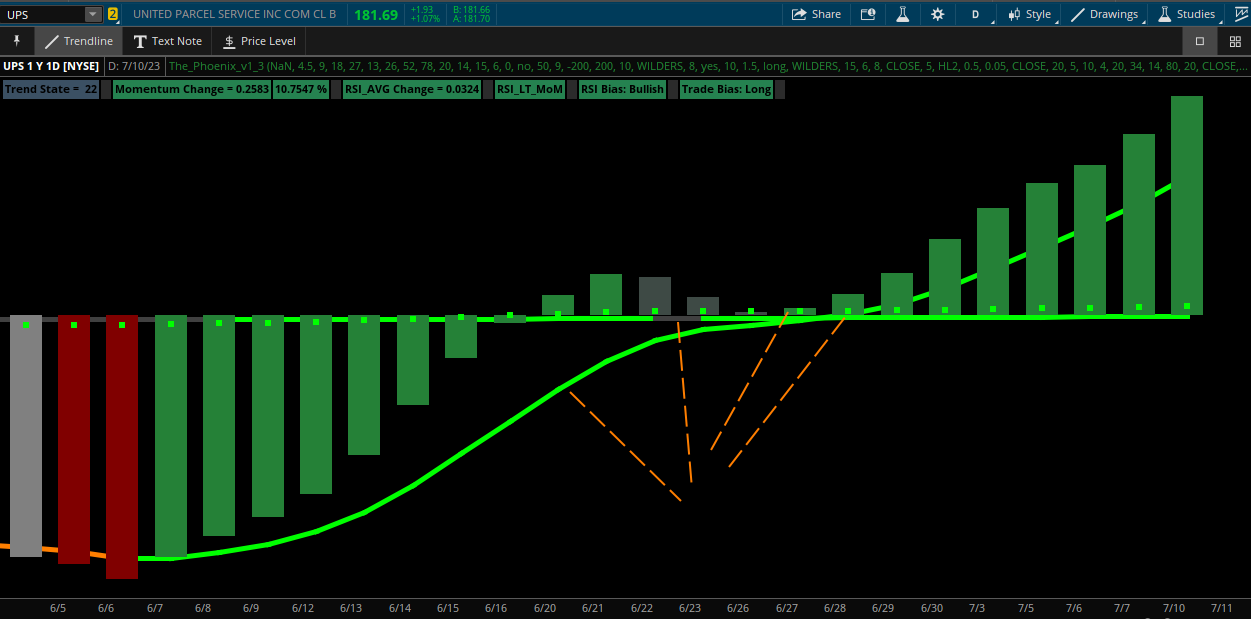
AddLabel(yes, "Trend State = " + Round(ConTotal, 1), CreateColor(59, 80, 99));
AddLabel(yes, " ", CreateColor(43, 43, 43));
#####
input MOMAVG = 4;
plot MOMline = WildersAverage(ConTotal[-displace], length_mom);
plot MOMlineAVGp = wildersAverage(MOMline, MOMAVG) ;
MOMline.SetPaintingStrategy(PaintingStrategy.HISTOGRAM);
MOMline.AssignValueColor(if MOMlineAVGp < MOMlineAVGp[1] and MOMline > MOMline[1] then color.GRAY else if MOMline > MOMline[1] then createcolor(37,129,55) else if MOMlineAVGp > MOMlineAVGp[1] and MOMline < MOMline[1] then createColor(62,74,69) else if MOMline < MOMline[1] then color.DARK_RED else color.BLACK);
MOMline.SetLineWeight(5);
#def MOMline = wildersAverage(cursellvol10[-displace], length12) ;
#def MOMLINEAVG = (Momline / 10);
MOMlineAVGp.SetPaintingStrategy(PaintingStrategy.LINE);
MOMlineAVGp.SetLineWeight(5);
MOMlineAVGp.AssignValueColor(if MOMlineAVGp > MOMlineAVGp[1] then Color.GREEN else if MOMlineAVGp < MOMlineAVGp[1] then Color.DARK_ORANGE else Color.DARK_GRAY);
def MomlineDiff = (MOMlineAVGp - MOMlineAVGp[1]);
############### Momentum Change
#def MoMDir1 = if MOMlineAVGp > MOMlineAVGp[1] then 1 else if MOMlineAVGp < MOMlineAVGp[1] then 2 else 0;
#def MoMDirUp = if MoMDir1[1] == 0 and MoMDir1 == 1 then 1 else if MoMDir1 == 1 then MoMDirUp[1] + 1 else 0;
#def MomCntUp = MoMDirUp;
#def MoMDirDwn = if MoMDir1[1] == 0 and MoMDir1 == 2 then 2 else if MoMDir1 == 2 then MoMDirDwn[1] + 1 else 0;
#def MoMCntdwn = MoMDirDwn;
########### MOM_AVG ###################
#def MomLUp = MomlineDiff > MomlineDiff[1];
#def MomLDwn = MomlineDiff < MomlineDiff[1];
input ML = 20;
plot MoMLabelLine = wildersAverage(momlineDiff, ml);
MoMLabelLine.setpaintingStrategy(paintingStrategy.SQUARES);
MoMLabelLine.setlineWeight(3);
MoMLabelLine.assignValueColor(if MoMLabelLine > MoMLabelLine[1] then color.GREEN else if MoMLabelLine < MoMLabelLine[1] then color.DARK_ORANGE else color.GRAY);
############
AddLabel(yes, "Momentum Change = " + MoMLabelLine , if MoMLabelLine > MoMLabelLine[1] then CreateColor(37,130,80) else if MoMLabelLine < MoMLabelLine[1] then CreateColor(168,12,22) else Color.DARK_GRAY);
def MoM_PercentChange = (MoMLabelLine - MoMLabelLine[1]) / MoMLabelLine * (100) ;
AddLabel(yes, MoM_PercentChange + " %", if MoMLabelLine > MoMLabelLine[1] then CreateColor(37, 130, 80) else if MoMLabelLine < MoMLabelLine[1] then CreateColor(168, 12, 22) else Color.DARK_GRAY);
########################### RSI AVG ##############################
#RSI AVG BY Hypnotic_Options
input lengthRSI = 34;
input lengthrsiAVG = 14;
input over_BoughtRSI = 80;
input over_SoldRSI = 20;
input priceRSI = close;
input averageTypeRSI = AverageType.WILDERS;
input mid = 50;
def NetChgAvg = MovingAverage(averageTypeRSI, priceRSI - priceRSI[1], lengthRSI);
def TotChgAvg = MovingAverage(averageTypeRSI, AbsValue(priceRSI - priceRSI[1]), lengthRSI);
def ChgRatio = if TotChgAvg != 0 then NetChgAvg / TotChgAvg else 0;
def RSI = 50 * (ChgRatio + 1);
def RSI_A = WildersAverage(RSI, lengthRSI) ;
#RSI_A.setpaintingStrategy(paintingStrategy.DASHES);
#RSI_A.assignValueColor(if RSI_A > RSI_A[1] then color.GREEN else if RSI_A < RSI_A[1] then color.DARK_RED else color.DARK_GRAY);
#RSI_A.setlineWeight(5);
def rsiavg = WildersAverage(RSI_A, lengthrsiAVG);
#rsiavg.SetLineWeight(5);
#rsiavg.SetPaintingStrategy(PaintingStrategy.LINE);
#rsiavg.AssignValueColor(if rsiavg > rsiavg[1] then Color.LIGHT_GREEN else if rsiavg < rsiavg[1] then Color.ORANGE else Color.DARK_GRAY);
####### RSI SIGNALS #############
def RSIavg_Change = (rsiavg - rsiavg[1]);
def RSI_L = RSI_A > RSI_A[1];
def RSI_S = RSI_A < RSI_A[1];
def RSIavg_L = rsiavg > rsiavg[1];
def RSIavg_S = rsiavg < rsiavg[1];
####### RSI TRADE BIAS, LABELS NOT INCLUDED
#def RSI_ST_Long = rsi_l and RSIavg_S and RSIavg_Change > RSIavg_Change[1];
#def RSI_Long = RSI_L and RSIavg_L;
#def RSI_ST_Short = rsi_S and RSIavg_L and RSIavg_Change < RSIavg_Change[1];
#def RSI_Short = RSI_S and RSIavg_S;
########### TRADE BIAS WITH LABELS ############
def RSI_ST_Long = RSI_L and RSIavg_S and RSIavg_Change > RSIavg_Change[1];
def RSI_Long = RSI_L and RSIavg_L and RSIavg_Change > RSIavg_Change[1];
def RSI_ST_Short = RSI_S and RSIavg_L and RSIavg_Change < RSIavg_Change[1];
def RSI_Short = RSI_S and RSIavg_S and RSIavg_Change < RSIavg_Change[1];
#########################
def RSI_LineStatus_L = RSI_A > rsiavg;
def RSI_LineStatus_S = RSI_A < rsiavg;
def RSI_CT_L = RSI_L and RSIavg_S;
def RSI_CT_S = RSI_S and RSIavg_L;
AddLabel(yes, " ", CreateColor(43, 43, 43));
##### Long Term ##########
AddLabel(yes, "RSI_AVG Change = " + RSIavg_Change, if RSIavg_Change > RSIavg_Change[1] then CreateColor(37, 130, 80) else if RSIavg_Change < RSIavg_Change[1] then CreateColor(168, 12, 22) else Color.DARK_GRAY);
#AddLabel(yes, " ", CreateColor(43, 43, 43));
########## RSI COUNTER ##################################
#def RSIDir1 = if rsiavg > rsiavg[1] then 1 else if rsiavg < rsiavg[1] then 2 else 0;
#def RSIDirUp = if RSIDir1[1] == 0 and RSIDir1 == 1 then 1 else if RSIDir1 == 1 then RSIDir1[1] + 1 else 0;
#def RSICntUp = MoMDirUp;
#def RSIDirDwn = if RSIDir1[1] == 0 and RSIDir1 == 2 then 2 else if RSIDir1 == 2 then RSIDirDwn[1] + 1 else 0;
#def RSICntdwn = RSIDirDwn;
######## RSI Momentum Line ##################
input t = 10;
input u = 2;
plot RSI_ST_MoM = wildersAverage(RSIavg_Change, t);
def RSI_AVGUp = RSIavg_Change > RSIavg_Change[1];
def RSI_AVGDwn = RSIavg_Change < RSIavg_Change[1];
def RSI_ST_MoMUp = RSI_ST_MoM > RSI_ST_MoM[1];
def RSI_ST_MoMDwn = RSI_ST_MoM < RSI_ST_MoM[1];
#def RSI_ST_MoMUP_Rising = RSI_ST_MoMUp and RSI_AVGUp;
#def RSI_ST_MoMUP_Falling = RSI_ST_MoMUp and RSI_AVGDwn ;
#def RSI_ST_MoMDwn_Rising = RSI_ST_MoMDwn and RSI_AVGUp;
#def RSI_ST_MoMDwn_Falling = RSI_ST_MoMDwn and RSI_AVGDwn ;
#AddLabel(yes, "RSI_ST_MoM = " + if RSI_ST_MoMUP_Rising then CreateColor(37, 130, 80) else if RSI_ST_MoMUP_Falling then CreateColor(168, 12, 22) else Color.DARK_GRAY);
AddLabel(yes, " ", CreateColor(43, 43, 43));
RSI_ST_MoM.setstyle(curve.FIRM);
RSI_ST_MoM.setlineWeight(5);
RSI_ST_MoM.assignValueColor(if RSI_AVGUp and RSI_ST_MoMUp then color.GREEN else if RSI_AVGDwn and RSI_ST_MoMDwn then color.YELLOW else color.DARK_GRAY);
def rsilabelavg = WildersAverage(RSI_ST_MoM, u);
#rsilabelavg.SetLineWeight(5)
#rsilabelavg.Setstyle(curve.FIRM);
addlabel(yes, if rsilabelavg > rsilabelavg[1] then "RSI_LT_MoM" else if rsilabelavg < rsilabelavg[1] then "RSI_LT_MoM" else "", if rsilabelavg > rsilabelavg[1] then CreateColor(37,130,80) else if rsilabelavg < rsilabelavg[1] then CreateColor(168,12,22) else Color.DARK_GRAY);
AddLabel(yes, " ", CreateColor(43, 43, 43));
#addlabel(yes, "Momentum Change = " + momlineDiff + if MomlineDiff > MomlineDiff[1] then " (" + MomCntUp + ")" else if MomlineDiff < MomlineDiff[1] then " (" + MoMCntdwn + ")" else "", if MomlineDiff > MomlineDiff[1] then CreateColor(37, 130, 80) else if MomlineDiff < MomlineDiff[1] then CreateColor(168,12,22) else color.DARK_GRAY);
##############
##########################################################
####### MM SIGNALS (W/O LABELS ############
#def MM_L = momline > momline[1] and momlineavGp > momlineavGp[1];
#def MM_S = momline < momline[1] and momlineavGp < momlineavGp[1];
######### WITH LABELS
def MM_L = MOMline > MOMline[1] and MOMlineAVGp > MOMlineAVGp[1] and MomlineDiff > MomlineDiff[1];
def MM_S = MOMline < MOMline[1] and MOMlineAVGp < MOMlineAVGp[1] and MomlineDiff < MomlineDiff[1];
############## COMBINED SIGNALS ############################
def MM_Long_Caution = MM_L and RSI_ST_Long;
def MM_Long = MM_L and RSI_Long;
def MM_Short_Caution = MM_S and RSI_ST_Short;
def MM_Short = MM_S and RSI_Short;
#addlabel(yes, "RSI Bias: " + if RSI_ST_Long then "UP (Caution) " else if RSI_Long then "UP" else if RSI_ST_Short then "Down (Caution) " else if RSI_Short then "Down " else " ", if RSI_ST_Long or RSI_Long then CreateColor(37,130,80) else if RSI_ST_Short or RSI_Short then CreateColor(168,12,22) else color.DARK_GRAY);
AddLabel(yes, "RSI Bias: " + if RSI_CT_L then "Bullish: Countertrend" else if RSI_CT_S then "Bearish: Countertrend " else if RSI_LineStatus_L then "Bullish" else if RSI_LineStatus_S then "Bearish" else " ", if RSI_CT_L then CreateColor(37, 130, 80) else if RSI_CT_S then CreateColor(168, 12, 22) else if RSI_LineStatus_L then CreateColor(37, 130, 80) else if RSI_LineStatus_S then CreateColor(168, 12, 22) else Color.DARK_GRAY);
AddLabel(yes, " ", CreateColor(43, 43, 43));
#def MoMLine_L = momline > momline[1];
#def MomAvg_L = momlineavGp > momlineavGp[1];
#def MomDiff_L = MomlineDiff > MomlineDiff[1];
#def LBias = momLine_L + momavg_L + RSI_L + RSIavg_L + momDiff_L;
#def MoMLine_S = momline < momline[1];
#def MomAvg_S = momlineavGp < momlineavGp[1];
#def MomDiff_S = MomlineDiff < MomlineDiff[1];
#def SBias = momLine_S + momavg_S + RSI_S + RSIavg_S + momDiff_S;
#def Trade_bias = LBias - SBias;
#def Trade_Bias_L = Trade_bias > Trade_bias;
#def Trade_Bias_S = Trade_bias < Trade_bias;
#def TradeBiasUp = Trade_bias[1] < Trade_bias;
#def TradeBiasDwn = Trade_bias[1] > Trade_bias;
AddLabel(yes, "Trade Bias: " + if MM_Long_Caution then "*** Long (Caution) ***" else if MM_Long then "Long" else if MM_Short_Caution then "*** Short (Caution) ***" else if MM_Short then "*** Short ***" else " ", if MM_Long_Caution or MM_Long then CreateColor(37, 130, 80) else if MM_Short_Caution or MM_Short then CreateColor(168, 12, 22) else Color.DARK_GRAY);
AddLabel(yes, " ", CreateColor(43, 43, 43));
#addlabel(yes, Round(Trade_bias, 1));
#plot MomlineDiffC = (MOMlineAVGp - MOMlineAVGp[1]);
#momlineDiffC.setlineWeight(5);
#momlineDiff.assignValueColor(if MomlineDiff > MomlineDiff[1] then color.GREEN else if MomlineDiff < #MomlineDiff[1] then color.YELLOW else color.DARK_GRAY);
#def MomLUp = MomlineDiff > MomlineDiff[1];
#def MomLDwn = MomlineDiff < MomlineDiff[1];
#AddCloud(if momlUp then momlUp else Double.NaN, momlineDiff, color.GREEN, color.BLUE);
#AddCloud(if momlDwn then momlDwn else Double.NaN, momlineDiff, color.YELLOW, Color.CURRENT);
#plot MoMLabelLine = momlineDiff;
#MoMLabelLine.setpaintingStrategy(paintingStrategy.SQUARES);
#MoMLabelLine.setlineWeight(4);
#MoMLabelLine.assignValueColor(if momlUp then color.GREEN else if momlDwn then color.DARK_ORANGE else color.GRAY);
Last edited by a moderator:
")