
serendipity2020
Member
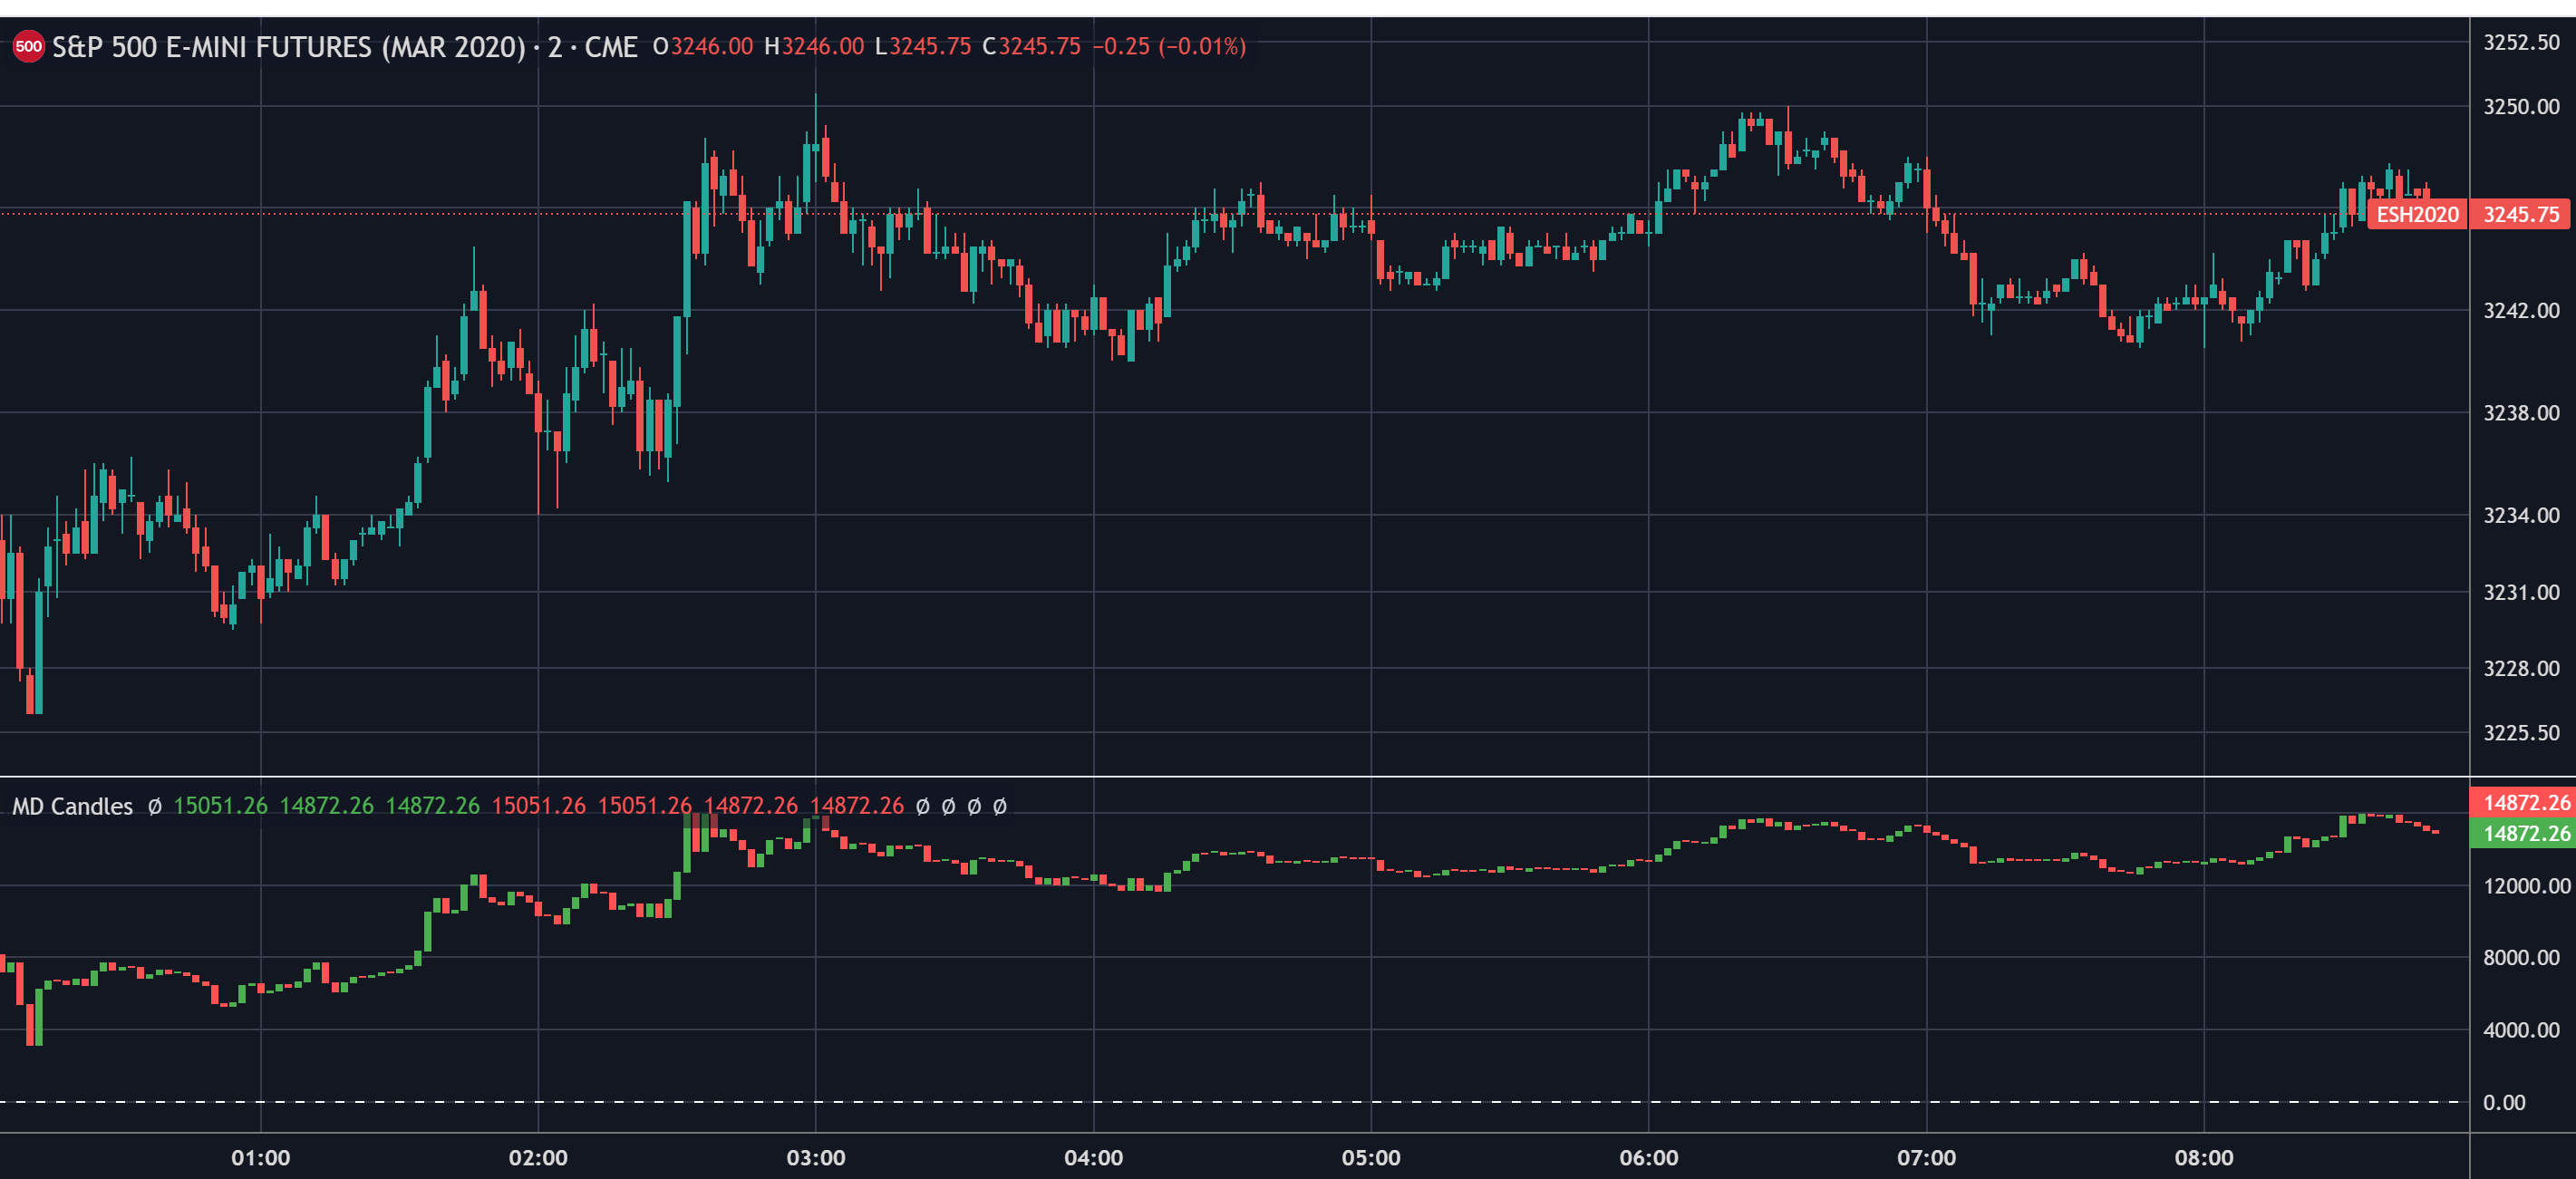
This script is used to identify market cumulative delta primarily on futures market on 3 or 5 min chart but works on all intra-day charts as well.
When you identify that the deltas are not decreasing rapidly, when price is going down rapidly, you can assume that its bullish setup as the volume is not going down with that speed and vice-versa.
The author states:
Market Delta is suitable for daytrading on intraday timeframes, is a volume based indicator which allows to see the UP VOLUME vs the DOWN VOLUME, the DELTA (difference) and the CUMULATIVE DELTA (cumulative sum of difference) between them
This indicator is based on contracts volume (data avaiable), not in ask/bid volume (data not avaiable)
Hello @samer800
Can you convert https://www.tradingview.com/script/NH4wEdWp-Market-Delta-Makit0/ to ToS?
Appreciate your help and thanks in advance!
Last edited by a moderator:
