
SPY can be up but if the Big8 are not participating then it will be hard to push higher. Conversely, Market Thrust can be down but if the Big8 are up it can definitely go higher. I mainly trade SPY, SPX and /ES so this is valuable information to me. Crosses of the moving averages can also signal changes in trend. I have included both GOOG and GOOGL as TOS includes both of them in its Heatmap. I have not included NFLX as it is smaller than many others on the Heatmap. BRK/B has a larger market cap than TSLA but BRK/B doesn't get the volume that TSLA does. Hope this is useful.
I have also calculated the A/D two ways, as % x volume and and as difference in price x volume. The first method seems to be the most equalizing but the other may be more accurate. Watch and see and decide.
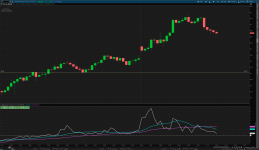
Attached is a chart not showing overnight activity. If you enable showing overnight activity, the moving averages will take a while to form, especially the slower one.
I have also calculated the A/D two ways, as % x volume and and as difference in price x volume. The first method seems to be the most equalizing but the other may be more accurate. Watch and see and decide.
Attached is a chart not showing overnight activity. If you enable showing overnight activity, the moving averages will take a while to form, especially the slower one.
Code:
#Big8_Advance_Decline
#Add a Label to show the Contribution of the Big 8
#use Prior Days Close rather than Today's Open
#11.5.2023 fixed code for Symbol_diff_total lines. Prior code used volume aggregated day volume
#also added a plotted line for Sum_diff_totals

declare lower;

def aggregationPeriod = AggregationPeriod.DAY;

def AAPL_PDC = close("AAPL", period= AggregationPeriod.Day)[1];
def AAPL_diff = close("AAPL") - AAPL_PDC;
def AAPL_dpct = 100 * AAPL_diff / AAPL_PDC;
def AAPL_total = AAPL_dpct * volume("AAPL"  );
def AAPL_diff_total = AAPL_diff * volume("AAPL");

def MSFT_PDC = close("MSFT", period= AggregationPeriod.Day)[1];
def MSFT_diff = close("MSFT") - MSFT_PDC;
def MSFT_dpct = 100 * MSFT_diff / MSFT_PDC;
def MSFT_total = MSFT_dpct * volume("MSFT" );
def MSFT_diff_total = MSFT_diff * volume("MSFT");

def META_PDC = close("META", period= AggregationPeriod.Day)[1];
def META_diff = close("META") - META_PDC;
def META_dpct = 100 * META_diff / META_PDC;
def META_total = META_dpct * volume("META");
def META_diff_total = META_diff * volume("META");

def GOOG_PDC = close("GOOG", period= AggregationPeriod.Day)[1];
def GOOG_diff = close("GOOG") - GOOG_PDC;
def GOOG_dpct = 100 * GOOG_diff / GOOG_PDC;
def GOOG_total = GOOG_dpct * volume("GOOG");
def GOOG_diff_total = GOOG_diff * volume("GOOG");

def GOOGL_PDC = close("GOOGL", period= AggregationPeriod.Day)[1];
def GOOGL_diff = close("GOOGL") - GOOGL_PDC;
def GOOGL_dpct = 100 * GOOGL_diff / GOOGL_PDC;
def GOOGL_total = GOOGL_dpct * volume("GOOGL");
def GOOGL_diff_total = GOOGL_diff * volume("GOOGL");

def NVDA_PDC = close("NVDA", period= AggregationPeriod.Day)[1];
def NVDA_diff = close("NVDA") - NVDA_PDC;
def NVDA_dpct = 100 * NVDA_diff / NVDA_PDC;
def NVDA_total = NVDA_dpct * volume("NVDA");
def NVDA_diff_total = NVDA_diff * volume("NVDA");

def AMZN_PDC = close("AMZN", period= AggregationPeriod.Day)[1];
def AMZN_diff = close("AMZN") - AMZN_PDC;
def AMZN_dpct = 100 * AMZN_diff / AMZN_PDC;
def AMZN_total = AMZN_dpct * volume("AMZN");
def AMZN_diff_total = AMZN_diff * volume("AMZN");

def TSLA_PDC = close("TSLA", period= AggregationPeriod.Day)[1];
def TSLA_diff = close("TSLA") - TSLA_PDC;
def TSLA_dpct = 100 * TSLA_diff / TSLA_PDC;
def TSLA_total = TSLA_dpct * volume("TSLA");
def TSLA_diff_total = TSLA_diff * volume("TSLA");

def Percent_Total = AAPL_dpct + MSFT_dpct + META_dpct + GOOG_dpct + GOOGL_dpct + NVDA_dpct + AMZN_dpct + TSLA_dpct;
AddLabel(yes, "Big8% : " + Round(Percent_Total, 2) + "%", if Percent_Total > 0 then color.light_green else if Percent_Total < 0 then color.light_red else color.yellow);

plot Sum_totals = AAPL_total + MSFT_total + META_total + GOOG_total + GOOGL_total + NVDA_total + AMZN_total + TSLA_total;
Sum_totals.SetDefaultColor(Color.White);
Sum_totals.SetLineWeight(2);
Sum_totals.SetPaintingStrategy(PaintingStrategy.LINE);

input avg_period1 = 13;
input avg_period2 = 34;
plot Avg_S_T1 = Average(Sum_totals, avg_period1);
Avg_S_T1.SetDefaultColor(Color.magenta);
Avg_S_T1.SetLineWeight(2);
Avg_S_T1.SetPaintingStrategy(PaintingStrategy.LINE);

plot Avg_S_T2 = Average(Sum_totals, avg_period2);
Avg_S_T2.SetDefaultColor(Color.Cyan);
Avg_S_T2.SetLineWeight(2);
Avg_S_T2.SetPaintingStrategy(PaintingStrategy.LINE);

plot ZeroLine = 0;
ZeroLine.SetDefaultColor(Color.white);
ZeroLine.SetLineWeight(1);
ZeroLine.SetPaintingStrategy(PaintingStrategy.LINE);

AddLabel(yes, "Vol%: " + Sum_totals/1000000 + "M", if Sum_totals > 0 then color.light_green else if Sum_totals < 0 then color.light_red else color.yellow);

plot Sum_diff_totals = AAPL_diff_total + MSFT_diff_total + META_diff_total + GOOG_diff_total + GOOGL_diff_total + NVDA_diff_total + AMZN_diff_total + TSLA_diff_total;
Sum_diff_totals.SetDefaultColor(Color.yellow);
Sum_diff_totals.SetLineWeight(2);
Sum_diff_totals.SetPaintingStrategy(PaintingStrategy.LINE);

AddLabel(yes, "Vol_diff: " + Sum_diff_totals/1000000 + "M", if Sum_diff_totals > 0 then color.light_green else if Sum_diff_totals < 0 then color.light_red else color.yellow);

#END_CODE
Attachments
Last edited: