VOLD-Market Breadth For ThinkOrSwim

inkaopal1

New member
The author states:
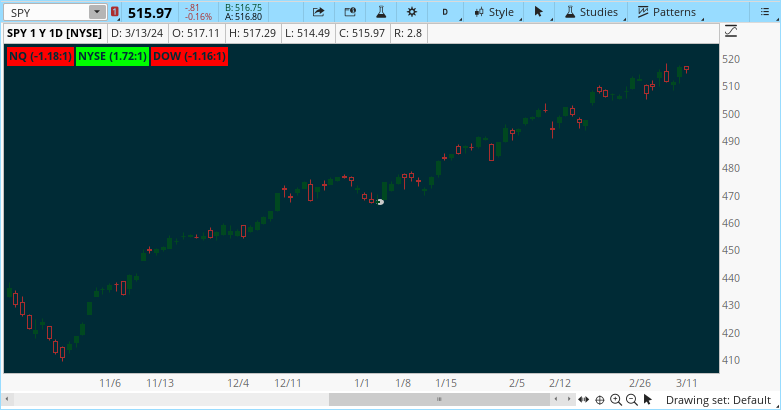
This script provides NASDAQ and NYSE Up Volume (volume in rising stocks) and Down Volume (volume in falling stocks) ratio. Up Volume is higher than Down Volume, then you would see green label with ratio e.g 3.5:1. This means Up Volume is 3.5 times higher than Down Volume - Positive Market Breadth. If Down Volume is higher than Up Volume, then you would see red label with ratio e.g -4.5:1. This means Down Volume is 4.5 times higher than Up Volume.

For example, ratio is 1:1, then it is considered Market Breadth is Neutral.
74hHBcX.png


Can someone help to translate the tradingview VOLD Market Breadth Ratio to tos?
The link is provided. Thank you.

https://www.tradingview.com/script/DypGAzBg-VOLD-MarketBreadth-Ratio/#:~:text=This script provides NASDAQ and,with ratio e.g 3.5:1.
 
Last edited by a moderator:

Join useThinkScript to post your question to a community of 21,000+ developers and traders.

Can someone help to translate the tradingview VOLD Market Breadth Ratio to tos?
The link is provided. Thank you.

https://www.tradingview.com/script/DypGAzBg-VOLD-MarketBreadth-Ratio/#:~:text=This script provides NASDAQ and,with ratio e.g 3.5:1.
check the below. I added DOW as well.

CSS:
#// This source code is subject to the terms of the Mozilla Public License 2.0 at https://mozilla.org/MPL/2.0/
#// © sskcharts
#indicator("VOLD-Market Breadth", 'VOLD-Market Breadth', true, scale=scale.none)
# Converted by Sam4Cok@Samer800    - 03/2024

input src = FundamentalType.CLOSE; #(title='Source', defval=close)

def NYSEuvol = Fundamental(FundamentalType = src, Symbol = "$UVOL");
def NYSEdvol = Fundamental(FundamentalType = src, Symbol = "$DVOL");
def NASDAQuvol = Fundamental(FundamentalType = src, Symbol = "$UVOL/Q");
def NASDAQdvol = Fundamental(FundamentalType = src, Symbol = "$DVOL/Q");
def DJIDAQuvol = Fundamental(FundamentalType = src, Symbol = "$UVOLI");
def DJIDAQdvol = Fundamental(FundamentalType = src, Symbol = "$DVOLI");

def NYSEratio   = if (NYSEuvol >= NYSEdvol) then (NYSEuvol / NYSEdvol) else -(NYSEdvol / NYSEuvol);
def NASDAQratio = if (NASDAQuvol >= NASDAQdvol) then (NASDAQuvol / NASDAQdvol) else -(NASDAQdvol / NASDAQuvol);
def DJIDAQratio = if (DJIDAQuvol >= DJIDAQdvol) then (DJIDAQuvol / DJIDAQdvol) else -(DJIDAQdvol / DJIDAQuvol);

AddLabel(1, "NQ (" + Round(NASDAQratio, 2) + ":1)", if NASDAQratio >= 0 then Color.GREEN else Color.RED);
AddLabel(1, "NYSE (" + Round(NYSEratio, 2) + ":1)", if NYSEratio >= 0 then Color.GREEN else Color.RED);
AddLabel(1, "DOW (" + Round(DJIDAQratio, 2) + ":1)", if DJIDAQratio >= 0 then Color.GREEN else Color.RED);

# End Of Code
Thank you very much!
 

Similar threads

Not the exact question you're looking for?

Start a new thread and receive assistance from our community.

87k+ Posts
288 Online
Create Post

Similar threads

Similar threads

The Market Trading Game Changer

Join 2,500+ subscribers inside the useThinkScript VIP Membership Club
  • Exclusive indicators
  • Proven strategies & setups
  • Private Discord community
  • ‘Buy The Dip’ signal alerts
  • Exclusive members-only content
  • Add-ons and resources
  • 1 full year of unlimited support

Frequently Asked Questions

What is useThinkScript?

useThinkScript is the #1 community of stock market investors using indicators and other tools to power their trading strategies. Traders of all skill levels use our forums to learn about scripting and indicators, help each other, and discover new ways to gain an edge in the markets.

How do I get started?

We get it. Our forum can be intimidating, if not overwhelming. With thousands of topics, tens of thousands of posts, our community has created an incredibly deep knowledge base for stock traders. No one can ever exhaust every resource provided on our site.

If you are new, or just looking for guidance, here are some helpful links to get you started.

What are the benefits of VIP Membership?
VIP members get exclusive access to these proven and tested premium indicators: Buy the Dip, Advanced Market Moves 2.0, Take Profit, and Volatility Trading Range. In addition, VIP members get access to over 50 VIP-only custom indicators, add-ons, and strategies, private VIP-only forums, private Discord channel to discuss trades and strategies in real-time, customer support, trade alerts, and much more. Learn all about VIP membership here.
How can I access the premium indicators?
To access the premium indicators, which are plug and play ready, sign up for VIP membership here.
Back
Top