
Author Message :
This advanced indicator is designed to analyze the market's structure through a combination of pivot highs and lows, creating a nuanced understanding of potential market movements.
Operational Mechanism:
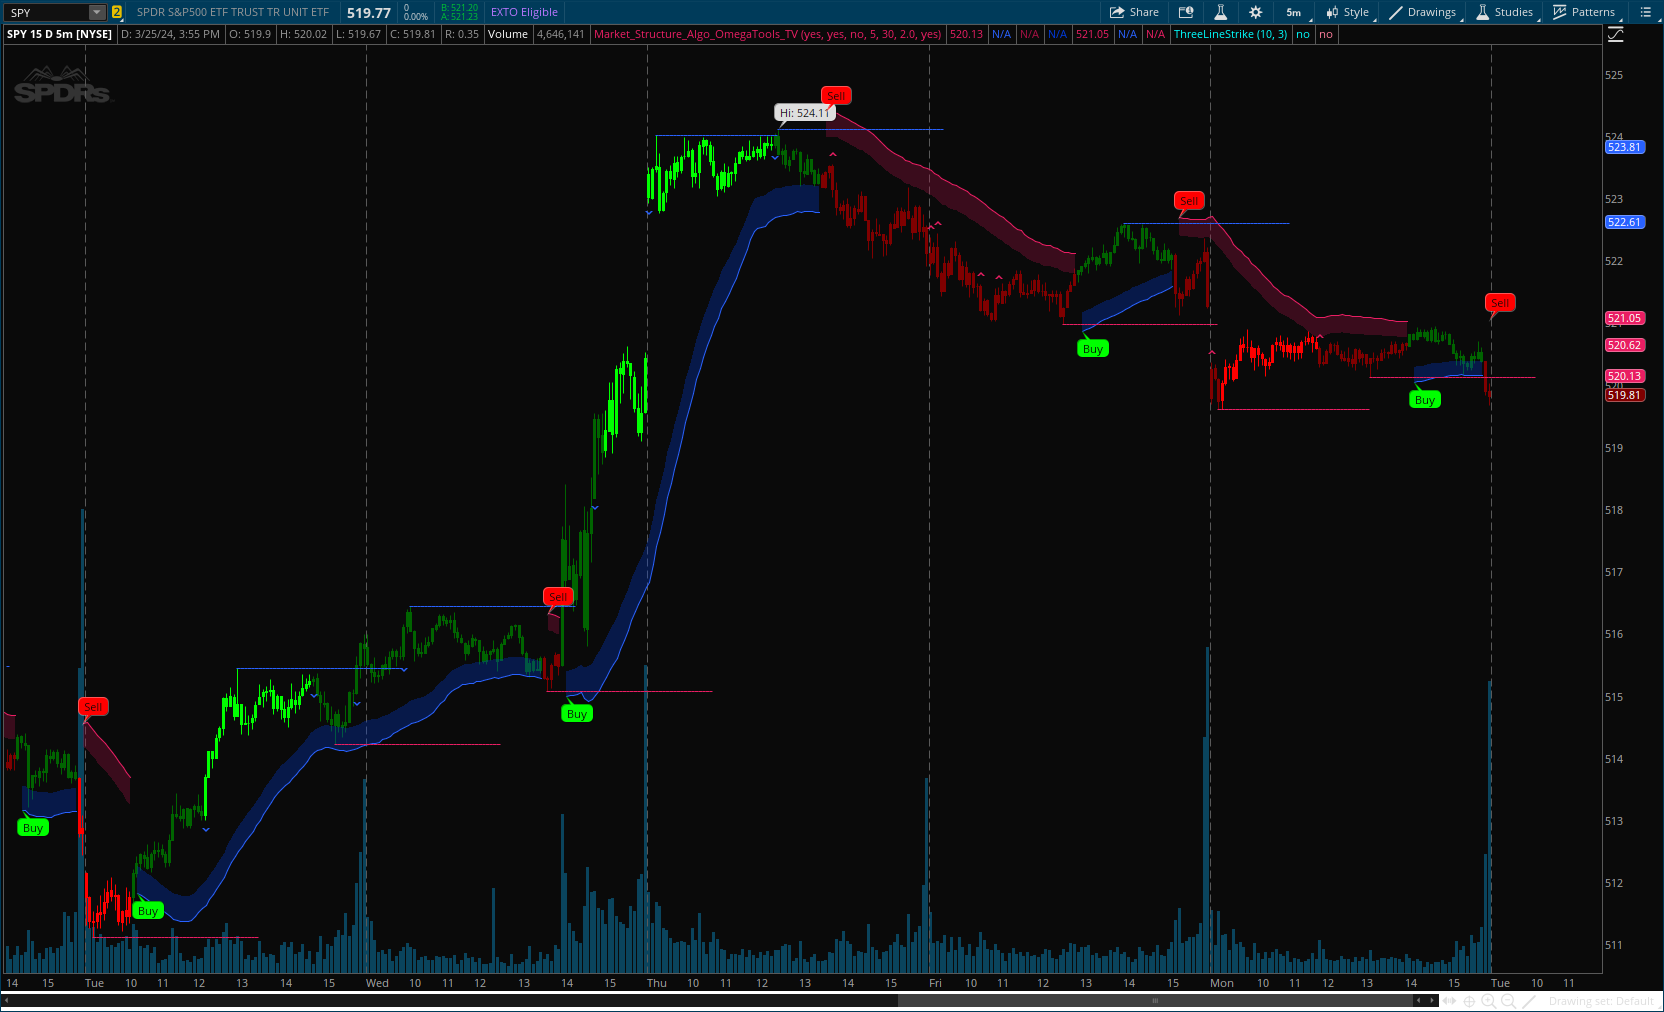
- The MS Algo calculates pivot highs and lows over specified periods (input by the user) to determine the market's current structure. It then evaluates the market's position relative to these pivot points to assign a market structure score, which can range from bullish to bearish extremes.
- Signals for long and short positions, as well as exits, are generated based on the interaction between the close price and these pivot points.
- Additionally, the indicator plots zones around the moving average, adjusted for the ATR and the specified 'Zone Distance,' providing a visual guide to areas where the market might find support or resistance.
CODE:
CSS:
#/ This Pine Script™ code is subject to the terms of the Mozilla Public License 2.0 at https://mozilla.org/MPL/2.0/
#// © OmegaTools
#indicator("Market Structure Algo", "MS Algo", true)
# Converted by Sam4Cok@Samer800    - 03/2024

input colorBars = yes;
input showExternalMarketStructureLines = yes;
input showInternalMarketStructureLines = no;
input InternalMS = 5; #, "Internal MS", minval = 2)
input ExternalMS = 30; #, "External MS", minval = 7)
input ZoneDistance = 2.00; #, "Zone Distance", minval = 1, step = 0.1, inline = "zone")
input showZone = yes; #(true, "", inline = "zone")

def na = Double.NaN;

def right = InternalMS;
def right1 = ExternalMS;

DefineGlobalColor("up", CreateColor(41, 98, 255)); # "Positive color"
DefineGlobalColor("dn", CreateColor(233, 30, 99)); # "Negative color"
DefineGlobalColor("bgup", CreateColor(0, 58, 220)); # "Positive color"
DefineGlobalColor("bgdn", CreateColor(170, 17, 69)); # "Negative color"

script Pivots {
    input series    = close;
    input leftBars  = 10;
    input rightBars = 10;
    input isHigh = yes;
    def na = Double.NaN;
    def HH = series == Highest(series, leftBars + 1);
    def LL = series == Lowest(series, leftBars + 1);
    def pivotRange = (leftBars + rightBars + 1);
    def leftEdgeValue = if series[pivotRange] == 0 then na else series[pivotRange];
    def pvtCond = !IsNaN(series) and leftBars > 0 and rightBars > 0 and !IsNaN(leftEdgeValue);
    def barIndexH = if pvtCond then
                    fold i = 1 to rightBars + 1 with p=1 while p do
                    series > GetValue(series, - i) else na;
    def barIndexL = if pvtCond then
                    fold j = 1 to rightBars + 1 with q=1 while q do
                    series < GetValue(series, - j) else na;
    def PivotPoint;
    if isHigh {
        PivotPoint = if HH and barIndexH then series else na;
    } else {
        PivotPoint = if LL and barIndexL then series else na;
    }
    plot pvt = PivotPoint;
}

#// Internal
def pvh = pivots(high, InternalMS, right, yes)[right];
def pvl = pivots(low, InternalMS, right, no)[right];
def ph = if !IsNaN(pvh) then pvh else ph[1];
def pl = if !IsNaN(pvl) then pvl else pl[1];

def currenth;
def lasth;
if !IsNaN(pvh) {
    lasth = currenth[1];
    currenth = high[right];
} else {
    lasth = lasth[1];
    currenth = currenth[1];
}
def currentl;
def lastl;
if !IsNaN(pvl) {
    lastl = currentl[1];
    currentl = low[right];
} else {
    lastl = lastl[1];
    currentl = currentl[1];
}
def ms = if currenth > lasth and currentl > lastl and close > ph then 2 else
         if close > ph then 1 else
         if currenth < lasth and currentl < lastl and close < pl then -2 else
         if close < pl then -1 else ms[1];
def longsig   = close > ph and ms[1] < 0;
def shortsig  = close < pl and ms[1] > 0;
def longsig1  = close > ph and ms[1] > 0;
def shortsig1 = close < pl and ms[1] < 0;
def longsig2  = longsig1 and longsig1[1] == no and longsig[1] == no;
def shortsig2 = shortsig1 and shortsig1[1] == no and shortsig[1] == no;

#// External
def pvh1 = pivots(high, ExternalMS, right1, yes)[right1];
def pvl1 = pivots(low, ExternalMS, right1, no)[right1];
def ph1 = if !IsNaN(pvh1) then pvh1 else ph1[1];
def pl1 = if !IsNaN(pvl1) then pvl1 else pl1[1];
#// Zone
def ma = Average(close, ExternalMS);
def atr = ATR(Length = ExternalMS);
def ma2 = if ms > 0 and ms[1] > 0 then ma - atr * ZoneDistance else
          if ms < 0 and ms[1] < 0 then ma + atr * ZoneDistance else na;
def ma3 = if ms > 0 and ms[1] > 0 then ma2 + atr else
          if ms < 0 and ms[1] < 0 then ma2 - atr else na;

#// Plot
def r0 = Round(right/2,  0) + right;
def r1 = Round(right1/2, 0) + right1;
def l1 = if !IsNaN(pvh[-right]) then ph[-right] else l1[1];
def l2 = if !IsNaN(pvl[-right]) then pl[-right] else l2[1];
def l3 = if !IsNaN(pvh1[-right1]) then ph1[-right1] else l3[1];
def l4 = if !IsNaN(pvl1[-right1]) then pl1[-right1] else l4[1];
def c1 = if !IsNaN(pvh[-right]) then 0 else c1[1] + 1;
def c2 = if !IsNaN(pvl[-right]) then 0 else c2[1] + 1;
def c3 = if !IsNaN(pvh1[-right1]) then 0 else c3[1] + 1;
def c4 = if !IsNaN(pvl1[-right1]) then 0 else c4[1] + 1;

def col = if close > ma2 then 1 else if close < ma2 then -1 else 0;
def barCol = if ms >= 2 then  2 else
             if ms == 1 then  1 else
             if ms <=-2 then -2 else
             if ms ==-1 then -1 else 0;

plot Line4 = if showExternalMarketStructureLines and l4 and c4 <= r1 then l4 else na;
plot Line3 = if showExternalMarketStructureLines and l3 and c3 <= r1 then l3 else na;
plot Line2 = if showInternalMarketStructureLines and l2 and c2 <= r0 then l2 else na;
plot Line1 = if showInternalMarketStructureLines and l1 and c1 <= r0 then l1 else na;
Line4.SetPaintingStrategy(PaintingStrategy.HORIZONTAL);
Line3.SetPaintingStrategy(PaintingStrategy.HORIZONTAL);
Line2.SetPaintingStrategy(PaintingStrategy.DASHES);
Line1.SetPaintingStrategy(PaintingStrategy.DASHES);
Line4.setDefaultColor(GlobalColor("dn"));
Line3.setDefaultColor(GlobalColor("up"));
Line2.setDefaultColor(GlobalColor("bgdn"));
Line1.setDefaultColor(GlobalColor("bgup"));

plot ExternalZone = if showZone and col then ma2 else na; # "External Zone"
def InternalZone = if showZone and col then ma3 else na; # "Internal Zone"
ExternalZone.AssignValueColor(if col >0  then GlobalColor("up") else GlobalColor("dn"));

AddCloud(InternalZone, ExternalZone, GlobalColor("bgup"), GlobalColor("bgdn"));

#-- Signals
plot buy = if longsig2 then low else na;       # "Buy Signal"
plot sell = if shortsig2 then high else na;    # "Sell Signal"

buy.SetPaintingStrategy(PaintingStrategy.BOOLEAN_WEDGE_DOWN);
sell.SetPaintingStrategy(PaintingStrategy.BOOLEAN_WEDGE_UP);
buy.SetDefaultColor(GlobalColor("up"));
sell.SetDefaultColor(GlobalColor("dn"));

AddChartBubble(longsig[1], if showZone then ma2 else low, "Buy", Color.GREEN, no);
AddChartBubble(shortsig[1],if showZone then ma2 else high, "Sell", Color.RED);

#-- BarColor
AssignPriceColor(if !colorBars then Color.CURRENT else
                 if barCol == 2 then Color.GREEN else
                 if barCol == 1 then Color.DARK_GREEN else
                 if barCol ==-2 then Color.RED else
                 if barCol ==-1 then Color.DARK_RED else Color.GRAY);

#-- END of CODE
Last edited by a moderator: