#// This source code is subject to the terms of the Mozilla Public License 2.0 a
#// © makit0
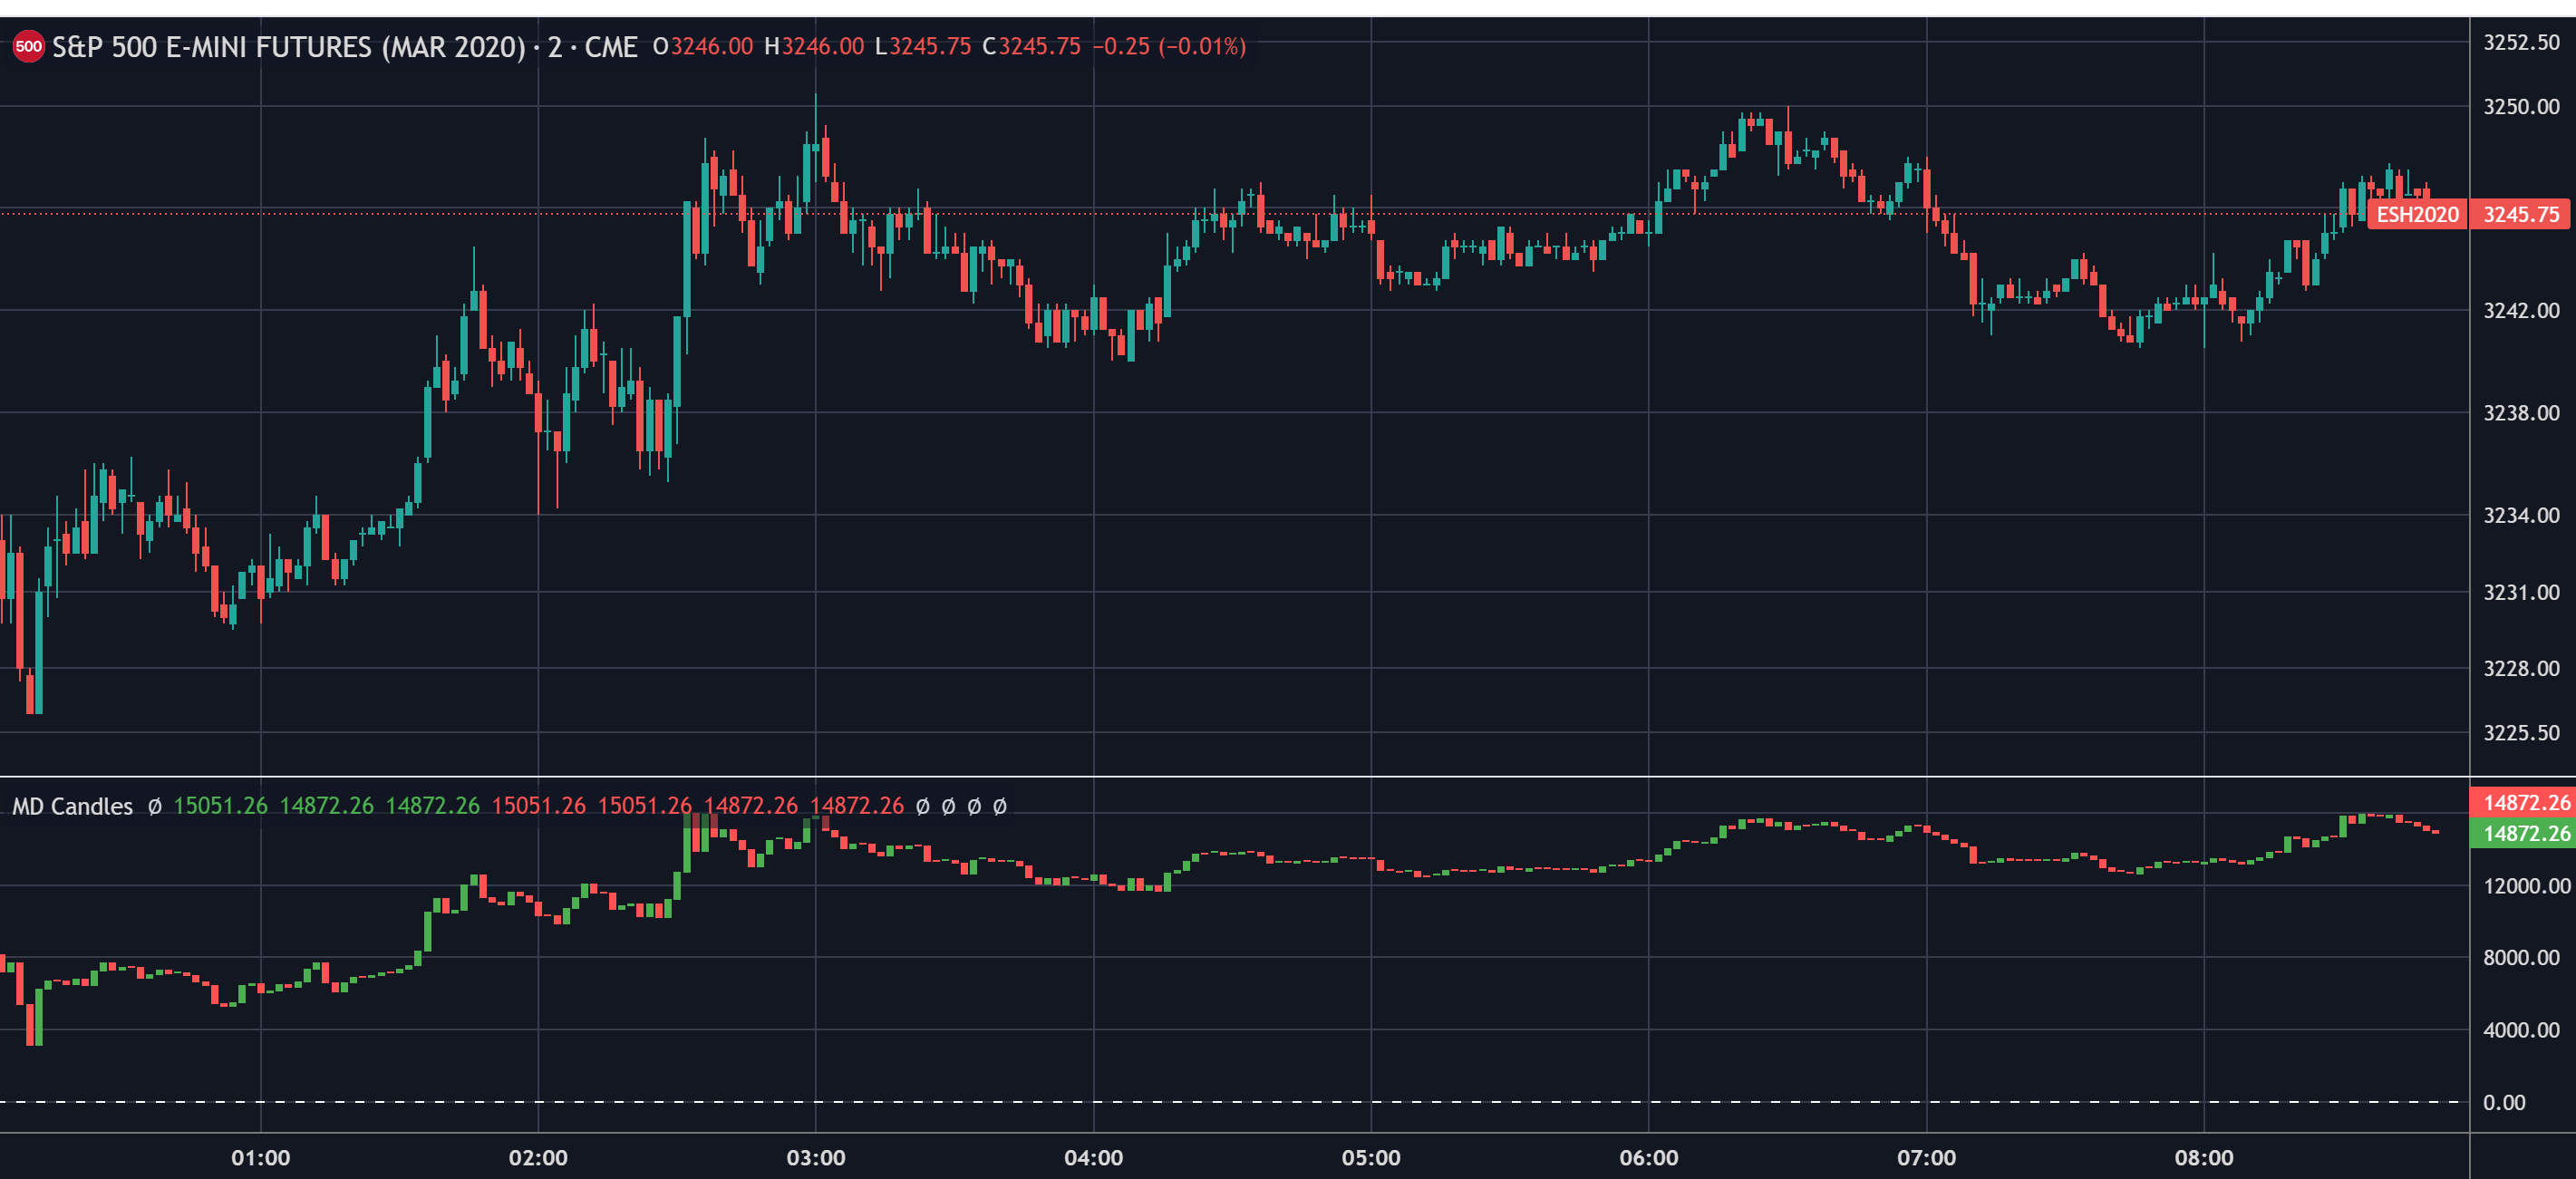
#// MARKET DELTA INDICATOR v0.5 beta
#study("Market_Delta_v0.5Beta",shorttitle='MD')
# converted by Sam4Cok@Samer800 - 01/2024
declare lower;
input mode = {"Volume", "Delta", "Cumulative Delta", default "Candles"};# #'Mode'
input showZeroLine = no;#(false,'Show Zero line')
#// show/hide variables for the different modes
def na = Double.NaN;
def last = IsNaN(close);
def showVol = mode == mode."Volume";
def showDelta = mode == mode."Delta";
def showCumDelta = mode == mode."Cumulative Delta";
def showCandles = mode == mode."Candles";
def mintick = TickSize();
DefineGlobalColor("up", CreateColor(76,175,80));
DefineGlobalColor("dn", CreateColor(255,82,82));
#// volume & delta calculus
def up = open > close;
def candleRange = (high - low) / mintick;
def candleTopWick = if up then ((high - open) / mintick) else ((high - close) / mintick);
def candleBottomWick = if up then (close - low) / mintick else (open - low) / mintick;
def ticksUp = if up then candleTopWick + candleBottomWick else candleRange;
def ticksDown = if up then candleRange else candleTopWick + candleBottomWick;
def totalTicks = ticksUp + ticksDown;
def volByTick = if totalTicks == 0 then 0 else volume / totalTicks;
def volUp = ticksUp * volByTick;
def volDown = ticksDown * volByTick;
def delta = volUp - volDown;
#// cumulative delta reset at globex and rth openings
def time = GetTime();
def rthOpen = (time-1) == RegularTradingStart(GetYYYYMMDD());
def cumDelta = if rthOpen then delta else cumDelta[1] + delta;
#// getting ohlc values to plot the cumulative delta candles.
def o1 = if rthOpen then 0 else cumDelta[1];
def h1 = if delta >= 0 then cumDelta else
if rthOpen then 0 else cumDelta[1];
def l1 = if delta <= 0 then cumDelta else
if rthOpen then 0 else cumDelta[1];
def c1 = cumDelta;
#// fixing scale autoresize in volume and delta modes
def o;
def h;
def l;
def c;
if !showCandles {
o = na;
h = na;
l = na;
c = na;
} else {
o = o1;
h = h1;
l = l1;
c = c1;
}
AddChart(open = if o<=c then c else na, high = h , low = l , close = o,
type = ChartType.CANDLE, growcolor = GlobalColor("up"));
AddChart(open = if o>=c then o else na, high = h , low = l , close = c,
type = ChartType.CANDLE, growcolor = GlobalColor("dn"));
#// plotting volume, delta and cumulative delta. I wanted to define the style as histogram but due a bug at auto resizing the scale for the candle mode, I coded the style as areabr and circles, but the style to use here is histogram.
plot upVol = if showVol then volUp else na; # 'Up volume'
plot dnVol = if showVol then -volDown else na; # 'Down volume'
plot deltaL = if showDelta then delta else na; # 'Delta'
plot cum = if showCumDelta then cumDelta else na; # 'Cumulative Delta'
plot zero = if showZeroLine and !last then 0 else na;# 'Zero line'
zero.SetDefaultColor(Color.GRAY);
zero.SetStyle(Curve.SHORT_DASH);
upVol.SetDefaultColor(Color.GREEN);
dnVol.SetDefaultColor(Color.RED);
deltaL.SetPaintingStrategy(PaintingStrategy.POINTS);
deltaL.AssignValueColor(if delta > 0 then Color.GREEN else Color.RED);
deltaL.SetLineWeight(3);
cum.AssignValueColor(if cumDelta > 0 then Color.GREEN else Color.RED);
AddCloud(cum, 0, GlobalColor("up"), GlobalColor("dn"));
AddCloud(upVol, 0, GlobalColor("up"));
AddCloud(0, dnVol, GlobalColor("dn"));
#-- End of Code