Market Force Indicator for ThinkorSwim

BenTen

Administrative
Staff member
Staff
VIP
Lifetime
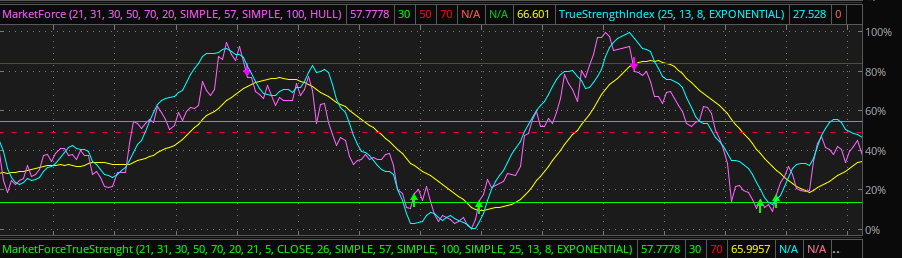
Another indicator that shows when a stock is overbought or oversold. Not sure why the original source code is no longer available. But I was able to obtain part of the description from an old copy.

This is the best indicator that measures the strength of the market and //predicts its movement.

W05txPo.png

WJeKd6D.png


thinkScript Code

Code:
# Market Force
# Assembled by BenTen at useThinkScript.com
# Converted from https://www.tradingview.com/script/SmMnX3ZK-forcemarket/

declare lower;

input D = 21;
input D1 = 31;

input L1 = 30;
input L2 = 50;
input L3 = 70;

def X = if (close>close[1]) then absValue(close-close[1]) else 0;
def Y = if (close<close[1]) then absValue(close-close[1]) else 0;
def X1 = highest(X, D);
def Y1 = highest(Y, D);
def W = 100 * X1 / (X1 + Y1);
def W1 = 100 * simpleMovingAvg(X, D1) / (simpleMovingAvg(X, D1) + simpleMovingAvg(Y, D1));

plot mf = W1;

plot oversold = L1;
plot middle = L2;
plot overbought = L3;

oversold.setDefaultColor(color.green);
middle.setDefaultColor(color.gray);
overbought.setDefaultColor(color.red);
 
To plot the arrows.

Code:
plot arrowup = if mf crosses above oversold then mf else double.NaN;

arrowup.setPaintingStrategy(paintingStrategy.ARROW_UP);
arrowup.assignValueColor(color.green);

plot arrowdown = if mf crosses below overbought then mf else double.NaN;

arrowdown.setPaintingStrategy(paintingStrategy.ARROW_DOWN);
arrowdown.assignValueColor(color.magenta);

To plot the arrows on the price chart, comment-out "declare: lower" and add this:

Code:
plot arrowup = if mf crosses above oversold then mf else double.NaN;

arrowup.setPaintingStrategy(paintingStrategy.ARROW_UP);
arrowup.assignValueColor(color.green);

plot arrowdown = if mf crosses below overbought then mf else double.NaN;

arrowdown.setPaintingStrategy(paintingStrategy.ARROW_DOWN);
arrowdown.assignValueColor(color.magenta);

plot SignalUP = if arrowup then HL2 else double.nan;
SignalUP.SetDefaultColor(Color.CYAN);
SignalUP.SetPaintingStrategy(PaintingStrategy.ARROW_UP);

plot SignalDOWN = if arrowdown then HL2 else double.nan;
SignalDOWN.SetDefaultColor(Color.MAGENTA);
SignalDOWN.SetPaintingStrategy(PaintingStrategy.ARROW_DOWN);
 
Last edited by a moderator:
@marine Both will show overbought and oversold but using different method/calculation.
 
This is the best indicator that measures the strength of the market and //predicts its movement. o_O :ROFLMAO::ROFLMAO::ROFLMAO::ROFLMAO::ROFLMAO::ROFLMAO:
 
Threw Tarzan on it for the fun of it, someone else can test and play with it if they wish
Code:
# Market Force Tarzan
# Assembled by BenTen at useThinkScript.com
# Converted from https://www.tradingview.com/script/SmMnX3ZK-forcemarket/
#Modified by TradeByDay

declare lower;

input D = 21;
input D1 = 31;

input L1 = 30;
input L2 = 50;
input L3 = 70;

def X = if (close>close[1]) then absValue(close-close[1]) else 0;
def Y = if (close<close[1]) then absValue(close-close[1]) else 0;
def X1 = highest(X, D);
def Y1 = highest(Y, D);
def W = 100 * X1 / (X1 + Y1);
def W1 = 100 * simpleMovingAvg(X, D1) / (simpleMovingAvg(X, D1) + simpleMovingAvg(Y, D1));

plot mf = W1;

plot oversold = L1;
plot middle = L2;
plot overbought = L3;

oversold.setDefaultColor(color.green);
middle.setDefaultColor(color.gray);
overbought.setDefaultColor(color.red);

input length = 20;
input ma_length = 21;
input koridor  = 5;

input price = close;

def ma = ExpAverage(mf, 50);
plot upper = ma + koridor;
upper.SetDefaultColor(GetColor(8));
plot lower = ma - koridor;
lower.SetDefaultColor(GetColor(8));

plot k = ma;
k.SetPaintingStrategy(PaintingStrategy.LINE_VS_SQUARES);
k.AssignValueColor(if mf > upper then Color.GREEN else if mf < lower then Color.RED else Color.GRAY);

#End
 
Hi, may i know how to build this as a scan to scan out stock that have arrow up on the chart..many thanks

Hi, I have added the quote but this is what i got...may i know where did i get it wrong? Thank

This is the code i have amended to have the arrows on the chart...but i m not getting right...appreciate any guidance...thank you

JvHHHC8.jpg
 
Last edited by a moderator:
@Nick Sorry for getting back to you so late. My wifi has been very unstable. You do not need any additional code to use with the scanner.

Here is an example: this would scan for the blue line (mf) crossing below the Overbought line (red). You can use the same logic for whichever line you wish to use.

4kQCrQ6.png
 
hey @BenTen this indicator is amazing, can you explain a little more what's your reasoning or how you built it so I can contribute with my insights? thank you so much!
 
@BenTen just tried a new setup and this looks really good with the True Strenght Index but I can't figure out how to get it normalized, do you have any idea?
9Z6U3O.jpg
 
@hectorgasm Did you drag/drop multiple indicators into the same lower study? If so, most likely it will create scaling issues.
 
@stocksniper Define the condtion. You can the arrow when stock is at overbought and oversold?
@BenTen , really awesome work on this one. Seems easy and accurate. For the scan portion...thoughts on how to capture any crossover that has sustained for the last day (or 2 days) as opposed to capturing any crossover that has happened just once in the last day?
 
@ikpllc You can always increase the "within X bar" in your scanner and that will extend past how many candles you're looking for.
 

Join useThinkScript to post your question to a community of 21,000+ developers and traders.

Similar threads

Not the exact question you're looking for?

Start a new thread and receive assistance from our community.

87k+ Posts
474 Online
Create Post

Similar threads

Similar threads

The Market Trading Game Changer

Join 2,500+ subscribers inside the useThinkScript VIP Membership Club
  • Exclusive indicators
  • Proven strategies & setups
  • Private Discord community
  • ‘Buy The Dip’ signal alerts
  • Exclusive members-only content
  • Add-ons and resources
  • 1 full year of unlimited support

Frequently Asked Questions

What is useThinkScript?

useThinkScript is the #1 community of stock market investors using indicators and other tools to power their trading strategies. Traders of all skill levels use our forums to learn about scripting and indicators, help each other, and discover new ways to gain an edge in the markets.

How do I get started?

We get it. Our forum can be intimidating, if not overwhelming. With thousands of topics, tens of thousands of posts, our community has created an incredibly deep knowledge base for stock traders. No one can ever exhaust every resource provided on our site.

If you are new, or just looking for guidance, here are some helpful links to get you started.

What are the benefits of VIP Membership?
VIP members get exclusive access to these proven and tested premium indicators: Buy the Dip, Advanced Market Moves 2.0, Take Profit, and Volatility Trading Range. In addition, VIP members get access to over 50 VIP-only custom indicators, add-ons, and strategies, private VIP-only forums, private Discord channel to discuss trades and strategies in real-time, customer support, trade alerts, and much more. Learn all about VIP membership here.
How can I access the premium indicators?
To access the premium indicators, which are plug and play ready, sign up for VIP membership here.
Back
Top