
I'm simply posting this for no reason other than to share. I have gotten a lot of good ideas from this forum so I wanted to give back.
The below is a pivot script. I've turned Ehlers Laguerre Average into Zig Zag. It is just my opinion, but I believe these pivots are far more superior than others because most pivots use future bars and this uses a limited amount to confirm. My intent was to decrease lag as it is a major draw down to pivots. I had pasted the first version of this on another post, but this is a clean/ up-to-date version
Notes:
1. Personally, I would not use for intraday as the zz can misfire - that doesn't mean it can't be changed to accommodate intraday.
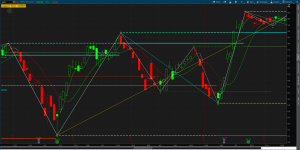
2. I made a custom second order pivots logic which cycles much like an elliot wave. Once you turn the ZZ on, it will mirror elliot in some ways.
3. The second and third order pivot logic is also used in support and resistance lines. I find it very useful
4. The bubble guide will also identify double bottoms, double tops, higher highs and lower low with continued sequence counts. this is useful in many ways.
5. The pivot will repaint until the reversal is confirmed. Once direction is confirmed, it will not repaint. I personally like this feature in combination with support and resistance on intraday.
Indicator: https://tos.mx/Dqi8PqT
IMPORTANT: Should a scripter want to help, I would like to keep the pivot logic but without a fold. As you can see below, if we could accomplish this, it would be extremely useful/profitable. For example, look at the price color. If price color was based off Laguerre, your looking at colors changing 2-4 bars afterwards. Just a thought but even if we could get closer to the below script, it would be a really good thing")
Enjoy all. i hope it helps.


The below is a pivot script. I've turned Ehlers Laguerre Average into Zig Zag. It is just my opinion, but I believe these pivots are far more superior than others because most pivots use future bars and this uses a limited amount to confirm. My intent was to decrease lag as it is a major draw down to pivots. I had pasted the first version of this on another post, but this is a clean/ up-to-date version
Notes:
1. Personally, I would not use for intraday as the zz can misfire - that doesn't mean it can't be changed to accommodate intraday.
2. I made a custom second order pivots logic which cycles much like an elliot wave. Once you turn the ZZ on, it will mirror elliot in some ways.
3. The second and third order pivot logic is also used in support and resistance lines. I find it very useful
4. The bubble guide will also identify double bottoms, double tops, higher highs and lower low with continued sequence counts. this is useful in many ways.
5. The pivot will repaint until the reversal is confirmed. Once direction is confirmed, it will not repaint. I personally like this feature in combination with support and resistance on intraday.
Indicator: https://tos.mx/Dqi8PqT
IMPORTANT: Should a scripter want to help, I would like to keep the pivot logic but without a fold. As you can see below, if we could accomplish this, it would be extremely useful/profitable. For example, look at the price color. If price color was based off Laguerre, your looking at colors changing 2-4 bars afterwards. Just a thought but even if we could get closer to the below script, it would be a really good thing
Enjoy all. i hope it helps.
Attachments
Last edited by a moderator: