#// This source code is subject to the terms of the Mozilla Public License 2.0 at https://mozilla.org/MPL/2.0/
#// © allanster on TradingView
# https://www.tradingview.com/v/S7HGang6/
# 'concept. Whenever this setting is enabled the indicator should be regarded as operating in an experimental mode.'
#// Original concept by David Bostian, with variations featured in "Bollinger on Bollinger Bands".
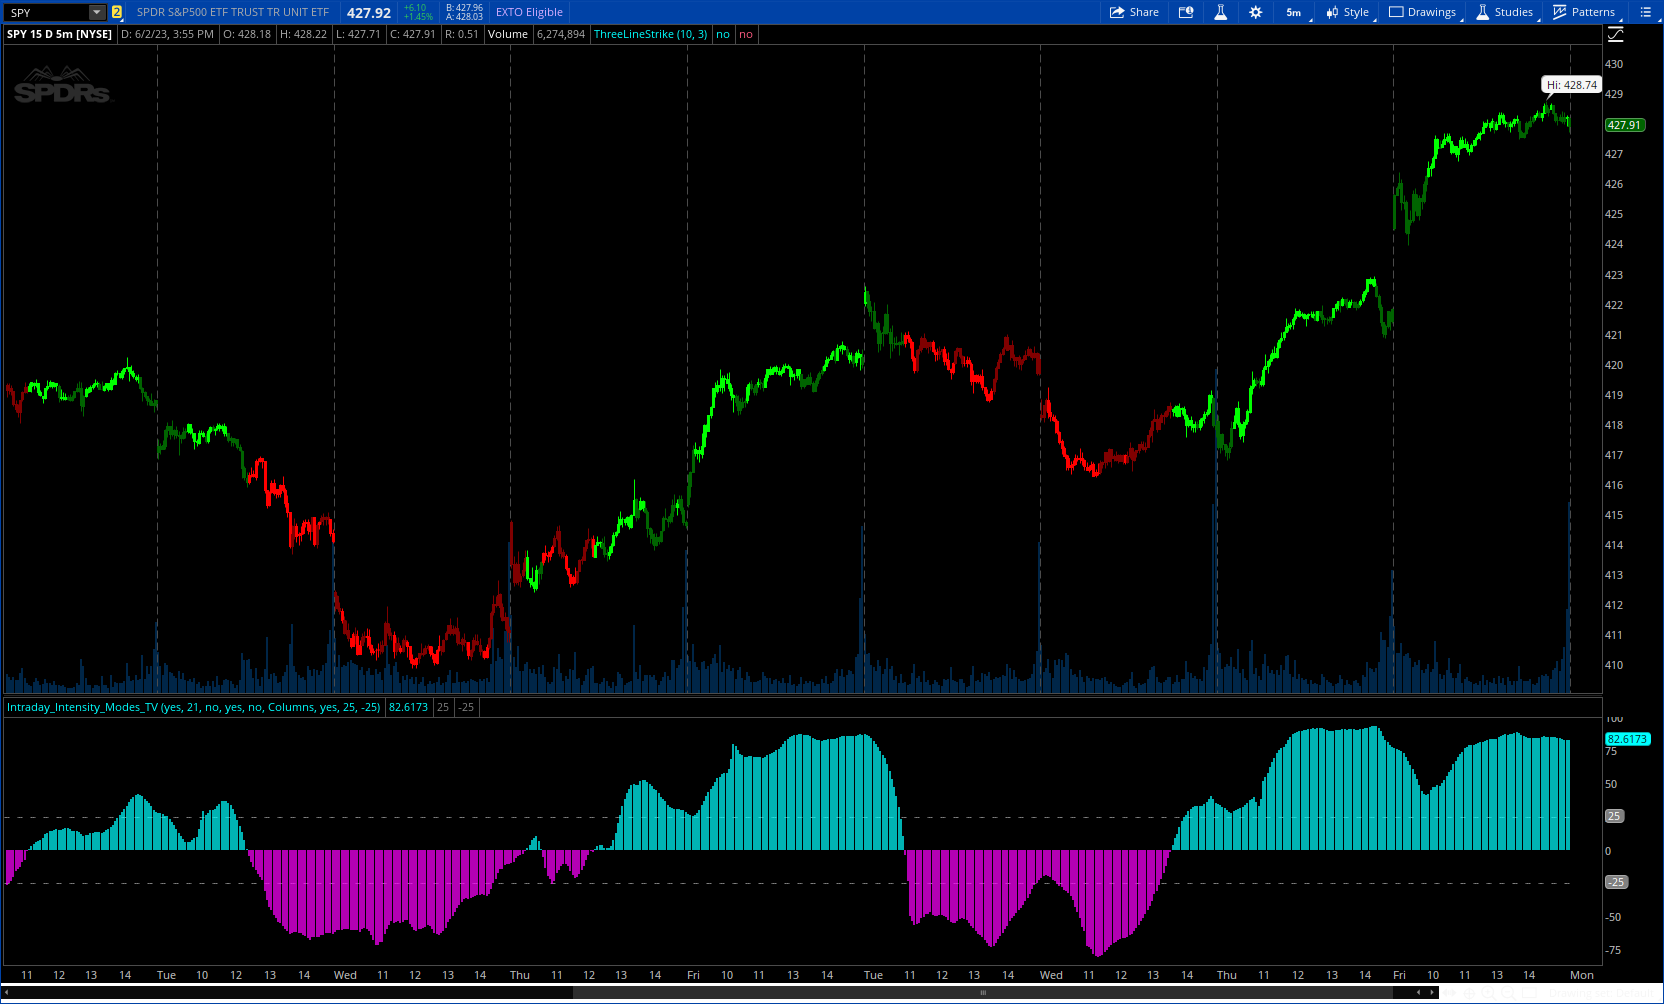
#indicator("Intraday Intensity Modes", 'Intensity')
# converted by Sam4Cok@Samer - 06/2023
declare lower;
input ColorBars = yes;
input OscLength = 21; # 'Osc Length'
input Cumulative = no; # 'Cumulative'
input Normalized = yes; # 'Normalized'
input Intrabar = no; # 'Intrabar'
input chartStyle = {default Columns, Histogram, Line}; # 'Style & Width'
input ShowLevels = yes;
input ShowLevelAbove = 25; # 'Show Levels Above'
input ShowLevelBelow = -25; # 'Below'
def na = Double.NaN;
def last = isNaN(Close);
def i_length = OscLength;
def Columns = chartStyle==chartStyle.Columns;
def Histogram = chartStyle==chartStyle.Histogram;
#id_cum(source) => // perform cumulative sum once per day when using realtime intraday source values
script id_cum {
input source = close;
def current = GetAggregationPeriod();
def isintraday = current < AggregationPeriod.DAY;
def startDay = GetYYYYMMDD() - GetYYYYMMDD()[1];
def carrySum;
def dailySum;
if isintraday {
dailySum = CompoundValue(1, if startDay then carrySum[1] else dailySum[1], source[1]);
carrySum = dailySum + source;
} else {
dailySum = Double.NaN;
carrySum = CompoundValue(1,carrySum[1] + source, source);
}
plot out = if carrySum==0 then Double.NaN else carrySum;
}
#altSum(source, length)
script altSum {
input source = close;
input length = 21;
def normal = Sum(if(isNaN(source),0,source), length);# // treat na as 0 and return sum
plot out = normal;
}
def startDay = GetYYYYMMDD() - GetYYYYMMDD()[1];
def current = GetAggregationPeriod();
def isintraday = current < AggregationPeriod.DAY;
def idRangeH;def idRangeL;def idVolume;
def idH = if idRangeH[1]==0 then high[1] else idRangeH[1];
idRangeH = if (!isintraday or startDay) then high else
if high > idH then high else idH;# // intraday high
def idL = if idRangeL[1]==0 then low[1] else idRangeL[1];
idRangeL = if (!isintraday or startDay) then low else
if low < idL then low else idL;# // intraday low
def idVol = if idVolume[1]==0 then volume else idVolume[1];
idVolume = if (!isintraday or startDay) then volume else idVol + volume;
def iiValue = ((2 * close - idRangeH - idRangeL) / (idRangeH - idRangeL)) * idVolume; # // intraday intensity
def iiiValue = if isNaN(iiValue) then 0 else iiValue;
def iii = ((2 * close - high - low) / (high - low)) * volume;
def TotVol = CompoundValue(1, TotVol[1] + volume, volume);
def TotSumiii = (CompoundValue(1, TotSumiii[1] + iii, iii));
def cumiii = id_cum(iiiValue);
def cumVol = id_cum(idVolume);
def Sumii1 = if Cumulative then if Intrabar then TotSumiii else cumiii else if Intrabar then iii else iiiValue;
def Sumii2 = if Cumulative then if Intrabar then TotVol else cumVol else
if Intrabar then volume else idVolume;
def usePrcnt = if Normalized then 100 else 1;
def iiSource = usePrcnt * altSum(Sumii1, i_length) / (if Normalized then altSum(Sumii2, i_length) else 1);
def colrSign = altSum(if Intrabar then iii else iiiValue, i_length) /
(if Normalized then if Intrabar then volume else altSum(idVolume, i_length) else 1);
def upCandle = sign(colrSign) != -1;
plot Intensity = if last then na else iiSource;
Intensity.SetLineWeight(2);
Intensity.SetPaintingStrategy(if Histogram then PaintingStrategy.HISTOGRAM else
if Columns then PaintingStrategy.SQUARED_HISTOGRAM else PaintingStrategy.LINE);
Intensity.AssignValueColor(if upCandle then Color.CYAN else Color.MAGENTA);
plot hline = if last or !ShowLevels then na else ShowLevelAbove;
plot lline = if last or !ShowLevels then na else
if Cumulative then 0 else ShowLevelBelow;
hline.SetDefaultColor(Color.GRAY);
lline.SetDefaultColor(Color.GRAY);
hline.SetStyle(Curve.SHORT_DASH);
lline.SetStyle(Curve.SHORT_DASH);
AssignPriceColor(if !ColorBars then Color.CURRENT else if upCandle then
if iiSource>iiSource[1] then Color.GREEN else Color.DARK_GREEN else
if iiSource<iiSource[1] then Color.RED else Color.DARK_RED);
#// Reference Equations Used
#// III = ((2 * close) - high - low) / ((high - low) * volume)
#--- END of CODE