Indicators Not Working in ThinkorSwim Mobile App

markos

Well-known member
VIP
A number of thinkScript features are known to have issues on the mobile apps
  1. Different time aggregations
  2. Bubbles
  3. Labels
  4. Plots between days
  5. Extension area

How to Fix Indicators Not Working on ThinkorSwim App

For Mobile: You must first create the study on TOS desktop. Use a text editor like Notepad++ or other .txt file creator and copy - paste the script at the top of the page. The # symbol is used at the front of each line to "comment out" those lines that won't work. Do same in Thinkscript editor if you would rather. Comment out everything but the bare necessities. Save that as your "StudyName_Mobile" file. The rest is trial and error from my vantage point. Load it on your mobile phone and the settings that should work aught to be on the mobile study set up page.

Feel free to call the super secret phone number for help if you get stuck. Most of those people are on top of things.
 
Last edited:

Join useThinkScript to post your question to a community of 21,000+ developers and traders.

I recently discovered this indicator and it fits my methodology perfectly. Question, there is no way to use this indicator on thinkorswim mobile apparently. I'm trying to understand what is happening with the indicator to calculate and wondering if any other indicator on thinkorswim mobile is close enough to use if I'm away from my trading computer?

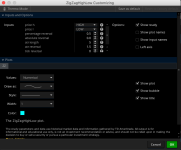
Here is a snapshot of the settings that I'm using on the daily and hourly chart.

qM8SK9h.png
 

Attachments

  • qM8SK9h.png
    qM8SK9h.png
    51.4 KB · Views: 185
Last edited by a moderator:
I don’t think this will work on their mobile app. The ToS app itself is very limited.

Yeah I saw that. I was asking if someone might be able to explain how the indicator is calculating. I see it is using ATR 5 period with a 1.5 reversal amount and 0.5 reversal. I originally thought what was happening that once the underlying moves 1.5 x ATR 5 then the zig zag would change direction, but it doesn't look that way when you calculate the numbers.
 
Markos or anyone: I thought the TOS mobile app is limited to the crummy studies they have on it. Are you saying we can use the indicators from our TOS desktop on the TOS mobile app? How do we do that? Thanks.
 
@Tradervic That’s correct, only ToS built-in indicators will work on the mobile app. There are exceptions for some custom indicators though. You just have to load it up and see if they work.
 
my experience is custom indicators will work just not the ones listed above like vertical lines or labels or bubbles or color changes for slopes and lines and things like that, arrows work lines work most everything works clouds do not work but dots work. it is just trail and error till you get it to look the way you want it too.
 
Certain ways of plotting may not work on mobile. Often, you'll just have to find other ways to have it do the same thing. For example, using conditions in AssignValueColor to assign color depending on the direction of a plot may not work. In this case, you'll have to have a plot for up and another plot for down and then use SetDefaultColor to defined the color for each direction. Example...

data.AssignValueColor(if data >0 then Color.Green else if data < 0 then Color.RED else Color.GRAY);

So instead of the line above, we may have to do something like...

plot upCond = if(data > 0, data, Double.Nan);
plot dnCond = if(data < 0, data, Double.Nan);
upCond.SetDefaultColor(Color.CYAN);
dnCond.SetDefaultColor(Color.RED);

So you may just have to find another method of getting the same result.
 
@tradegeek i'm not using conditional for colors. Might be some Mathematical computations. I will comment my code and check line by line.
arrow.SetPaintingStrategy(PaintingStrategy.ARROW_DOWN);
arrow.SetDefaultColor(Color.ORANGE);
arrow.SetLineWeight(5);
 
Some of my indicators that have dynamic coloring don't display properly on my Android (Samsung) phone with the TOS mobile app. I would like to get a tablet that displays the indicators correctly. Would a tablet with Windows display my indicators the same as the do on my Windows desktop? Would a Windows tablet allow me to use the TOS drawing tools?
 
Hi guys,

Is there anyway that the comparison study can be made into a custom study that can be used on mobile? As of right now the study can only be used on desktop and the study allows you to overlay your chart with another stock symbol so you can compare the two. Mobile doesn’t have access to the study.

Thanks.
 
Gotcha thanks. It is quite limited, more than I would like. Especially considering the two symbol overlay possible on yahoo finance on mobile, yet tos doesn’t on mobile like desktop lol.
 
Is it possible to plot the current ask for the aggregation period as a line on a lower study that will work on mobile? Or to plot candles?
 
Hi, I notice that TOS mobile does not show correct indicator.
for example, please compare RSI length 5 on 1h chart between TOS desktop and TOS mobile.
Do you see the same values? I don't :(
 
That is because the chart on your ToS mobile app uses a slightly different setting. More specifically, it has the option called "Start aggregations at market open" unchecked.

You can make the ToS desktop version to match your mobile app but not vice versa.

6yRRjm5.png


Also, pay attention to see if extended hours is enabled for either version. That could change the value of the same indicator.
 

Similar threads

Not the exact question you're looking for?

Start a new thread and receive assistance from our community.

87k+ Posts
449 Online
Create Post

Similar threads

Similar threads

The Market Trading Game Changer

Join 2,500+ subscribers inside the useThinkScript VIP Membership Club
  • Exclusive indicators
  • Proven strategies & setups
  • Private Discord community
  • ‘Buy The Dip’ signal alerts
  • Exclusive members-only content
  • Add-ons and resources
  • 1 full year of unlimited support

Frequently Asked Questions

What is useThinkScript?

useThinkScript is the #1 community of stock market investors using indicators and other tools to power their trading strategies. Traders of all skill levels use our forums to learn about scripting and indicators, help each other, and discover new ways to gain an edge in the markets.

How do I get started?

We get it. Our forum can be intimidating, if not overwhelming. With thousands of topics, tens of thousands of posts, our community has created an incredibly deep knowledge base for stock traders. No one can ever exhaust every resource provided on our site.

If you are new, or just looking for guidance, here are some helpful links to get you started.

What are the benefits of VIP Membership?
VIP members get exclusive access to these proven and tested premium indicators: Buy the Dip, Advanced Market Moves 2.0, Take Profit, and Volatility Trading Range. In addition, VIP members get access to over 50 VIP-only custom indicators, add-ons, and strategies, private VIP-only forums, private Discord channel to discuss trades and strategies in real-time, customer support, trade alerts, and much more. Learn all about VIP membership here.
How can I access the premium indicators?
To access the premium indicators, which are plug and play ready, sign up for VIP membership here.
Back
Top