Holy Grail ADX Trading Setup for ThinkorSwim

BenTen

Administrative
Staff member
Staff
VIP
Lifetime
Spoiler: It's not the "holy grail". In trading, there is no such thing. This strategy was written by Linda Bradford Raschke and Larry Connors. We kept the name because it sounds cool.
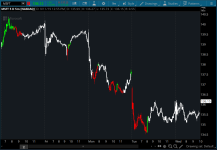
Bullish Direction
  • 14-period ADX is above 30 and rising
  • Retracement down to 20-period SMA
  • Your entry would be at the high of the bar that touches 20-period simple moving average
Bearish Direction
  • 14-period ADX is above 30 and rising
  • Retracement up to 20-period SMA
  • Your short entry would be at the low of the bar that touches 20-period simple moving average
vHuYoOB.png

6p80HJr.png


thinkScript Code

Code:
# The Holy Grail ADX Trading Setup
# Assembled by BenTen at useThinkScript.com
# This is NOT the Holy Grail! It was named that way by Linda Bradford Raschke and Larry Connors for its simplicity.

# You are free to use this code for personal use, and make derivative works from it.
# You are NOT GRANTED permission to use this code (or derivative works) for commercial
# purposes which includes and is not limited to selling, reselling, or packaging with
# other commercial indicators. Headers and attribution in this code should remain as provided,
# and any derivative works should extend the existing headers.

# Start SMA
input price = close;
input length = 20;
input displace = 0;

def SMA = Average(price[-displace], length);
def SMAbull = price > SMA;
def SMAbear = price < SMA;

# Start ADX
input ADXlength = 14;
input ADXaverageType = AverageType.WILDERS;
def ADX = DMI(ADXlength, ADXaverageType).ADX;

def ADXpower = ADX > 30;

def bullish = SMAbull and ADXpower;
def bearish = SMAbear and ADXpower;

AssignPriceColor(if bullish then Color.GREEN else if bearish then Color.RED else Color.WHITE);

I learned about this strategy from here, you should read up on it before using the indicator.
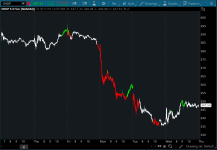
 

Attachments

  • vHuYoOB.png
    vHuYoOB.png
    80.6 KB · Views: 242
  • 6p80HJr.png
    6p80HJr.png
    82.4 KB · Views: 254
This is really great - but would be even better if the indicator etc was also provided with the day trading options 2-period ADX dips below 25 along with the lower chart info with buy / sell arrow.... is that possible ?
 
Last edited by a moderator:
@OldBallz Are you talking about the same concept but with adjustment to ADX? Or do you want a standalone indicator that signal short for when 2-period ADX crossing below 25? If the first scenario then you just have to change the length of ADX from 14 to 2. Give it a try and see if that's what you're looking for.
 
https://researchtrade.com/forum/read.php?7,2258
This ADX/DMI looks interesting, Ben did you look into this

Code:
# DI, ADX, and Trend Indicator (updated 12/18/13)

declare lower;


input DI_length = 5;

input ADX_length = 13;

input Strong_Trend = 25;


def DX = if (diplus(di_length) + diminus(di_length) > 0) then 100 * AbsValue(diplus(di_length) - diminus(di_length)) / (diplus(di_length) + diminus(di_length)) else 0;

plot ADX = WildersAverage(DX, adx_length);ADX.DefineColor("Stronger", Color.CYAN);

ADX.DefineColor("Weaker", Color.PINK);

ADX.AssignValueColor(if ADX > ADX[1] then ADX.Color("Stronger" ) else ADX.Color("Weaker" ));

ADX.SetPaintingStrategy(PaintingStrategy.LINE);

ADX.SetStyle(Curve.SHORT_DASH);


AddCloud(ADX, 0, ADX.Color("stronger" ));

def weaker = if ADX < ADX[1] then ADX else Double.NaN;

AddCloud(weaker, 0, ADX.Color("weaker" ));


plot "DI+" = DIPlus(DI_length);

"DI+".SetDefaultColor(Color.RED);

"DI+".SetLineWeight(2);


plot "DI-" = DIMinus(DI_length);

"DI-".SetDefaultColor(Color.GREEN);

"DI-".SetLineWeight(2);


plot StrongTrend = Strong_Trend;

StrongTrend.SetDefaultColor(Color.LIGHT_GRAY);
 
Last edited by a moderator:
@Trading51 I saw this before, it’s a pretty known strategy on many platforms. I personally don’t like it because of ADX. Last time I checked it lags more than other indicators.
 
Well if you want "ultimate ADX/DMI" vwp, pullback entry indicator: I wrote one . Spend friggin 2 month polishing it to perfection . It is quite silly though even though its very accurate on trending stocks (over 95% accurate). ITs not hard to find pullback entry on trending stock. the trick is to find stock which will be trending (and not reverse/chop shortly)
here it is https://tos.mx/7X1yazr : guranteed to give perfect entry signals on trending stocks!
 
Thanks for sharing, could you provide some details on how you would use this, when you get time thanks
 
I use ADX/DMI to confirm the trend I am trading. Would never use this or any indicator by itself. The image below shows a good example, you may notice I changed the colors. Once in a trade I do not use ADX/DMI to close the trade instead BOP, Wave C (an 8/377 MACD with a smoother basically) and price action are used.

dm8RWlO.png
 
Could you add a preference to add or remove the arrows, theres a lot when they are on here, thanks
 
Does this work as scan to find trending Up or down stocks?

Can someone Please share code/link to get it into TOS
THX
Surrsh K
 
Add the following code to your script:

Code:
# Plot Signals

plot bullish_sign = bullish;

bullish_sign.SetPaintingStrategy(PaintingStrategy.BOOLEAN_ARROW_UP);

bullish_sign.SetDefaultColor(Color.CYAN);

bullish_sign.SetLineWeight(1);

plot bearish_sign = bearish;

bearish_sign.SetPaintingStrategy(PaintingStrategy.BOOLEAN_ARROW_DOWN);

bearish_sign.SetDefaultColor(Color.CYAN);

bearish_sign.SetLineWeight(1);

Then watch this video on how to use the scanner: https://usethinkscript.com/threads/how-to-use-the-tos-scanner.284/
 
Well if you want "ultimate ADX/DMI" vwp, pullback entry indicator: I wrote one . Spend friggin 2 month polishing it to perfection . It is quite silly though even though its very accurate on trending stocks (over 95% accurate). ITs not hard to find pullback entry on trending stock. the trick is to find stock which will be trending (and not reverse/chop shortly)
here it is https://tos.mx/7X1yazr : guranteed to give perfect entry signals on trending stocks!

How do you even begin to use this thing LOL...
 
This chart looks awesome, would you mind sharing? I’ve been looking at your posts and you seem to have a lot of really really good stuff.
 
@skynetgen this looks great. Do you use this on all timeframes or any specific timeframes? Do you have scan for this? Scan to check when Red turns to green or green turns to Red?

Thanks.
 

Join useThinkScript to post your question to a community of 21,000+ developers and traders.

Similar threads

Not the exact question you're looking for?

Start a new thread and receive assistance from our community.

87k+ Posts
415 Online
Create Post

Similar threads

Similar threads

The Market Trading Game Changer

Join 2,500+ subscribers inside the useThinkScript VIP Membership Club
  • Exclusive indicators
  • Proven strategies & setups
  • Private Discord community
  • ‘Buy The Dip’ signal alerts
  • Exclusive members-only content
  • Add-ons and resources
  • 1 full year of unlimited support

Frequently Asked Questions

What is useThinkScript?

useThinkScript is the #1 community of stock market investors using indicators and other tools to power their trading strategies. Traders of all skill levels use our forums to learn about scripting and indicators, help each other, and discover new ways to gain an edge in the markets.

How do I get started?

We get it. Our forum can be intimidating, if not overwhelming. With thousands of topics, tens of thousands of posts, our community has created an incredibly deep knowledge base for stock traders. No one can ever exhaust every resource provided on our site.

If you are new, or just looking for guidance, here are some helpful links to get you started.

What are the benefits of VIP Membership?
VIP members get exclusive access to these proven and tested premium indicators: Buy the Dip, Advanced Market Moves 2.0, Take Profit, and Volatility Trading Range. In addition, VIP members get access to over 50 VIP-only custom indicators, add-ons, and strategies, private VIP-only forums, private Discord channel to discuss trades and strategies in real-time, customer support, trade alerts, and much more. Learn all about VIP membership here.
How can I access the premium indicators?
To access the premium indicators, which are plug and play ready, sign up for VIP membership here.
Back
Top