Daily Range System (DRS)
The Daily Range System (DRS) is an indicator @BenTen found on TradingView, and I ported it to thinkorswim.
See these pages for more info on how to use this indicator.
https://www.tradingview.com/script/VpEHwgys-DRS-Daily-Range-System/ and https://www.forexfactory.com/showthread.php?t=743125
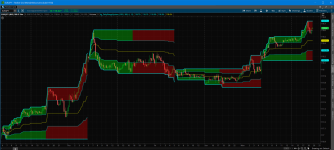
Here is what it looks like on thinkorswim

Code for DRS
Link to the study
https://tos.mx/UdEXUb
Happy Trading,
Kory Gill, @korygill
The Daily Range System (DRS) is an indicator @BenTen found on TradingView, and I ported it to thinkorswim.
See these pages for more info on how to use this indicator.
https://www.tradingview.com/script/VpEHwgys-DRS-Daily-Range-System/ and https://www.forexfactory.com/showthread.php?t=743125
Here is what it looks like on thinkorswim
Code for DRS
Code:
#
# DailyRangeSystem_DRS
#
# Author: Kory Gill, @korygill
#
# Created from idea on https://www.tradingview.com/script/VpEHwgys-DRS-Daily-Range-System/
# Original idea is from https://www.forexfactory.com/showthread.php?t=743125
#
# VERSION HISTORY (sortable date and time (your local time is fine), and your initials
# 20190909-1200-KG    - Created.
# ...
# ...

input timeFromEST = -300; #hint timeFromEST: 24hr time from EST timezone
input starthr = 6; #hint start: 24hr format hour start time for DRS
input duration = 12; #hint duration: hours for 1st DRS cycle

def exhr = if starthr+duration > 24 then starthr+duration-24 else starthr+duration;
def start = starthr*100 - timeFromEST;

def nan = Double.NaN;
def bn = BarNumber();

def hi = if bn < 2 then high
         else if SecondsFromTime(start) == 0
         then high else if high > hi[1]
         then high
         else hi[1];

def lo = if bn < 2 then low
         else if SecondsFromTime(start) == 0
         then low else if low < lo[1]
         then low
         else lo[1];

def mi = (hi + lo) * 0.50;
def m75 = 0.75 * hi + 0.25 * lo;
def m25 = 0.25 * hi + 0.75 * lo;

def sft = SecondsFromTime(start);

plot p1 = if sft[-1] == 0 then nan else hi;
plot p2 = if sft[-1] == 0 then nan else lo;
plot p3 = if sft[-1] == 0 then nan else m75;
plot p4 = if sft[-1] == 0 then nan else m25;
plot p5 = if sft[-1] == 0 then nan else mi;

p1.SetDefaultColor(Color.Cyan);
p2.SetDefaultColor(Color.Cyan);
p3.SetDefaultColor(Color.Cyan);
p4.SetDefaultColor(Color.Cyan);
p5.SetDefaultColor(Color.Yellow);

p1.SetLineWeight(2);
p2.SetLineWeight(2);

def elapsed = SecondsFromTime(start);
def durationSeconds = duration*60*60;

AddCloud(
    if elapsed <= durationSeconds and elapsed >= 0 then p1 else nan,
    if elapsed <= durationSeconds and elapsed >= 0 then p3 else nan,
    Color.GREEN, Color.GREEN);

AddCloud(
    if elapsed >= durationSeconds or elapsed <= 0 then p1 else nan,
    if elapsed >= durationSeconds or elapsed <= 0 then p3 else nan,
    Color.RED, Color.RED);

AddCloud(
    if elapsed <= durationSeconds and elapsed >= 0 then p2 else nan,
    if elapsed <= durationSeconds and elapsed >= 0 then p4 else nan,
    Color.GREEN, Color.GREEN);

AddCloud(
    if elapsed >= durationSeconds or elapsed <= 0 then p2 else nan,
    if elapsed >= durationSeconds or elapsed <= 0 then p4 else nan,
    Color.RED, Color.RED);
Link to the study
https://tos.mx/UdEXUb
Happy Trading,
Kory Gill, @korygill
Attachments
Last edited:

