
Daily Range System (DRS)
mod note:
This DRS indicator is a stable, pre‑defined daily range map that tells where the market is likely to react.
It the day’s high, low, and key reaction levels. So you know where to avoid chasing, where to expect reversals, and where breakouts are more likely to stick.
See these pages for more info on how to use this indicator.
https://www.tradingview.com/script/VpEHwgys-DRS-Daily-Range-System/ and https://www.forexfactory.com/showthread.php?t=743125
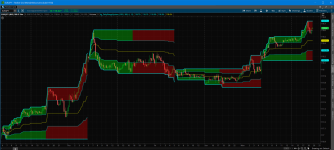
Here is what it looks like on thinkorswim

Code for DRS
Link to the study
https://tos.mx/UdEXUb
Happy Trading,
Kory Gill, @korygill
mod note:
This DRS indicator is a stable, pre‑defined daily range map that tells where the market is likely to react.
It the day’s high, low, and key reaction levels. So you know where to avoid chasing, where to expect reversals, and where breakouts are more likely to stick.
| Price near the DRS High top cyan line | → Do NOT chase. → Sell if it fails to break above. → Only buy if it breaks above AND finds support. |
| Price near the DRS Low bottom cyan line | → Do NOT chase short. → Buy if it finds support. → Only sell if it breaks below AND stays below. |
| Price at the Midline yellow 50% level | → Do not buy or sell → This is a target / magnet for exits, not entry → Avoid opening new trades on the midline. |
| Price at the Quarter Lines cyan (m25 / m75) | → Treat it as a pullback zone. → Look for continuation back toward the high/low. → If price rejects hard, expect a rotation toward the opposite side. |
| Green Cloud active range‑building | → Expect chop and range formation. → BUY low of the range → SELL high of the range |
| Red Cloud post‑range expansion | → Expect trend, breakouts, and range expansion. → Breakouts above/below the DRS high/low are more reliable. → Pullbacks to the quarter lines are cleaner. |
See these pages for more info on how to use this indicator.
https://www.tradingview.com/script/VpEHwgys-DRS-Daily-Range-System/ and https://www.forexfactory.com/showthread.php?t=743125
Here is what it looks like on thinkorswim
Code for DRS
Code:
#
# DailyRangeSystem_DRS
#
# Author: Kory Gill, @korygill
#
# Created from idea on https://www.tradingview.com/script/VpEHwgys-DRS-Daily-Range-System/
# Original idea is from https://www.forexfactory.com/showthread.php?t=743125
#
# VERSION HISTORY (sortable date and time (your local time is fine), and your initials
# 20190909-1200-KG    - Created.
# ...
# ...

input timeFromEST = -300; #hint timeFromEST: 24hr time from EST timezone
input starthr = 6; #hint start: 24hr format hour start time for DRS
input duration = 12; #hint duration: hours for 1st DRS cycle

def exhr = if starthr+duration > 24 then starthr+duration-24 else starthr+duration;
def start = starthr*100 - timeFromEST;

def nan = Double.NaN;
def bn = BarNumber();

def hi = if bn < 2 then high
         else if SecondsFromTime(start) == 0
         then high else if high > hi[1]
         then high
         else hi[1];

def lo = if bn < 2 then low
         else if SecondsFromTime(start) == 0
         then low else if low < lo[1]
         then low
         else lo[1];

def mi = (hi + lo) * 0.50;
def m75 = 0.75 * hi + 0.25 * lo;
def m25 = 0.25 * hi + 0.75 * lo;

def sft = SecondsFromTime(start);

plot p1 = if sft[-1] == 0 then nan else hi;
plot p2 = if sft[-1] == 0 then nan else lo;
plot p3 = if sft[-1] == 0 then nan else m75;
plot p4 = if sft[-1] == 0 then nan else m25;
plot p5 = if sft[-1] == 0 then nan else mi;

p1.SetDefaultColor(Color.Cyan);
p2.SetDefaultColor(Color.Cyan);
p3.SetDefaultColor(Color.Cyan);
p4.SetDefaultColor(Color.Cyan);
p5.SetDefaultColor(Color.Yellow);

p1.SetLineWeight(2);
p2.SetLineWeight(2);

def elapsed = SecondsFromTime(start);
def durationSeconds = duration*60*60;

AddCloud(
    if elapsed <= durationSeconds and elapsed >= 0 then p1 else nan,
    if elapsed <= durationSeconds and elapsed >= 0 then p3 else nan,
    Color.GREEN, Color.GREEN);

AddCloud(
    if elapsed >= durationSeconds or elapsed <= 0 then p1 else nan,
    if elapsed >= durationSeconds or elapsed <= 0 then p3 else nan,
    Color.RED, Color.RED);

AddCloud(
    if elapsed <= durationSeconds and elapsed >= 0 then p2 else nan,
    if elapsed <= durationSeconds and elapsed >= 0 then p4 else nan,
    Color.GREEN, Color.GREEN);

AddCloud(
    if elapsed >= durationSeconds or elapsed <= 0 then p2 else nan,
    if elapsed >= durationSeconds or elapsed <= 0 then p4 else nan,
    Color.RED, Color.RED);
Link to the study
https://tos.mx/UdEXUb
Happy Trading,
Kory Gill, @korygill
Attachments
Last edited by a moderator: