
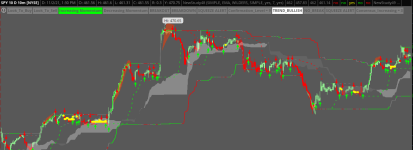
I added the Confirmation Candles V.10 without a problem. When I add the script for Consensus Confirmation Candles C3 v6, I get this light/dark grey clouds. Any insight would be great, not sure if I did something wrong or put the wrong code in:
12452[/ATTACH]']

12452[/ATTACH]']


")