
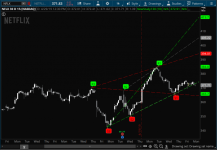
Bulkowski's 1-2-3 pattern helps to detect trend change. The concept has been added into an existing indicator by Mobius called Wolf Waves. This indicator will automatically draw trend lines which include support and resistance marks on your chart.

Just select a timeframe of choice and the trendlines will automatically re-adjust itself.
Note from the coder (Nube):
Just select a timeframe of choice and the trendlines will automatically re-adjust itself.
Note from the coder (Nube):
Here is the next step on that script. This one labels the points one the 1-2-3 pattern. Still only for the bullish side and this version doesn't seem to cooperate with the scanner so still work to do. Let me know if you see any flakiness etc with it
thinkScript Code
Rich (BB code):
# Wolf Waves
# Mobius
# V01.05.22.2018
# Nube added Bulkowski's 1-2-3 Trend Change
# To scan for reversal, look for reversal plots equal to 1
# 7.18.18
# v 0.2 shows bubbles labeling each point
# 7.27.18

# User Inputs
input n = 10;

# Internal Script Reference
script LinePlot {
    input BarID = 0;
    input Value = 0;
    input BarOrigin = 0;
    def ThisBar = HighestAll(BarOrigin);
    def ValueLine = if BarOrigin == ThisBar
                then Value
                else Double.NaN;
    plot P = if ThisBar - BarID <= BarOrigin
             then HighestAll(ValueLine)
             else Double.NaN;
}
# Variables
def h = high;
def l = low;
def c = close;
def na = Double.NaN;
def bn = BarNumber();

# R1
def hh = fold i = 1 to n + 1
         with p = 1
         while p
         do h > GetValue(h, -i);
def PivotH = if (bn > n and
                 h == Highest(h, n) and
                 hh)
             then h
             else na;
def PHValue = if !IsNaN(PivotH)
              then PivotH
              else PHValue[1];
def PHBarOrigin = if !IsNaN(PivotH)
                  then bn
                  else PHBarOrigin[1];
def PHBarID = bn - PHBarOrigin;
# R2
def R2PHValue = if PHBarOrigin != PHBarOrigin[1]
                then PHValue[1]
                else R2PHValue[1];
def R2PHBarOrigin = if PHBarOrigin != PHBarOrigin[1]
                    then PHBarOrigin[1]
                    else R2PHBarOrigin[1];
def R2PHBarID = bn - R2PHBarOrigin;
# R3
def R3PHValue = if R2PHBarOrigin != R2PHBarOrigin[1]
                then R2PHValue[1]
                else R3PHValue[1];
def R3PHBarOrigin = if R2PHBarOrigin != R2PHBarOrigin[1]
                    then R2PHBarOrigin[1]
                    else R3PHBarOrigin[1];
def R3PHBarID = bn - R3PHBarOrigin;

# S1
def ll = fold j = 1 to n + 1
         with q = 1
         while q
         do l < GetValue(l, -j);
def PivotL = if (bn > n and
                 l == Lowest(l, n) and
                 ll)
             then l
             else na;
def PLValue = if !IsNaN(PivotL)
              then PivotL
              else PLValue[1];
def PLBarOrigin = if !IsNaN(PivotL)
                  then bn
                  else PLBarOrigin[1];
def PLBarID = bn - PLBarOrigin;
# S2
def S2PLValue = if PLBarOrigin != PLBarOrigin[1]
                then PLValue[1]
                else S2PLValue[1];
def S2PLBarOrigin = if PLBarOrigin != PLBarOrigin[1]
                    then PLBarOrigin[1]
                    else S2PLBarOrigin[1];
def S2PLBarID = bn - S2PLBarOrigin;
# S3
def S3PLValue = if S2PLBarOrigin != S2PLBarOrigin[1]
                then S2PLValue[1]
                else S3PLValue[1];
def S3PLBarOrigin = if S2PLBarOrigin != S2PLBarOrigin[1]
                    then S2PLBarOrigin[1]
                    else S3PLBarOrigin[1];
def S3PLBarID = bn - S3PLBarOrigin;
# S4
def S4PLValue = if S3PLBarOrigin != S3PLBarOrigin[1]
                then S3PLValue[1]
                else S4PLValue[1];
def S4PLBarOrigin = if S3PLBarOrigin != S3PLBarOrigin[1]
                    then S3PLBarOrigin[1]
                    else S4PLBarOrigin[1];
def S4PLBarID = bn - S4PLBarOrigin;
# S5
def S5PLValue = if S4PLBarOrigin != S4PLBarOrigin[1]
                then S4PLValue[1]
                else S5PLValue[1];
def S5PLBarOrigin = if S4PLBarOrigin != S4PLBarOrigin[1]
                    then S4PLBarOrigin[1]
                    else S5PLBarOrigin[1];
def S5PLBarID = bn - S5PLBarOrigin;

# Plots
def R1 = LinePlot(BarID = PHBarID,
                   Value = PHValue,
                   BarOrigin = PHBarOrigin);
#R1.SetDefaultColor(Color.GREEN);
AddChartBubble(bn == HighestAll(PHBarOrigin), PHValue, "R1", Color.GREEN, 1);
def R2 = LinePlot(BarID = R2PHBarID,
                   Value = R2PHValue,
                   BarOrigin = R2PHBarOrigin);
#R2.SetDefaultColor(Color.GREEN);
AddChartBubble(bn == HighestAll(R2PHBarOrigin), PHValue, "R2", Color.GREEN, 1);
def R3 = LinePlot(BarID = R3PHBarID,
                   Value = R3PHValue,
                   BarOrigin = R3PHBarOrigin);
#R3.SetDefaultColor(Color.GREEN);
AddChartBubble(bn == HighestAll(R3PHBarOrigin), PHValue, "R3", Color.GREEN, 1);

def S1 = LinePlot(BarID = PLBarID,
                   Value = PLValue,
                   BarOrigin = PLBarOrigin);
#S1.SetDefaultColor(Color.RED);
AddChartBubble(bn == HighestAll(PLBarOrigin), PLValue, "S1", Color.RED, 0);
def S2 = LinePlot(BarID = S2PLBarID,
                   Value = S2PLValue,
                   BarOrigin = S2PLBarOrigin);
#S2.SetDefaultColor(Color.RED);
AddChartBubble(bn == HighestAll(S2PLBarOrigin), PLValue, "S2", Color.RED, 0);
def S3 = LinePlot(BarID = S3PLBarID,
                   Value = S3PLValue,
                   BarOrigin = S3PLBarOrigin);
#S3.SetDefaultColor(Color.RED);
AddChartBubble(bn == HighestAll(S3PLBarOrigin), PLValue, "S3", Color.RED, 0);

# Trend Line

plot TrendLineS3S1 = if   bn == HighestAll(S3PLBarOrigin)
                    then S3
                    else if bn == HighestAll(PLBarOrigin)
                         then S1  #Parentlow
                         else na;
TrendLineS3S1.EnableApproximation();
TrendLineS3S1.SetDefaultColor(Color.Green);
TrendLineS3S1.SetLineWeight(1);
TrendLineS3S1.SetStyle(Curve.LONG_DASH);
def slope2a = (s1 - s3) /
             (HighestAll(PLBarOrigin) - S3PLBarOrigin);
plot ExtLineS3S1 = if bn >= S3PLBarOrigin
                then (bn - HighestAll(S3PLBarOrigin)) * slope2a + S3
                else na;
ExtLineS3S1.EnableApproximation();
ExtLineS3S1.SetDefaultColor(Color.Green);
ExtLineS3S1.SetLineWeight(1);
ExtLineS3S1.SetStyle(Curve.LONG_DASH);

#
plot TrendLineS3R1 = if  bn == HighestAll(S3PLBarOrigin)
                     then S3
                     else if bn == HighestAll(PHBarOrigin)
                         then R1  #ParentHigh
                         else na;
TrendLineS3R1.EnableApproximation();
TrendLineS3R1.SetDefaultColor(Color.Green);
TrendLineS3R1.SetLineWeight(1);
TrendLineS3R1.SetStyle(Curve.LONG_DASH);
def slope2b = (S3 - R1) /
             (HighestAll(S3PLBarOrigin) - HighestAll(PHBarOrigin));
plot ExtLineS3R1 = if bn >= HighestAll(PHBarOrigin)
                 then (bn - HighestAll(PHBarOrigin)) * slope2b + R1
                 else na;
ExtLineS3R1.EnableApproximation();
ExtLineS3R1.SetDefaultColor(Color.Green);
ExtLineS3R1.SetLineWeight(1);
ExtLineS3R1.SetStyle(Curve.LONG_DASH);

plot TrendLineR3R1 = if bn == HighestAll(R3PHBarOrigin)
                    then R3
                    else if bn == PHBarOrigin
                         then R1
                         else na;
TrendLineR3R1.EnableApproximation();
TrendLineR3R1.SetDefaultColor(Color.Red);
TrendLineR3R1.SetLineWeight(1);
TrendLineR3R1.SetStyle(Curve.LONG_DASH);
def slope3a = (R3 - R1) /
             (HighestAll(R3PHBarOrigin) - HighestAll(PHBarOrigin));
plot ExtLineR3R1 = if bn >= HighestAll(R3PHBarOrigin)
                then (bn - HighestAll(R3PHBarOrigin)) * slope3a + R3
                else na;
ExtLineR3R1.EnableApproximation();
ExtLineR3R1.SetDefaultColor(Color.Red);
ExtLineR3R1.SetLineWeight(1);
ExtLineR3R1.SetStyle(Curve.LONG_DASH);

plot TrendLineR3S1 = if bn == HighestAll(R3PHBarOrigin)
                    then R3
                    else if bn == PLBarOrigin
                         then S1
                         else na;
TrendLineR3S1.EnableApproximation();
TrendLineR3S1.SetDefaultColor(Color.Red);
TrendLineR3S1.SetLineWeight(1);
TrendLineR3S1.SetStyle(Curve.LONG_DASH);
def slope3b = (R3 - S1) /
              (HighestAll(R3PHBarOrigin) - HighestAll(PLBarOrigin));

plot ExtLineR3S1 = if bn >= HighestAll(PLBarOrigin)
                then (bn - HighestAll(PLBarOrigin)) * slope3b + S1
                else na;
ExtLineR3S1.EnableApproximation();
ExtLineR3S1.SetDefaultColor(Color.Red);
ExtLineR3S1.SetLineWeight(1);
ExtLineR3S1.SetStyle(Curve.LONG_DASH);

plot ResistanceLineR2R1 = if bn == HighestAll(R2PHBarOrigin)
                    then R2
                    else if bn == HighestAll(PHBarOrigin)
                         then R1
                         else na;
ResistanceLineR2R1.EnableApproximation();
ResistanceLineR2R1.SetDefaultColor(Color.Gray);
ResistanceLineR2R1.SetLineWeight(1);
ResistanceLineR2R1.SetStyle(Curve.LONG_DASH);
def slopeR2R1 = (R2 - R1) /
             (HighestAll(R2PHBarOrigin) - HighestAll(PHBarOrigin));
plot ExtLineR2R1 = if bn >= HighestAll(PHBarOrigin)
                then (bn - HighestAll(PHBarOrigin)) * slopeR2R1 + R1
                else na;
ExtLineR2R1.EnableApproximation();
ExtLineR2R1.SetDefaultColor(Color.Gray);
ExtLineR2R1.SetLineWeight(1);
ExtLineR2R1.SetStyle(Curve.LONG_DASH);
plot SupportLineS2S1 = if bn == HighestAll(S2PLBarOrigin)
                    then S2
                    else if bn == HighestAll(PLBarOrigin)
                         then S1  #Parentlow
                         else na;
SupportLineS2S1.EnableApproximation();
SupportLineS2S1.SetDefaultColor(Color.Gray);
SupportLineS2S1.SetLineWeight(1);
SupportLineS2S1.SetStyle(Curve.LONG_DASH);
def slopeS2S1 = (S2 - S1) /
               (HighestAll(S2PLBarOrigin) - PLBarOrigin);
plot ExtLineS2S1 = if bn >= S2PLBarOrigin
                then (bn - HighestAll(S2PLBarOrigin)) * slopeS2S1 + S2
                else na;
ExtLineS2S1.EnableApproximation();
ExtLineS2S1.SetDefaultColor(Color.Gray);
ExtLineS2S1.SetLineWeight(1);
ExtLineS2S1.SetStyle(Curve.LONG_DASH);

def currentBar = if   !IsNaN(c) and IsNaN(c[-1])
                 then bn
                 else currentBar[1];
def hCB = HighestAll(currentBar);

def sLineR3R2 = if bn == HighestAll(R3PHBarOrigin)
                then R3
                else if bn == HighestAll(R2PHBarOrigin)
                     then R2
                     else na;
def slopeR3R2 = (R3 - R2) /
                (HighestAll(R3PHBarOrigin) - HighestAll(R2PHBarOrigin));
def eLineR3R2 = if bn >= HighestAll(R2PHBarOrigin)
                then (bn - HighestAll(R2PHBarOrigin)) * slopeR3R2 + R2
                else na;
Getting bar number at which the R3R2 extension line crosses S2. This ensures S2 occures before the line - value is nan if pivot is set after the R3R2 extension line
def R3R2crossS2Bar = if   bn >= HighestAll(S2PLBarOrigin)
                     &&   eLineR3R2 crosses below S2
                     then bn
                     else R3R2crossS2Bar[1];

def bull123 = S1 > S2 &&
              !IsNaN(R3R2crossS2Bar) &&
              HighestAll(PHBarOrigin) > R3R2crossS2Bar &&
              c  > R1;# R1 after the break of the down trend line from R3 through R2 # not signaling until pattern completes

def bull123V = GetValue(bull123,(bn-hCB));# brings the current trend change or not condition to each bar to turn the line plots on/off

plot
ResitanceLineR3R2;
ResitanceLineR3R2.  EnableApproximation();
ResitanceLineR3R2.  SetDefaultColor(Color.Yellow);
ResitanceLineR3R2.  SetLineWeight(1);
ResitanceLineR3R2.  SetStyle(Curve.LONG_DASH);
ResitanceLineR3R2 = if   bull123V
                    then sLineR3R2
                    else na;

plot
ExtLineR3R2;
ExtLineR3R2.  EnableApproximation();
ExtLineR3R2.  SetDefaultColor(Color.Yellow);
ExtLineR3R2.  SetLineWeight(1);
ExtLineR3R2.  SetStyle(Curve.LONG_DASH);
ExtLineR3R2 = if   bull123V
              then eLineR3R2
              else na;
the bar that breaks the trend line
def breakBar =
    if   bn > HighestAll(S2PLBarOrigin)
    &&   c crosses above eLineR3R2
    then bn else na;
def breakCount =
    if   !IsNaN(breakBar)
    then breakCount[1] + 1
    else breakCount[1];

plot
bb = bull123V && breakCount crosses above .5;
bb.SetpaintingStrategy(PaintingStrategy.BOOLEAN_ARROW_UP);
bb.SetDefaultColor(Color.Cyan);
bb.SetLineWeight(2);
the bar that completes the pattern by crossing above R1
def completeBar =
    if   bn > HighestAll(PLBarOrigin)
    &&   c crosses above R1
    then bn else na;
def completeCount =
    if   !IsNaN(completeBar)
    then completeCount[1] + 1
    else completeCount[1];

plot
cb = bull123V && completeCount crosses above .5;
cb.SetpaintingStrategy(PaintingStrategy.BOOLEAN_ARROW_UP);
cb.SetDefaultColor(Color.Cyan);
cb.SetLineWeight(2);
this section strictly for placing bubble on the bar that completes the bullish 1-2-3 as defined in this script
AddChartBubble(bull123V && bn == HighestAll(R3PHBarOrigin),R3,"C",Color.Cyan);
AddChartBubble(bull123V && bn == HighestAll(S2PLBarOrigin),S2,"A",Color.Cyan,0);
AddChartBubble(bull123V && bn == HighestAll(PHBarOrigin),R1,"B",Color.Cyan);
AddChartBubble(bull123V && bn == HighestAll(PLBarOrigin),S1,"2",Color.Yellow,0);
AddChartBubble(bull123V && bb,h,"1",Color.Yellow);
AddChartBubble(cb,h,"3",Color.Yellow);

def sLineS3S2 = if bn == HighestAll(S3PLBarOrigin)
                    then S3
                    else if bn == HighestAll(S2PLBarOrigin)
                         then S2
                         else na;
def slopeS3S2 = (S3 - S2) /
               (HighestAll(S3PLBarOrigin) - HighestAll(S2PLBarOrigin));
def eLineS3S2 = if bn >= HighestAll(S2PLBarOrigin)
                then (bn - HighestAll(S2PLBarOrigin)) * slopeS3S2 + S2
                else na;

def S3S2crossR2Bar = if   bn <= HighestAll(PHBarOrigin)
                     &&   eLineS3S2 crosses above R2
                     then bn
                     else S3S2crossR2Bar[1];

def bear123 = R2 > R1 &&
              !IsNaN(S3S2crossR2Bar) &&
              c < S1;

def bear123V = GetValue(bear123,(bn-hCB));# brings the current trend change or not condition to each bar to turn the line plots on/off

plot
SupportLineS3S2;
SupportLineS3S2.  EnableApproximation();
SupportLineS3S2.  SetDefaultColor(Color.Yellow);
SupportLineS3S2.  SetLineWeight(1);
SupportLineS3S2.  SetStyle(Curve.LONG_DASH);
SupportLineS3S2 = if   bear123V
                  then sLineS3S2
                  else na;

plot
ExtLineS3S2;
ExtLineS3S2.  EnableApproximation();
ExtLineS3S2.  SetDefaultColor(Color.Yellow);
ExtLineS3S2.  SetLineWeight(1);
ExtLineS3S2.  SetStyle(Curve.LONG_DASH);
ExtLineS3S2 = if   bear123V
              then eLineS3S2
              else na;

plot
"Bullish 1-2-3 Reversal" = bull123;
"Bullish 1-2-3 Reversal".Hide();
plot
"Bearish 1-2-3 Reversal" = bear123;
"Bearish 1-2-3 Reversal".Hide();

AddLabel(bull123, " 1 - 2 - 3  Trend Change ", CreateColor(75,225,75));
AddLabel(bear123, " 1 - 2 - 3 Trend Change ", CreateColor(225,75,75));
Another version posted by Nube:
Code:
# Nube 7.18.18
plot SupportLineS3S2 = if x == HighestAll(S3PLBarOrigin)
                    then S3
                    else if x == HighestAll(S2PLBarOrigin)
                         then S2  #Parentlow
                         else Double.NaN;
SupportLineS3S2.EnableApproximation();
SupportLineS3S2.SetDefaultColor(Color.White);
SupportLineS3S2.SetLineWeight(1);
SupportLineS3S2.SetStyle(Curve.LONG_DASH);
def slopeS3S2 = (S3 - S2) /
               (HighestAll(S3PLBarOrigin) - HighestAll(S2PLBarOrigin));
plot ExtLineS3S2 = if x >= HighestAll(S2PLBarOrigin)
                then (x - HighestAll(S2PLBarOrigin)) * slopeS3S2 + S2
                else Double.NaN;
ExtLineS3S2.EnableApproximation();
ExtLineS3S2.SetDefaultColor(Color.White);
ExtLineS3S2.SetLineWeight(1);
ExtLineS3S2.SetStyle(Curve.LONG_DASH);
plot SupportLineR3R2 = if x == HighestAll(R3PHBarOrigin)
                    then R3
                    else if x == HighestAll(R2PHBarOrigin)
                         then R2  #Parentlow
                         else Double.NaN;
SupportLineR3R2.EnableApproximation();
SupportLineR3R2.SetDefaultColor(Color.White);
SupportLineR3R2.SetLineWeight(1);
SupportLineR3R2.SetStyle(Curve.LONG_DASH);
def slopeR3R2 = (R3 - R2) /
               (HighestAll(R3PHBarOrigin) - HighestAll(R2PHBarOrigin));
plot ExtLineR3R2 = if x >= HighestAll(R2PHBarOrigin)
                then (x - HighestAll(R2PHBarOrigin)) * slopeR3R2 + R2
                else Double.NaN;

ExtLineR3R2.EnableApproximation();
ExtLineR3R2.SetDefaultColor(Color.White);
ExtLineR3R2.SetLineWeight(1);
ExtLineR3R2.SetStyle(Curve.LONG_DASH);

plot bull123 = R3 > R2 &&
               S1 > ExtLineR3R2 &&
               close > S1;
plot bear123 = S3 < S2 &&
               R1 < ExtLineS3S2 &&
               close < R1;
bull123.Hide();
bear123.Hide();
AddLabel(bull123, " 1 - 2 - 3  Trend Change ", CreateColor(75,225,75));
AddLabel(bear123, " 1 - 2 - 3 Trend Change ", CreateColor(225,75,75));
Shareable Link
https://tos.mx/o1WyafAttachments
Last edited: