Repaints Bulkowski Double Bottom Indicator for ThinkorSwim

Repaints

BenTen

Administrative
Staff member
Staff
VIP
Lifetime
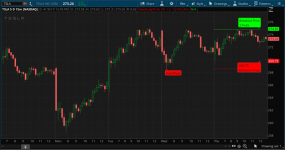
This indicator was created for ThinkorSwim based on Bulkowski's Double Bottom Setup. You can learn more about the pattern, examples, and how to trade it here.

Pm0SPMF.png


The Bulkowski Double Bottom indicator highlights a few things on your chart:
  • First Pivot
  • Pivot Low
  • Double Bottom Price
  • Breakout Price

thinkScript Code

Code:
# Bulkowski Double Bottom Pattern
# TASC Aril 2019
# Nube 3.30.19
# v 0.02, unsuccessfully trying to mark the first pivot of the pattern

    # INPUTS
input pivotLength = 4;
input maxDoubleBottomWidth = 24;
input tolerancePercentage = 1.5;
input ticksAboveDoubleBottomHigh = 1;

    # VARIABLES
# Universal
def h = high;
def l = low;
def nan = Double.NaN;
def x = BarNumber();
def tick = TickSize();
# Study Specific
def lowPivotBar = if !GetMinValueOffset(l, pivotLength + 1)
                  and GetMinValueOffset(l, pivotLength + 1)[-pivotLength + 1] ==
                      pivotLength - 1
                  then x
                  else lowPivotBar[1];
def lowPivot = if x == lowPivotBar
               then x   
               else nan;
def lowPivotPrice = if x == lowPivotBar
                    then l
                    else lowPivotPrice[1];
def priorLowPivotBar = if lowPivotBar != lowPivotBar[1]
                       then lowPivotBar[1]
                       else priorLowPivotBar[1];
def priorLowPivotPrice = if x == lowPivotBar
                         then GetValue(l,  lowPivotBar - priorLowPivotBar)
                         else priorLowPivotPrice[1];
def hh = if x crosses above lowPivotBar
         then h
         else if h > hh[1]
              then h
              else hh[1];
def highBetweenPivots = if x == lowPivotBar
                        then hh
                        else highBetweenPivots[1];
# Checking for pivot lows being within tolerancePercentage
def doubleBottom = if Between(lowPivotPrice,
                              priorLowPivotPrice * (1 - tolerancePercentage * .01),
                              priorLowPivotPrice * (1 + tolerancePercentage * .01))
                   and lowPivotBar - priorLowPivotBar <= maxDoubleBottomWidth
                   then Min(lowPivotPrice,priorLowPivotPrice)
                   else nan;
# invalidating pattern when price breaks below the doubleBottom price
def valid = if IsNaN(doubleBottom[1])
            and !IsNaN(doubleBottom)
            then 1
            else if l crosses below doubleBottom
                 then 0
                 else valid[1];

    # Plots
plot
PivotLow = x == lowPivotBar;
PivotLow.SetPaintingStrategy(PaintingStrategy.BOOLEAN_WEDGE_DOWN);
PivotLow.SetDefaultColor(Color.Red);

plot
DoubleBottomPrice = if valid then doubleBottom else nan;
DoubleBottomPrice.SetDefaultColor(Color.Red);
DoubleBottomPrice.SetPaintingStrategy(PaintingStrategy.HORIZONTAL);

plot
BreakoutPrice = if DoubleBottomPrice
                then highBetweenPivots + ticksAboveDoubleBottomHigh * tick
                else nan;
BreakoutPrice.SetDefaultColor(Color.Green);
BreakoutPrice.SetPaintingStrategy(PaintingStrategy.HORIZONTAL);

AddChartBubble(DoubleBottomPrice and IsNaN(DoubleBottomPrice[-1]), DoubleBottomPrice, DoubleBottomPrice+" Bottomm Price", Color.Red, 0);
AddChartBubble(BreakoutPrice and IsNaN(BreakoutPrice[-1]), BreakOutPrice, "Breakout Price"+ BreakOutPrice, Color.Green);

# f/  Bulkowski Double Bottom Pattern from April 2019 TASC this section still incorrect. Attempting to mark first pivot
def untilDB = fold i = -maxDoubleBottomWidth + 1 to 0
              with u
              while IsNaN(doubleBottom)
              do u + GetValue(IsNaN(doubleBottom), i);
        
def firstPivot = !IsNaN(lowPivot) and
                 IsNaN(GetValue(doubleBottom, -untilDB)) and
                 Between(GetValue(doubleBottom, -untilDB -1),
                         l * (1 - tolerancePercentage * .01),
                         l * (1 + tolerancePercentage * .01));

AddChartBubble(firstPivot, l, "First Pivot", Color.Red, 0);

Shareable Link

https://tos.mx/7678EI
 

Attachments

  • Pm0SPMF.png
    Pm0SPMF.png
    128.8 KB · Views: 405
Last edited:
Hello, i'm just new here, and just want to know if there is any script for double top/bottom candles, thanks a lot guys !
 
Last edited by a moderator:
Welcome. Unfortunately there is nothing like that at the moment. I'm afraid you will have to identify the candlestick pattern yourself.
 
Last edited:
@Cleartarget Sure. I basically just commented all the other plots out except the "DoubleBottomPrice" plot. That's the only plot you need for the scan (scans only allow one plot) that determines whether a double bottom exists in a stock or not.

Code:
# Bulkowski Double Bottom Pattern
# TASC Aril 2019
# Nube 3.30.19
# v 0.02, unsuccessfully trying to mark the first pivot of the pattern

    # INPUTS
input pivotLength = 1;
input maxDoubleBottomWidth = 24;
input tolerancePercentage = 1.5;
input ticksAboveDoubleBottomHigh = 1;

    # VARIABLES
        ## Universal
def h = high;
def l = low;
def nan = Double.NaN;
def x = BarNumber();
def tick = TickSize();
        ## Study Specific
def lowPivotBar = if !GetMinValueOffset(l, pivotLength + 1)
                  and GetMinValueOffset(l, pivotLength + 1)[-pivotLength + 1] ==
                      pivotLength - 1
                  then x
                  else lowPivotBar[1];
def lowPivot = if x == lowPivotBar
               then x 
               else nan;
def lowPivotPrice = if x == lowPivotBar
                    then l
                    else lowPivotPrice[1];
def priorLowPivotBar = if lowPivotBar != lowPivotBar[1]
                       then lowPivotBar[1]
                       else priorLowPivotBar[1];
def priorLowPivotPrice = if x == lowPivotBar
                         then GetValue(l,  lowPivotBar - priorLowPivotBar)
                         else priorLowPivotPrice[1];
def hh = if x crosses above lowPivotBar
         then h
         else if h > hh[1]
              then h
              else hh[1];
def highBetweenPivots = if x == lowPivotBar
                        then hh
                        else highBetweenPivots[1];
            ### Checking for pivot lows being within tolerancePercentage
def doubleBottom = if Between(lowPivotPrice,
                              priorLowPivotPrice * (1 - tolerancePercentage * .01),
                              priorLowPivotPrice * (1 + tolerancePercentage * .01))
                   and lowPivotBar - priorLowPivotBar <= maxDoubleBottomWidth
                   then Min(lowPivotPrice,priorLowPivotPrice)
                   else nan;
            ### invalidating pattern when price breaks below the doubleBottom price
def valid = if IsNaN(doubleBottom[1])
            and !IsNaN(doubleBottom)
            then 1
            else if l crosses below doubleBottom
                 then 0
                 else valid[1];


plot
DoubleBottomPrice = if valid then doubleBottom else nan;
DoubleBottomPrice.SetDefaultColor(Color.Red);
DoubleBottomPrice.SetPaintingStrategy(PaintingStrategy.HORIZONTAL);
 
Last edited by a moderator:
Mobius Version:

Code:
# Double Bottom
# Mobius

input Percent_A_to_B = 2;
input Percent_A_to_C = .1;
input nP = 13;
input ShowValues = yes;
input ShowLines = yes;

def AB = Percent_A_to_B / 100;
def AC = Percent_A_to_C / 100;
def h = high;
def l = low;
def bar = BarNumber();
def Ps = 1 + AC;
def Ns = 1 - AC; 

def ll = fold j = 1 to nP + 1 
         with q = 1
         while q
         do l < GetValue(low, -j);

def PivotL = if (bar > nP and 
                 l == Lowest(l, nP) and 
                 ll) 
            then l 
            else Double.NaN;

def PL1 = if !isNaN(PivotL) 
          then l 
          else PL1[1];

def PL1Bar = if !IsNaN(PivotL) 
             then bar 
             else PL1Bar[1];

def PL2 = if PL1 != PL1[1]
          then PL1[1]
          else PL2[1];

def PL2Bar = if PL1Bar != PL1Bar[1]
             then Pl1Bar[1] 
             else PL2Bar[1];

def Check1 = if between(PL2, PL1 * Ns, PL1 * Ps)
             then 1
             else 0;

plot Cond1 = HighestAll(if Check1
                        then PL2
                        else double.nan);

def PL3 = if PL2 != PL2[1]
          then PL2[1]
          else PL3[1];

def PL3Bar = if PL2Bar != PL2Bar[1]
             then Pl2Bar[1] 
             else PL3Bar[1];

def Check2 = if between(PL3, PL2 * Ns, PL2 * Ps)
             then 1
             else 0;

def PL4 = if PL3 != PL3[1]
         then PL3[1]
          else PL4[1];

def PL4Bar = if PL3Bar != PL3Bar[1]
             then PL3Bar[1]
             else PL4Bar[1];

def Check3 = if between(PL4, PL3 * Ns, PL3 * Ps)
             then 1
             else 0;

def PL5 = if PL4 != PL4[1]
          then PL4[1]
          else PL5[1];

def PL5Bar = if PL4Bar != PL4Bar[1]
             then PL4Bar[1]
             else PL5Bar[1];

def Check4 = if between(PL5, PL4 * Ns, PL4 * Ps)
             then 1
             else double.nan;

plot pivotLow = PivotL;
     pivotLow.SetDefaultColor(Color.Yellow);
     pivotLow.SetPaintingStrategy(PaintingStrategy.VALUES_BELOW);
     pivotLow.SetHiding(!ShowValues);

plot PivotDot = PivotL;
     PivotDot.SetDefaultColor(Color.Gray);
     PivotDot.SetPaintingStrategy(PaintingStrategy.POINTS);
     PivotDot.SetLineWeight(3);
# End Code
 
Last edited by a moderator:
In the first script, there is a message,

# f/ Bulkowski Double Bottom Pattern from April 2019 TASC this section still incorrect. Attempting to mark first pivot
def untilDB = fold i = -maxDoubleBottomWidth + 1 to 0
with u
while IsNaN(doubleBottom)
do u + GetValue(IsNaN(doubleBottom), i);

def firstPivot = !IsNaN(lowPivot) and
IsNaN(GetValue(doubleBottom, -untilDB)) and
Between(GetValue(doubleBottom, -untilDB -1),
l * (1 - tolerancePercentage * .01),
l * (1 + tolerancePercentage * .01));

Is there any update on this error?

Thanks

Mobius Version:

Code:
# Double Bottom
# Mobius

input Percent_A_to_B = 2;
input Percent_A_to_C = .1;
input nP = 13;
input ShowValues = yes;
input ShowLines = yes;

def AB = Percent_A_to_B / 100;
def AC = Percent_A_to_C / 100;
def h = high;
def l = low;
def bar = BarNumber();
def Ps = 1 + AC;
def Ns = 1 - AC;

def ll = fold j = 1 to nP + 1
         with q = 1
         while q
         do l < GetValue(low, -j);

def PivotL = if (bar > nP and
                 l == Lowest(l, nP) and
                 ll)
            then l
            else Double.NaN;

def PL1 = if !isNaN(PivotL)
          then l
          else PL1[1];

def PL1Bar = if !IsNaN(PivotL)
             then bar
             else PL1Bar[1];

def PL2 = if PL1 != PL1[1]
          then PL1[1]
          else PL2[1];

def PL2Bar = if PL1Bar != PL1Bar[1]
             then Pl1Bar[1]
             else PL2Bar[1];

def Check1 = if between(PL2, PL1 * Ns, PL1 * Ps)
             then 1
             else 0;

plot Cond1 = HighestAll(if Check1
                        then PL2
                        else double.nan);

def PL3 = if PL2 != PL2[1]
          then PL2[1]
          else PL3[1];

def PL3Bar = if PL2Bar != PL2Bar[1]
             then Pl2Bar[1]
             else PL3Bar[1];

def Check2 = if between(PL3, PL2 * Ns, PL2 * Ps)
             then 1
             else 0;

def PL4 = if PL3 != PL3[1]
         then PL3[1]
          else PL4[1];

def PL4Bar = if PL3Bar != PL3Bar[1]
             then PL3Bar[1]
             else PL4Bar[1];

def Check3 = if between(PL4, PL3 * Ns, PL3 * Ps)
             then 1
             else 0;

def PL5 = if PL4 != PL4[1]
          then PL4[1]
          else PL5[1];

def PL5Bar = if PL4Bar != PL4Bar[1]
             then PL4Bar[1]
             else PL5Bar[1];

def Check4 = if between(PL5, PL4 * Ns, PL4 * Ps)
             then 1
             else double.nan;

plot pivotLow = PivotL;
     pivotLow.SetDefaultColor(Color.Yellow);
     pivotLow.SetPaintingStrategy(PaintingStrategy.VALUES_BELOW);
     pivotLow.SetHiding(!ShowValues);

plot PivotDot = PivotL;
     PivotDot.SetDefaultColor(Color.Gray);
     PivotDot.SetPaintingStrategy(PaintingStrategy.POINTS);
     PivotDot.SetLineWeight(3);
# End Code


Does this have any explanation like the first one?


Thanks
 
Last edited by a moderator:
In the first script, there is a message,

# f/ Bulkowski Double Bottom Pattern from April 2019 TASC this section still incorrect. Attempting to mark first pivot
def untilDB = fold i = -maxDoubleBottomWidth + 1 to 0
with u
while IsNaN(doubleBottom)
do u + GetValue(IsNaN(doubleBottom), i);

def firstPivot = !IsNaN(lowPivot) and
IsNaN(GetValue(doubleBottom, -untilDB)) and
Between(GetValue(doubleBottom, -untilDB -1),
l * (1 - tolerancePercentage * .01),
l * (1 + tolerancePercentage * .01));

Is there any update on this error?

Thanks


Does this have any explanation like the first one?


Thanks
There has been no further information posted.

# # # # #
The best way to learn to read charts and indicators is to apply them. Recommend you put it on your chart. Nothing beats personal experience ;) The only way you will know what the plots are doing, is to observe them on your charts and how they inter-relate with your other indicators.

Most indicators need tweaking depending on the timeframe, the market, the ticker.

No one can possibly know what tweaks will work best for you. It is up to you to play with the settings and see how the indicator line up w/ your strategy and with your other indicators.

To determine if this indicator brings value, analyze it over different timeframes, across history and with multiple instruments.
# # # # #
 
Is there a way to convert a Bulkowski version to indicate Double Tops?
 
Last edited:
This indicator was created for ThinkorSwim based on Bulkowski's Double Bottom Setup. You can learn more about the pattern, examples, and how to trade it here.

Pm0SPMF.png


The Bulkowski Double Bottom indicator highlights a few things on your chart:
  • First Pivot
  • Pivot Low
  • Double Bottom Price
  • Breakout Price

thinkScript Code

Code:
# Bulkowski Double Bottom Pattern
# TASC Aril 2019
# Nube 3.30.19
# v 0.02, unsuccessfully trying to mark the first pivot of the pattern

    # INPUTS
input pivotLength = 4;
input maxDoubleBottomWidth = 24;
input tolerancePercentage = 1.5;
input ticksAboveDoubleBottomHigh = 1;

    # VARIABLES
# Universal
def h = high;
def l = low;
def nan = Double.NaN;
def x = BarNumber();
def tick = TickSize();
# Study Specific
def lowPivotBar = if !GetMinValueOffset(l, pivotLength + 1)
                  and GetMinValueOffset(l, pivotLength + 1)[-pivotLength + 1] ==
                      pivotLength - 1
                  then x
                  else lowPivotBar[1];
def lowPivot = if x == lowPivotBar
               then x  
               else nan;
def lowPivotPrice = if x == lowPivotBar
                    then l
                    else lowPivotPrice[1];
def priorLowPivotBar = if lowPivotBar != lowPivotBar[1]
                       then lowPivotBar[1]
                       else priorLowPivotBar[1];
def priorLowPivotPrice = if x == lowPivotBar
                         then GetValue(l,  lowPivotBar - priorLowPivotBar)
                         else priorLowPivotPrice[1];
def hh = if x crosses above lowPivotBar
         then h
         else if h > hh[1]
              then h
              else hh[1];
def highBetweenPivots = if x == lowPivotBar
                        then hh
                        else highBetweenPivots[1];
# Checking for pivot lows being within tolerancePercentage
def doubleBottom = if Between(lowPivotPrice,
                              priorLowPivotPrice * (1 - tolerancePercentage * .01),
                              priorLowPivotPrice * (1 + tolerancePercentage * .01))
                   and lowPivotBar - priorLowPivotBar <= maxDoubleBottomWidth
                   then Min(lowPivotPrice,priorLowPivotPrice)
                   else nan;
# invalidating pattern when price breaks below the doubleBottom price
def valid = if IsNaN(doubleBottom[1])
            and !IsNaN(doubleBottom)
            then 1
            else if l crosses below doubleBottom
                 then 0
                 else valid[1];

    # Plots
plot
PivotLow = x == lowPivotBar;
PivotLow.SetPaintingStrategy(PaintingStrategy.BOOLEAN_WEDGE_DOWN);
PivotLow.SetDefaultColor(Color.Red);

plot
DoubleBottomPrice = if valid then doubleBottom else nan;
DoubleBottomPrice.SetDefaultColor(Color.Red);
DoubleBottomPrice.SetPaintingStrategy(PaintingStrategy.HORIZONTAL);

plot
BreakoutPrice = if DoubleBottomPrice
                then highBetweenPivots + ticksAboveDoubleBottomHigh * tick
                else nan;
BreakoutPrice.SetDefaultColor(Color.Green);
BreakoutPrice.SetPaintingStrategy(PaintingStrategy.HORIZONTAL);

AddChartBubble(DoubleBottomPrice and IsNaN(DoubleBottomPrice[-1]), DoubleBottomPrice, DoubleBottomPrice+" Bottomm Price", Color.Red, 0);
AddChartBubble(BreakoutPrice and IsNaN(BreakoutPrice[-1]), BreakOutPrice, "Breakout Price"+ BreakOutPrice, Color.Green);

# f/  Bulkowski Double Bottom Pattern from April 2019 TASC this section still incorrect. Attempting to mark first pivot
def untilDB = fold i = -maxDoubleBottomWidth + 1 to 0
              with u
              while IsNaN(doubleBottom)
              do u + GetValue(IsNaN(doubleBottom), i);
       
def firstPivot = !IsNaN(lowPivot) and
                 IsNaN(GetValue(doubleBottom, -untilDB)) and
                 Between(GetValue(doubleBottom, -untilDB -1),
                         l * (1 - tolerancePercentage * .01),
                         l * (1 + tolerancePercentage * .01));

AddChartBubble(firstPivot, l, "First Pivot", Color.Red, 0);

Shareable Link

https://tos.mx/7678EI
Hi Ben, is Mobius's double top and bottom is delayed? can it be scanned real time?
 

Join useThinkScript to post your question to a community of 21,000+ developers and traders.

Similar threads

Not the exact question you're looking for?

Start a new thread and receive assistance from our community.

87k+ Posts
407 Online
Create Post

Similar threads

Similar threads

The Market Trading Game Changer

Join 2,500+ subscribers inside the useThinkScript VIP Membership Club
  • Exclusive indicators
  • Proven strategies & setups
  • Private Discord community
  • ‘Buy The Dip’ signal alerts
  • Exclusive members-only content
  • Add-ons and resources
  • 1 full year of unlimited support

Frequently Asked Questions

What is useThinkScript?

useThinkScript is the #1 community of stock market investors using indicators and other tools to power their trading strategies. Traders of all skill levels use our forums to learn about scripting and indicators, help each other, and discover new ways to gain an edge in the markets.

How do I get started?

We get it. Our forum can be intimidating, if not overwhelming. With thousands of topics, tens of thousands of posts, our community has created an incredibly deep knowledge base for stock traders. No one can ever exhaust every resource provided on our site.

If you are new, or just looking for guidance, here are some helpful links to get you started.

What are the benefits of VIP Membership?
VIP members get exclusive access to these proven and tested premium indicators: Buy the Dip, Advanced Market Moves 2.0, Take Profit, and Volatility Trading Range. In addition, VIP members get access to over 50 VIP-only custom indicators, add-ons, and strategies, private VIP-only forums, private Discord channel to discuss trades and strategies in real-time, customer support, trade alerts, and much more. Learn all about VIP membership here.
How can I access the premium indicators?
To access the premium indicators, which are plug and play ready, sign up for VIP membership here.
Back
Top