
You should upgrade or use an alternative browser.
Auto Fib (Fibonacci) Levels Indicator for ThinkorSwim
- Thread starter tomsk
- Start date
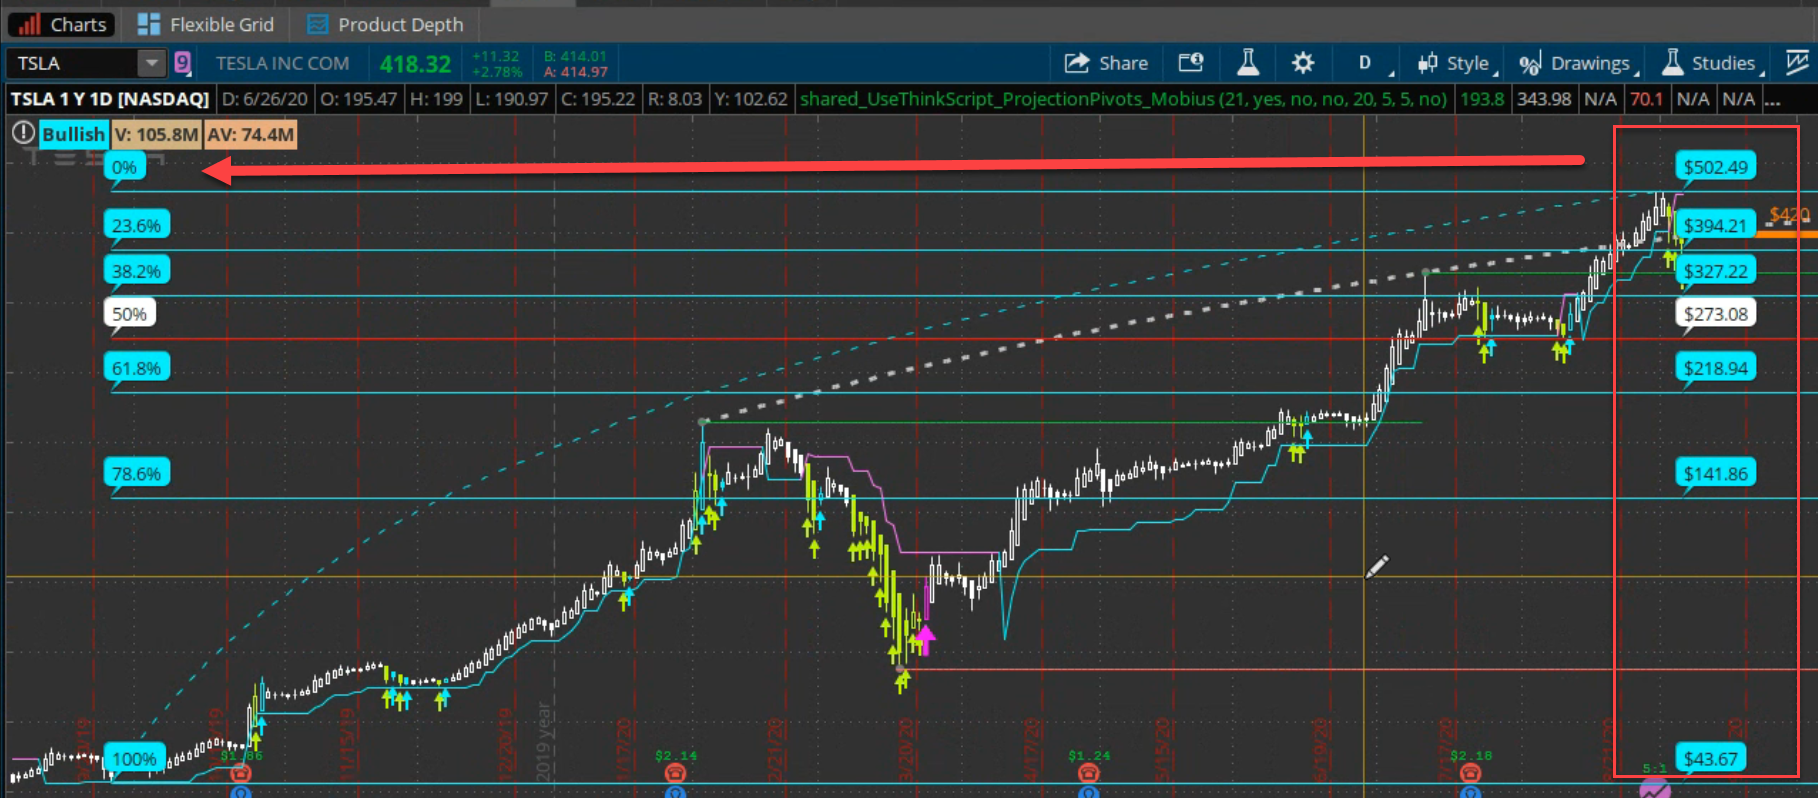
the retracement values I will change by myself
need just "end point" to be attached to the high of day and and "begin point'" always 0
please remove this line. its a double bubbleAddChartBubble((upward and barnumber == lownumberall), retracement3, concat( (coefficient_3 * 100), "%"), color.red, yes);[
")
##Begin

#hint: <b>Fibonacci Retracements</b>\nFibonacci retracements use horizontal lines to indicate areas of support or resistance at the key Fibonacci levels before it continues in the original direction. These levels are created by drawing a trendline between two extreme points and then dividing the vertical distance by the key Fibonacci ratios of: 23.6%, 38.2%, 50%, 61.8%, 78.6%, and 100%.


#hint Price: Price used in the alerts on crossing retracement lines. <b>(Default is Close)</b>
#hint onExpansion: Determines if the retracement lines are projected past the current bar into the right side expansion <b>(Default is Yes)</b>
#hint Extend_to_left: Determines if the retracement lines are extended to the left side of the chart. <b>(Default is No)</b>

#hint Coefficient0: Retracement Line 0: Retracement from the highest high to the lowest low.\n <b>(Default is 0%)</b>
#hint Coefficient_1: Retracement Line 1: Retracement from the highest high to the lowest low.\n <b>(Default is 23.6%)</b>
#hint Coefficient_2: Retracement Line 2: Retracement from the highest high to the lowest low.\n <b>(Default is 38.2%)</b>
#hint Coefficient_3: Retracement Line 3: Retracement from the highest high to the lowest low.\n <b>(Default is 50%)</b>
#hint Coefficient_4: Retracement Line 4: Retracement from the highest high to the lowest low.\n <b>(Default is 61.8%)</b>
#hint Coefficient_5: Retracement Line 5: Retracement from the highest high to the lowest low.\n <b>(Default is 78.6%)</b>
#hint Coefficient_6: Retracement Line 6: Retracement from the highest high to the lowest low.\n <b>(Default is 100%)</b>

#wizard input: Price
#wizard text: Inputs: Price:
#wizard input: onExpansion
#wizard text: onExpansion:
#wizard input: Extend_to_left
#wizard text: Extend_to_left:
#wizard input: Coefficient0
#wizard text: Coefficient0:
#wizard input: Coefficient_1
#wizard text: Coefficient_1:
#wizard input: Coefficient_2
#wizard text: Coefficient_2:
#wizard input: Coefficient_3
#wizard text: Coefficient_3:
#wizard input: Coefficient_4
#wizard text: Coefficient_4:
#wizard input: Coefficient_5
#wizard text: Coefficient_5:
#wizard input: Coefficient_6
#wizard text: Coefficient_6:

input price = close;
input high = high;
input low = low;
input onExpansion = Yes;
input Extend_to_left = no;
input Coefficient0 = 0.000;
input coefficient_1 = .236;
input Coefficient_2 = .382;
input Coefficient_3 = .500;
input Coefficient_4 = .618;
Input Coefficient_5 = .786;
input Coefficient_6 = 1.000;

def a = HighestAll(high);
def b = LowestAll(low);
def barnumber = barNumber();
def c = if high == a then barnumber else double.nan;
def d = if low == b then barnumber else double.nan;
rec highnumber = compoundValue(1, if IsNaN(c) then highnumber[1] else c, c);
def highnumberall = HighestAll(highnumber);
rec lownumber = compoundValue(1, if IsNaN(d) then lownumber[1] else d, d);
def lownumberall = LowestAll(lownumber);

def upward = highnumberall > lownumberall;
def downward = highnumberall < lownumberall;

def x = AbsValue(lownumberall - highnumberall );

def slope = (a - b) / x;
def slopelow = (b - a) / x;

def day = getDay();
def month = getMonth();
def year = getYear();
def lastDay = getLastDay();
def lastmonth = getLastMonth();
def lastyear = getLastYear();
def isToday = if(day == lastDay and month == lastmonth and year == lastyear, 1, 0);
def istodaybarnumber = HighestAll(if isToday then barnumber else double.nan);

def line = b + (slope * (barnumber - lownumber));
def linelow = a + (slopelow * (barnumber - highnumber));

def currentlinelow = if barnumber <= lownumberall then linelow else double.nan;
def currentline = if barnumber <= highnumberall then line else double.nan;

Plot FibFan =  if  downward then currentlinelow else if upward then currentline else double.nan;
FibFan.SetStyle(Curve.SHORT_DASH);
FibFan.AssignValueColor(color.cyan);
fibfan.hidebubble();

def range =  a - b;

Plot Retracement0 = if downward and !onexpansion and !extend_to_left and barnumber >= highnumberall and barnumber <= istodaybarnumber then highestall((b + (range *  coefficient0))) else if upward and !extend_to_left and !onexpansion and barnumber >= lownumberall and barnumber <= istodaybarnumber then highestall(a - (range * coefficient0)) else if downward and onexpansion and !extend_to_left and barnumber >= highnumberall then highestall((b + (range *  coefficient0))) else if upward and onexpansion and barnumber >= lownumberall and !extend_to_left then highestall(a - (range * coefficient0)) else if downward and !onexpansion and extend_to_left and barnumber <= istodaybarnumber then highestall((b + (range *  coefficient0))) else if upward and extend_to_left and !onexpansion and barnumber <= istodaybarnumber then highestall(a - (range * coefficient0)) else if downward and onexpansion and extend_to_left then highestall((b + (range *  coefficient0))) else if upward and onexpansion and extend_to_left then highestall(a - (range * coefficient0)) else double.nan;
Retracement0.assignvaluecolor(color.cyan);
retracement0.hidebubble();
AddChartBubble((barnumber == istodaybarnumber), retracement0, concat( "$", round(retracement0, 2)), color.cyan, yes);
AddChartBubble((downward and barnumber == highnumberall), retracement0, concat( (coefficient0 * 100), "%"), color.cyan, yes);
AddChartBubble((upward and barnumber == lownumberall), retracement0, concat( (coefficient0 * 100), "%"), color.cyan, yes);


Plot Retracement1 =  if downward and !onexpansion and !extend_to_left and barnumber >= highnumberall and barnumber <= istodaybarnumber then highestall((b + (range *  coefficient_1))) else if upward and !extend_to_left and !onexpansion and barnumber >= lownumberall and barnumber <= istodaybarnumber then highestall(a - (range * coefficient_1)) else if downward and onexpansion and !extend_to_left and barnumber >= highnumberall then highestall((b + (range *  coefficient_1))) else if upward and onexpansion and barnumber >= lownumberall and !extend_to_left then highestall(a - (range * coefficient_1)) else if downward and !onexpansion and extend_to_left and barnumber <= istodaybarnumber then highestall((b + (range *  coefficient_1))) else if upward and extend_to_left and !onexpansion and barnumber <= istodaybarnumber then highestall(a - (range * coefficient_1)) else if downward and onexpansion and extend_to_left then highestall((b + (range *  coefficient_1))) else if upward and onexpansion and extend_to_left then highestall(a - (range * coefficient_1)) else double.nan;
Retracement1.assignvaluecolor(color.cyan);
retracement1.hidebubble();
AddChartBubble((barnumber == istodaybarnumber), retracement1, concat( "$", round(retracement1, 2)), color.cyan, yes);
AddChartBubble((downward and barnumber == highnumberall), retracement1, concat( (coefficient_1 * 100), "%"), color.cyan, yes);
AddChartBubble((upward and barnumber == lownumberall), retracement1, concat( (coefficient_1 * 100), "%"), color.cyan, yes);

Plot Retracement2 =if downward and !onexpansion and !extend_to_left and barnumber >= highnumberall and barnumber <= istodaybarnumber then highestall((b + (range *  coefficient_2))) else if upward and !extend_to_left and !onexpansion and barnumber >= lownumberall and barnumber <= istodaybarnumber then highestall(a - (range * coefficient_2)) else if downward and onexpansion and !extend_to_left and barnumber >= highnumberall then highestall((b + (range *  coefficient_2))) else if upward and onexpansion and barnumber >= lownumberall and !extend_to_left then highestall(a - (range * coefficient_2)) else if downward and !onexpansion and extend_to_left and barnumber <= istodaybarnumber then highestall((b + (range *  coefficient_2))) else if upward and extend_to_left and !onexpansion and barnumber <= istodaybarnumber then highestall(a - (range * coefficient_2)) else if downward and onexpansion and extend_to_left then highestall((b + (range *  coefficient_2))) else if upward and onexpansion and extend_to_left then highestall(a - (range * coefficient_2)) else double.nan;
Retracement2.assignvaluecolor(color.cyan);
retracement2.hidebubble();
AddChartBubble("time condition" = (barnumber == istodaybarnumber), "price location" = retracement2, text = Concat( "$", Round(retracement2, 2)), color = Color.CYAN);
AddChartBubble((downward and barnumber == highnumberall), retracement2, concat( (coefficient_2 * 100), "%"), color.cyan, No);
AddChartBubble("time condition" = (upward and barnumber == lownumberall), "price location" = retracement2, text = Concat( (coefficient_2 * 100), "%"), color = Color.CYAN);


Plot Retracement3 = if downward and !onexpansion and !extend_to_left and barnumber >= highnumberall and barnumber <= istodaybarnumber then highestall((b + (range *  coefficient_3))) else if upward and !extend_to_left and !onexpansion and barnumber >= lownumberall and barnumber <= istodaybarnumber then highestall(a - (range * coefficient_3)) else if downward and onexpansion and !extend_to_left and barnumber >= highnumberall then highestall((b + (range *  coefficient_3))) else if upward and onexpansion and barnumber >= lownumberall and !extend_to_left then highestall(a - (range * coefficient_3)) else if downward and !onexpansion and extend_to_left and barnumber <= istodaybarnumber then highestall((b + (range *  coefficient_3))) else if upward and extend_to_left and !onexpansion and barnumber <= istodaybarnumber then highestall(a - (range * coefficient_3)) else if downward and onexpansion and extend_to_left then highestall((b + (range *  coefficient_3))) else if upward and onexpansion and extend_to_left then highestall(a - (range * coefficient_3)) else double.nan;
Retracement3.assignvaluecolor(color.red);
retracement3.hidebubble();
AddChartBubble((barnumber == istodaybarnumber), retracement3, concat( "$", round(retracement3, 2)), color.white, yes);
AddChartBubble((downward and barnumber == highnumberall), retracement3, concat( (coefficient_3 * 100), "%"), Color.WHITE, yes);
AddChartBubble((upward and barnumber == lownumberall), retracement3, concat( (coefficient_3 * 100), "%"), Color.WHITE, yes);


Plot Retracement4 = if downward and !onexpansion and !extend_to_left and barnumber >= highnumberall and barnumber <= istodaybarnumber then highestall((b + (range *  coefficient_4))) else if upward and !extend_to_left and !onexpansion and barnumber >= lownumberall and barnumber <= istodaybarnumber then highestall(a - (range * coefficient_4)) else if downward and onexpansion and !extend_to_left and barnumber >= highnumberall then highestall((b + (range *  coefficient_4))) else if upward and onexpansion and barnumber >= lownumberall and !extend_to_left then highestall(a - (range * coefficient_4)) else if downward and !onexpansion and extend_to_left and barnumber <= istodaybarnumber then highestall((b + (range *  coefficient_4))) else if upward and extend_to_left and !onexpansion and barnumber <= istodaybarnumber then highestall(a - (range * coefficient_4)) else if downward and onexpansion and extend_to_left then highestall((b + (range *  coefficient_4))) else if upward and onexpansion and extend_to_left then highestall(a - (range * coefficient_4)) else double.nan;
Retracement4.assignvaluecolor(color.cyan);
retracement4.hidebubble();
AddChartBubble((barnumber == istodaybarnumber), retracement4, concat( "$", round(retracement4, 2)), color.cyan, yes);
AddChartBubble((downward and barnumber == highnumberall), retracement4, concat( (coefficient_4 * 100), "%"), color.cyan, yes);
AddChartBubble((upward and barnumber == lownumberall), retracement4, concat( (coefficient_4 * 100), "%"), color.cyan, yes);

Plot Retracement5 = if downward and !onexpansion and !extend_to_left and barnumber >= highnumberall and barnumber <= istodaybarnumber then highestall((b + (range *  coefficient_5))) else if upward and !extend_to_left and !onexpansion and barnumber >= lownumberall and barnumber <= istodaybarnumber then highestall(a - (range * coefficient_5)) else if downward and onexpansion and !extend_to_left and barnumber >= highnumberall then highestall((b + (range *  coefficient_5))) else if upward and onexpansion and barnumber >= lownumberall and !extend_to_left then highestall(a - (range * coefficient_5)) else if downward and !onexpansion and extend_to_left and barnumber <= istodaybarnumber then highestall((b + (range *  coefficient_5))) else if upward and extend_to_left and !onexpansion and barnumber <= istodaybarnumber then highestall(a - (range * coefficient_5)) else if downward and onexpansion and extend_to_left then highestall((b + (range *  coefficient_5))) else if upward and onexpansion and extend_to_left then highestall(a - (range * coefficient_5)) else double.nan;
Retracement5.assignvaluecolor(color.cyan);
retracement5.hidebubble();
AddChartBubble((barnumber == istodaybarnumber), retracement5, concat( "$", round(retracement5, 2)), color.cyan, yes);
AddChartBubble((downward and barnumber == highnumberall), retracement5, concat( (coefficient_5 * 100), "%"), color.cyan, yes);
AddChartBubble((upward and barnumber == lownumberall), retracement5, concat( (coefficient_5 * 100), "%"), color.cyan, yes);


Plot Retracement6 = if downward and !onexpansion and !extend_to_left and barnumber >= highnumberall and barnumber <= istodaybarnumber then highestall((b + (range *  coefficient_6))) else if upward and !extend_to_left and !onexpansion and barnumber >= lownumberall and barnumber <= istodaybarnumber then highestall(a - (range * coefficient_6)) else if downward and onexpansion and !extend_to_left and barnumber >= highnumberall then highestall((b + (range *  coefficient_6))) else if upward and onexpansion and barnumber >= lownumberall and !extend_to_left then highestall(a - (range * coefficient_6)) else if downward and !onexpansion and extend_to_left and barnumber <= istodaybarnumber then highestall((b + (range *  coefficient_6))) else if upward and extend_to_left and !onexpansion and barnumber <= istodaybarnumber then highestall(a - (range * coefficient_6)) else if downward and onexpansion and extend_to_left then highestall((b + (range *  coefficient_6))) else if upward and onexpansion and extend_to_left then highestall(a - (range * coefficient_6)) else double.nan;
Retracement6.assignvaluecolor(color.cyan);
retracement6.hidebubble();
AddChartBubble((barnumber == istodaybarnumber), retracement6, concat( "$", round(retracement6, 2)), color.cyan, yes);

AddChartBubble((downward and barnumber == highnumberall), retracement6, concat( (coefficient_6 * 100), "%"), color.cyan, yes);
AddChartBubble((upward and barnumber == lownumberall), retracement6, concat( (coefficient_6 * 100), "%"), color.cyan, yes);


alert((price crosses below Retracement0) , "Price crosses below Retracement Line 0");
alert((price crosses above Retracement0) , "Price crosses above Retracement Line 0");
alert((price crosses below Retracement1) , "Price crosses below Retracement Line 1");
alert((price crosses above Retracement1) , "Price crosses above Retracement Line 1");
alert((price crosses below Retracement2) , "Price crosses below Retracement Line 2");
alert((price crosses above Retracement2) , "Price crosses above Retracement Line 2");
alert((price crosses below Retracement3) , "Price crosses below Retracement Line 3");
alert((price crosses above Retracement3) , "Price crosses above Retracement Line 3");
alert((price crosses below Retracement4) , "Price crosses below Retracement Line 4");
alert((price crosses above Retracement4) , "Price crosses above Retracement Line 4");
alert((price crosses below Retracement5) , "Price crosses below Retracement Line 5");
alert((price crosses above Retracement5) , "Price crosses above Retracement Line 5");
alert((price crosses below Retracement6) , "Price crosses below Retracement Line 6");
alert((price crosses above Retracement6) , "Price crosses above Retracement Line 6");
@BenTen @horserider @tomsk
@zeek per your request, I modified the time range method so that timerange_begin/timerange_end inputs would allow for post close of prior day, current day premarket, and custom user time ranges, with the Fibonacci lines drawn across the entire chart.
Code:#FibChoices v1 #Request usethinkscript.com @theelderwand to duplicate a swimdicators video's chart's indicator #BLT 20191224 #v1 20191228 per request @zeek, changed time range method so that timerange_begin/timerange_end inputs would allow for post close of prior day, current day premarket, and custom user time ranges, with the Fibonacci lines drawn across the entire chart. input method = {default aggregation, developing_reg_thrs, developing_ext_thrs, time_range}; input aggregation = AggregationPeriod.DAY; input aggregation_periodsback = 0; input timerange_begin = 0000; input timerange_end = 0929; # Examples: pre-market setting: 0000,0929; previous close through pre-market: 1600,0929; # intraday opening range: 0930,1030 input display_upper_extended_fibs = no; input display_lower_extended_fibs = no; input fib1 = .236; input fib2 = .382; input fib3 = .500; input fib4 = .618; input fib5 = .764; input showchart_bubbles = yes; input bubble_option = {default fiblevel, pricelevel}; input bubblemover = 1; #used to move the bubble left and right def bn = BarNumber(); #Time Range - Determines High/Low Where TimeRange_Begin Times are Between 1600 and 2359 Following the Prior Day's Close def globexOpen = if (if GetDayOfWeek(GetYYYYMMDD()) == 1 then SecondsFromTime(timerange_begin) >= 0 else SecondsFromTime(timerange_begin) >= 0) or SecondsFromTime(timerange_end) < 0 then 1 else 0; def globexReset = if globexOpen and !globexOpen[1] then 1 else 0; def globexHigh = CompoundValue(1, If((high > globexHigh[1] and globexOpen) or globexReset, high, globexHigh[1]), high); def globexLow = CompoundValue(1, If((low < globexLow[1] and globexOpen) or globexReset, low, globexLow[1]), low); def globexhighbn = if high == (globexHigh) then bn else globexhighbn[1]; def globexlowbn = if low == (globexLow) then bn else globexlowbn[1]; #Time Range - Determines High/Low with TimeRange_Begin Times From 0000 for PreMarket, Current Day or Intraday Pereiods def day = GetDay() == GetLastDay(); def lastday = if day and SecondsFromTime(timerange_begin) >= 0 then bn else Double.NaN; def hhamt = if day and bn == LowestAll(lastday) then high else if SecondsFromTime(timerange_end) <= 0 then Max(high, hhamt[1]) else hhamt[1]; def hhbn = if high == (hhamt) then bn else hhbn[1]; def llamt = if day and bn == LowestAll(lastday) then low else if SecondsFromTime(timerange_end) <= 0 then Min(low, llamt[1]) else llamt[1]; def llbn = if low == (llamt) then bn else llbn[1]; #Fibonacci High/Lows Determined based upon input method selected def hh; def ll; switch (method){ # case aggregation: hh = high(period = aggregation)[aggregation_periodsback]; ll = low(period = aggregation)[aggregation_periodsback]; # case developing_reg_thrs: hh = if GetTime() crosses above RegularTradingStart(GetYYYYMMDD()) then high else if GetTime() > RegularTradingStart(GetYYYYMMDD()) and high > hh[1] then high else hh[1]; ll = if GetTime() crosses above RegularTradingStart(GetYYYYMMDD()) then low else if GetTime() > RegularTradingStart(GetYYYYMMDD()) and low < ll[1] then low else ll[1]; # case developing_ext_thrs: hh = if GetTime() crosses above RegularTradingEnd(GetYYYYMMDD()) then high else if high > hh[1] then high else hh[1]; ll = if GetTime() crosses above RegularTradingEnd(GetYYYYMMDD()) then low else if low < ll[1] then low else ll[1]; # case time_range: #Lines will display across the entire chart hh = if Between(timerange_begin, 1600, 2359) then HighestAll(if BarNumber() == HighestAll(globexhighbn) then globexHigh else Double.NaN) else HighestAll(if bn == HighestAll(hhbn) then (hhamt) else Double.NaN); ll = if Between(timerange_begin, 1600, 2359) then LowestAll(if BarNumber() == HighestAll(globexlowbn) then globexLow else Double.NaN) else LowestAll(if bn == HighestAll(llbn) then llamt else Double.NaN); } #Fibonacci Line Plots def range = hh - ll; def f1 = ll + range * fib1; def f2 = ll + range * fib2; def f3 = ll + range * fib3; def f4 = ll + range * fib4; def f5 = ll + range * fib5; def hh1 = hh; def ll1 = ll; def ff1 = f1; def ff2 = f2; def ff3 = f3; def ff4 = f4; def ff5 = f5; input fib_line_choice = {default horizontal, points, dashes}; def paintingStrategy = if fib_line_choice == fib_line_choice.horizontal then PaintingStrategy.HORIZONTAL else if fib_line_choice == fib_line_choice.points then PaintingStrategy.POINTS else PaintingStrategy.DASHES; plot hhp = hh1; hhp.SetPaintingStrategy(paintingStrategy); hhp.SetDefaultColor(Color.GREEN); hhp.SetLineWeight(1); plot llp = ll1; llp.SetPaintingStrategy(paintingStrategy); llp.SetDefaultColor(Color.RED); llp.SetLineWeight(1); plot f1p = ff1; f1p.SetPaintingStrategy(paintingStrategy); f1p.SetDefaultColor(Color.YELLOW); f1p.SetLineWeight(1); plot f2p = ff2; f2p.SetPaintingStrategy(paintingStrategy); f2p.SetDefaultColor(Color.YELLOW); f2p.SetLineWeight(1); plot f3p = ff3; f3p.SetPaintingStrategy(paintingStrategy); f3p.SetDefaultColor(Color.WHITE); f3p.SetLineWeight(1); plot f4p = ff4; f4p.SetPaintingStrategy(paintingStrategy); f4p.SetDefaultColor(Color.YELLOW); f4p.SetLineWeight(1); plot f5p = ff5; f5p.SetPaintingStrategy(paintingStrategy); f5p.SetDefaultColor(Color.YELLOW); f5p.SetLineWeight(1); #Fibonacci - Upper Extended Fib Lines plot uhhp = if display_upper_extended_fibs == no then Double.NaN else range + hh1; uhhp.SetPaintingStrategy(paintingStrategy); uhhp.SetDefaultColor(Color.GREEN); uhhp.SetLineWeight(1); plot uf1p = if display_upper_extended_fibs == no then Double.NaN else range + ff1; uf1p.SetPaintingStrategy(paintingStrategy); uf1p.SetDefaultColor(Color.YELLOW); uf1p.SetLineWeight(1); plot uf2p = if display_upper_extended_fibs == no then Double.NaN else range + ff2; uf2p.SetPaintingStrategy(paintingStrategy); uf2p.SetDefaultColor(Color.YELLOW); uf2p.SetLineWeight(1); plot uf3p = if display_upper_extended_fibs == no then Double.NaN else range + ff3; uf3p.SetPaintingStrategy(paintingStrategy); uf3p.SetDefaultColor(Color.WHITE); uf3p.SetLineWeight(1); plot uf4p = if display_upper_extended_fibs == no then Double.NaN else range + ff4; uf4p.SetPaintingStrategy(paintingStrategy); uf4p.SetDefaultColor(Color.YELLOW); uf4p.SetLineWeight(1); plot uf5p = if display_upper_extended_fibs == no then Double.NaN else range + ff5; uf5p.SetPaintingStrategy(paintingStrategy); uf5p.SetDefaultColor(Color.YELLOW); uf5p.SetLineWeight(1); #Fibonacci - Lower Extended Fib Lines plot Lllp = if display_lower_extended_fibs == no then Double.NaN else ll - range; Lllp.SetPaintingStrategy(paintingStrategy); Lllp.SetDefaultColor(Color.RED); Lllp.SetLineWeight(1); plot Lf1p = if display_lower_extended_fibs == no then Double.NaN else ll - range * fib1; Lf1p.SetPaintingStrategy(paintingStrategy); Lf1p.SetDefaultColor(Color.YELLOW); Lf1p.SetLineWeight(1); plot Lf2p = if display_lower_extended_fibs == no then Double.NaN else ll - range * fib2; Lf2p.SetPaintingStrategy(paintingStrategy); Lf2p.SetDefaultColor(Color.YELLOW); Lf2p.SetLineWeight(1); plot Lf3p = if display_lower_extended_fibs == no then Double.NaN else ll - range * fib3; Lf3p.SetPaintingStrategy(paintingStrategy); Lf3p.SetDefaultColor(Color.WHITE); Lf3p.SetLineWeight(1); plot Lf4p = if display_lower_extended_fibs == no then Double.NaN else ll - range * fib4; Lf4p.SetPaintingStrategy(paintingStrategy); Lf4p.SetDefaultColor(Color.YELLOW); Lf4p.SetLineWeight(1); plot Lf5p = if display_lower_extended_fibs == no then Double.NaN else ll - range * fib5; Lf5p.SetPaintingStrategy(paintingStrategy); Lf5p.SetDefaultColor(Color.YELLOW); Lf5p.SetLineWeight(1); #Bubbles Displaying Fib Levels in Right Expansion def n = bubblemover; def n1 = n + 1; AddChartBubble(showchart_bubbles and !IsNaN(close[n1]) and IsNaN(close[n]), hhp[n1], 1, Color.GRAY, yes); AddChartBubble(showchart_bubbles and !IsNaN(close[n1]) and IsNaN(close[n]), ff1[n1], fib1, Color.GRAY, yes); AddChartBubble(showchart_bubbles and !IsNaN(close[n1]) and IsNaN(close[n]), ff2[n1], fib2, Color.GRAY, yes); AddChartBubble(showchart_bubbles and !IsNaN(close[n1]) and IsNaN(close[n]), ff3[n1], fib3, Color.GRAY, yes); AddChartBubble(showchart_bubbles and !IsNaN(close[n1]) and IsNaN(close[n]), ff4[n1], fib4, Color.GRAY, yes); AddChartBubble(showchart_bubbles and !IsNaN(close[n1]) and IsNaN(close[n]), ff5[n1], fib5, Color.GRAY, yes); AddChartBubble(showchart_bubbles and !IsNaN(close[n1]) and IsNaN(close[n]), llp[n1], 0, Color.GRAY, yes); AddChartBubble(showchart_bubbles and !IsNaN(close[n1]) and IsNaN(close[n]), uf1p[n1], 1 + fib1, Color.GRAY, yes); AddChartBubble(showchart_bubbles and !IsNaN(close[n1]) and IsNaN(close[n]), uf2p[n1], 1 + fib2, Color.GRAY, yes); AddChartBubble(showchart_bubbles and !IsNaN(close[n1]) and IsNaN(close[n]), uf3p[n1], 1 + fib3, Color.GRAY, yes); AddChartBubble(showchart_bubbles and !IsNaN(close[n1]) and IsNaN(close[n]), uf4p[n1], 1 + fib4, Color.GRAY, yes); AddChartBubble(showchart_bubbles and !IsNaN(close[n1]) and IsNaN(close[n]), uf5p[n1], 1 + fib5, Color.GRAY, yes); AddChartBubble(showchart_bubbles and !IsNaN(close[n1]) and IsNaN(close[n]), Lf1p[n1], -fib1, Color.GRAY, yes); AddChartBubble(showchart_bubbles and !IsNaN(close[n1]) and IsNaN(close[n]), Lf2p[n1], -fib2, Color.GRAY, yes); AddChartBubble(showchart_bubbles and !IsNaN(close[n1]) and IsNaN(close[n]), Lf3p[n1], -fib3 , Color.GRAY, yes); AddChartBubble(showchart_bubbles and !IsNaN(close[n1]) and IsNaN(close[n]), Lf4p[n1], -fib4, Color.GRAY, yes); AddChartBubble(showchart_bubbles and !IsNaN(close[n1]) and IsNaN(close[n]), Lf5p[n1], -fib5, Color.GRAY, yes); AddChartBubble(showchart_bubbles and !IsNaN(close[n1]) and IsNaN(close[n]), uhhp[n1], 2, Color.GRAY, yes); AddChartBubble(showchart_bubbles and !IsNaN(close[n1]) and IsNaN(close[n]), Lllp[n1], -1, Color.GRAY, yes); #Hiding Fib Line Price Levels Usually Displayed on Right Price Axis hhp.HideBubble(); llp.HideBubble(); uhhp.HideBubble(); Lllp.HideBubble(); f1p.HideBubble(); f2p.HideBubble(); f3p.HideBubble(); f4p.HideBubble(); f5p.HideBubble(); Lf1p.HideBubble(); Lf2p.HideBubble(); Lf3p.HideBubble(); Lf4p.HideBubble(); Lf5p.HideBubble(); uf1p.HideBubble(); uf2p.HideBubble(); uf3p.HideBubble(); uf4p.HideBubble(); uf5p.HideBubble();
I am trying to set this script to draw fibs ext or/and lines from 4am to 7:59pm. I just want to make sure I am doing this right. so after installing it I have set time range 0401 to 1959. Method is time_range & aggregation is set to D. Is this the right setting to get pm ext/lines? Please advise
trayhadot6
New member
Samus Aran
New member
Good evening Admin, I know that no one is paying you but I guess you wrote the Fibonacci expansion indicator as generous and helpful offer to the forum; I sure do need the help please.
I'm really struggling trying to modified your Fibonacci expansion indicator into a Fibonacci Arc. because that is how I found most accurate to Exit my trades because of the exponential decay line instead of a straight line. Until I get this working I cannot automate the closing of my trades or make money.
sincerely
# Objective: to make my own Fibonacci Arc indicator for the purpose of only Exiting my trades with no human input,  meaning "automated" the Fibonacci Arc provided in the drawing tools cannot be access in code meaning I cannot automate my trading, so I have to code one myself to myself.

#----->Start of Slope Calculations to determine only if the trend is Upward or Downward and nothing else <-----
def a = HighestAll(high);
def b = LowestAll(low);

def barnumber = barNumber();
def c = if high == a then barnumber else double.nan;
def d = if low == b then barnumber else double.nan;
rec highnumber = compoundValue(1, if IsNaN(c) then highnumber[1] else c, c);
def highnumberall = HighestAll(highnumber);
rec lownumber = compoundValue(1, if IsNaN(d) then lownumber[1] else d, d);
def lownumberall = LowestAll(lownumber);

def upward = highnumberall > lownumberall;
def downward = highnumberall < lownumberall;

def x = AbsValue(lownumberall - highnumberall );

def slope = (a - b) / x;
def slopelow = (b - a) / x;

def line = b + (slope * (barnumber - lownumber));
def linelow = a + (slopelow * (barnumber - highnumber));
def currentlinelow = if barnumber <= lownumberall then linelow else double.nan;
def currentline = if barnumber <= highnumberall then line else double.nan;

#----->END<-----

#----->Start of drawing a circle around the high close price if the Trend is Upward or a circle on the lowest point close price if the Trend is Downward and nothing else <-----
def r = ((1.618)/(highnumberall)) ;
plot Arc1 = fold i = 0 to 360 while i != 360 do ( highnumberall ) +  (i*((r*2*double.Pi)/(360)))  and ( highnumberall ) - (i*((r*2*double.Pi)/(360)));
Arc1.SetDefaultColor(Color.DARK_GREEN);
Arc1.SetStyle(Curve.FIRM);

def  r2 = ((23.6)/(lownumberall));
plot Arc2 = fold i2 = 0 to 360  while i2 != 360 do ( lownumberall ) - i2*((r2*2*double.Pi)/(360)) and ( lownumberall ) + (i2*((r2*2*double.Pi)/(360))) ;
Arc2.SetDefaultColor(Color.pINK);
Arc2.SetStyle(Curve.FIRM);

#----->END<-----Join useThinkScript to post your question to a community of 21,000+ developers and traders.
| Thread starter | Similar threads | Forum | Replies | Date |
|---|---|---|---|---|
| T | Auto Fib (Fibonacci) Extensions Indicator for ThinkorSwim | Indicators | 18 | |
|
|
Repaints Auto Trend Lines For ThinkOrSwim | Indicators | 6 | |
|
|
Auto Significant Price Levels for ThinkorSwim | Indicators | 158 | |
|
|
Auto Volatility Standard Deviation Levels for ThinkorSwim | Indicators | 23 | |
|
|
Auto Resistance/Support Break Detector | Indicators | 35 |
Similar threads
Not the exact question you're looking for?
Start a new thread and receive assistance from our community.
Similar threads
Similar threads
The Market Trading Game Changer
- Exclusive indicators
- Proven strategies & setups
- Private Discord community
- ‘Buy The Dip’ signal alerts
- Exclusive members-only content
- Add-ons and resources
- 1 full year of unlimited support
Frequently Asked Questions
useThinkScript is the #1 community of stock market investors using indicators and other tools to power their trading strategies. Traders of all skill levels use our forums to learn about scripting and indicators, help each other, and discover new ways to gain an edge in the markets.
We get it. Our forum can be intimidating, if not overwhelming. With thousands of topics, tens of thousands of posts, our community has created an incredibly deep knowledge base for stock traders. No one can ever exhaust every resource provided on our site.
If you are new, or just looking for guidance, here are some helpful links to get you started.
- The most viewed thread:
https://usethinkscript.com/threads/repainting-trend-reversal-for-thinkorswim.183/ - Our most popular indicator:
https://usethinkscript.com/threads/buy-the-dip-indicator-for-thinkorswim.3553/ - Answers to frequently asked questions:
https://usethinkscript.com/threads/answers-to-commonly-asked-questions.6006/