Im not much of a scripter, but is there any way it can plot some type of indication like a dot or arrow when volume switches to buying and the candlestick is red(selling) and vise versa for when the volume switches to selling but the candlestick is green(buying)
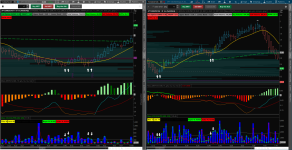
Here's an example of what I mean. These were Friday's EXPY SPY contracts. The Chart set up is with heiken ashi candles. What I've noticed is that when momentum is shifting to the bullish or bearish side. The Candlestick stick opposes its volume indication. So a bearish candlestick on a positive volume indication followed by a second consecutive bullish volume has been indicating a quick bullish move or a true bullish move and vise versa for the bear side. Any way we can find a way to get indications for those kinds of moments?
Im not much of a scripter, but is there any way it can plot some type of indication like a dot or arrow when volume switches to buying and the candlestick is red(selling) and vise versa for when the volume switches to selling but the candlestick is green(buying)
Here's an example of what I mean. These were Friday's EXPY SPY contracts. The Chart set up is with heiken ashi candles. What I've noticed is that when momentum is shifting to the bullish or bearish side. The Candlestick stick opposes its volume indication. So a bearish candlestick on a positive volume indication followed by a second consecutive bullish volume has been indicating a quick bullish move or a true bullish move and vise versa for the bear side. Any way we can find a way to get indications for those kinds of moments?
I am not sure if that would work on a lower TF as it would constantly switch from red to green in a lot of cases. This is an interesting find. It is a divergence in volume to candle and it does seem to be pretty consistent. I am not a coder. I had Chat GPT make this by accident. Maybe some of the really good coders here may be able to help. It does appear to be a good strat possibly.
Metal can you make buy sell separate percentage volume watchlist column for different time frame 1 2 5 15 minute and any reversal signal so we can scalp with if all align...
Have been following DTS and the Professor, he makes it look SO simple. He does rely heavily on the Scalping/Momentum Indicator. I had no idea METAL you were the developer. Amazing - nice work. He always posts his videos after the day, wish he, and the group would live stream. Are you part of the Million Dollars Margin Club? I actually just bought the Day Trading Vol 1 book. Did you have your hand?
Anyhow, I have been visually back testing the Heikin Ashi/Scalper Indicator combo - it does indeed to happen often. Very interesting observation. I agree it would be amazing to code up an indicator that would provide the buy/sell accordingly.
My understanding is that ThinkorSwim does not provide a "true" cumulative volume indicator on its platform similar to Tradingview or other more updated scripting capacity platforms. to be explicit ,TOS does not aggregate the individual spread difference for transactions spread between buyers and sellers during the actual auction process as it unfolds. (In my opinion scalpers especially favor cum delta volume because it shows the internal tension in a moment by moment unfolding process.) All the volume studies I have personally observed on usethinkscipt.com theads seem to have as their goal a "workaround" for this lack of precision and information. Given what I have seen so far, there is no perfect way to perform a true cumulative delta volume indicator in thinkorswim. Please feel free to reply and further enlighten me about this subject. One last comment: even with the cum delta volume study, I have personally observed many, I repeat, many false short term breakouts and reversals even in the most robust index like spx, spy and index options. Whatever signal a TOS trader uses to drill down into the internal auction process I suggest that it is critical pay attention to the tick indicators and the cumulative tick indicators along with all these (Mobius Volume Waves, Buy, Sell vol,
This is useful as a workaround for the reality that unlike Tradingview, there is no actual cumulative delta indicator on TOS (the accumulation spread between buyer and seller in the transactional auction process. Aside from that this is an excellent tool to decipher the internal tension over the selected time period in which you are trading. U could add a cumulative tick indicator across the price section (for the major indexes) in order to get a clearer picture of how the auction, price discovery process is unfolding. I take comfort that I have observed that the cumulative delta indicators on other platforms lead to many false breakouts and short term reversals. Do not despair as the only perfect indicator is already inside you. No single electronic signal will replace you when you are in total synchronization with the market. Thanks to everyone working on this thread. Very creative workarounds.
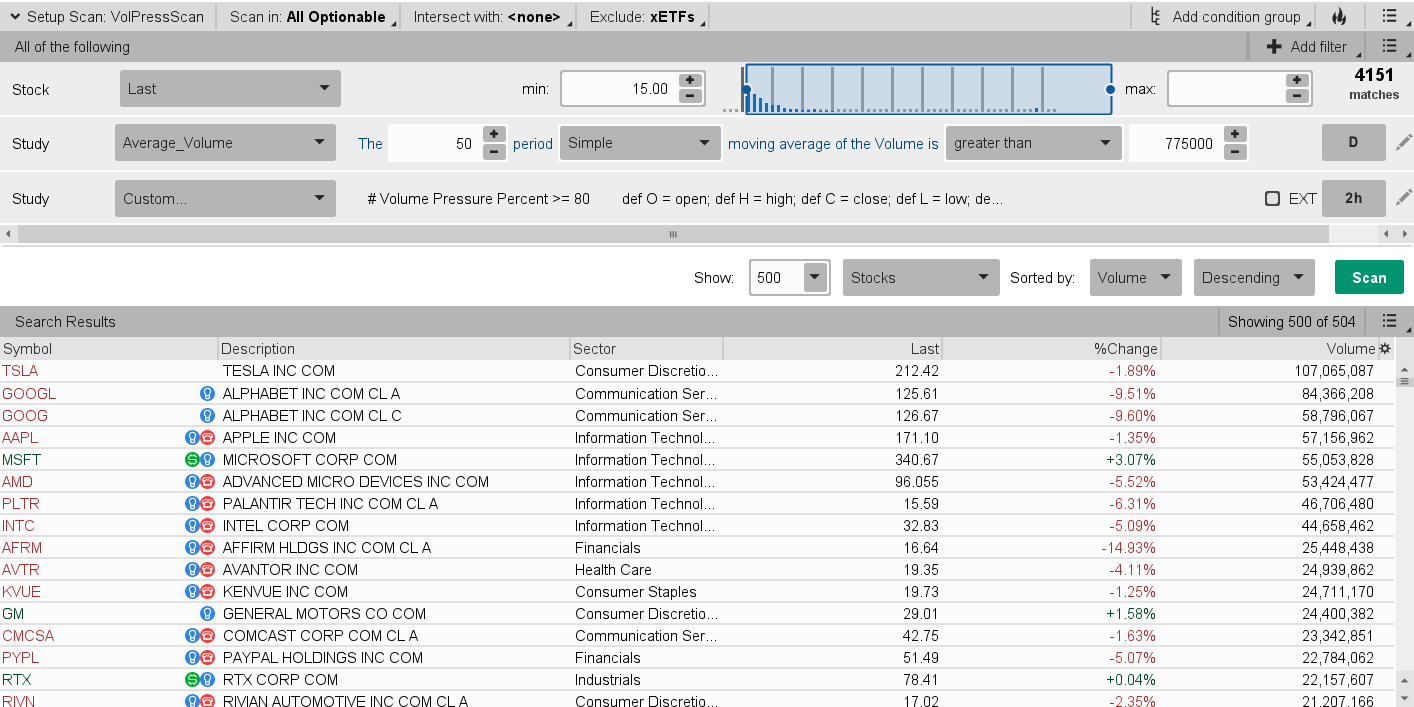
What statements here to be changed in order to get it as a scan condition . for example I would like a create a scan for ,y watchlist stocks to displau only when
Would you happen to have the code for this scan? the "Volume pressure scan > 80" code. Updated to Schwab by accident. I can still use codes, just not shared links.
@priyamani
Not sure that this scan has much use.
The percentage of volume pressure is not indicative of trend
If Selling Volume Pressure is increasing on my higher timeframes, I might do a deeper analysis before entry on my lower timeframe and visa-versa. But the actual value is of limited value.
@SeeMoreGreen
Sorry about that.
I try to always provide the actual code.
This post has been updated with the script.
FYI, Shared links are available in the Schwab ToS app. But there is a delay in the use of new shared links.
Shared Links are only updated into the Schwab ToS app overnight.
So new shared links are not available until the next day.
I included some code to plot when the two cross up or down. Unfortunately, it's only showing the "cross down" and doesn't show the "cross up" plots. Can someone help me get the "cross up" to show?
Here you go. I also added a cloud and a "Net Buy / Sell" avg line to spot divergences. Both can be turned on/off but most likely need to diable volume histogram for these 2 features to be useful.
#Buy/Sell Volume Moving Averages
declare lower;
def O = open;
def H = high;
def C = close;
def L = low;
def V = volume;
def Buying = V * (C - L) / (H - L);
def Selling = V * (H - C) / (H - L);
The ToS data feeds do not provide buying and selling volume.
You could plot your relative volume
and below it plot a buying and selling volume pressure indicator https://usethinkscript.com/threads/all-buy-s
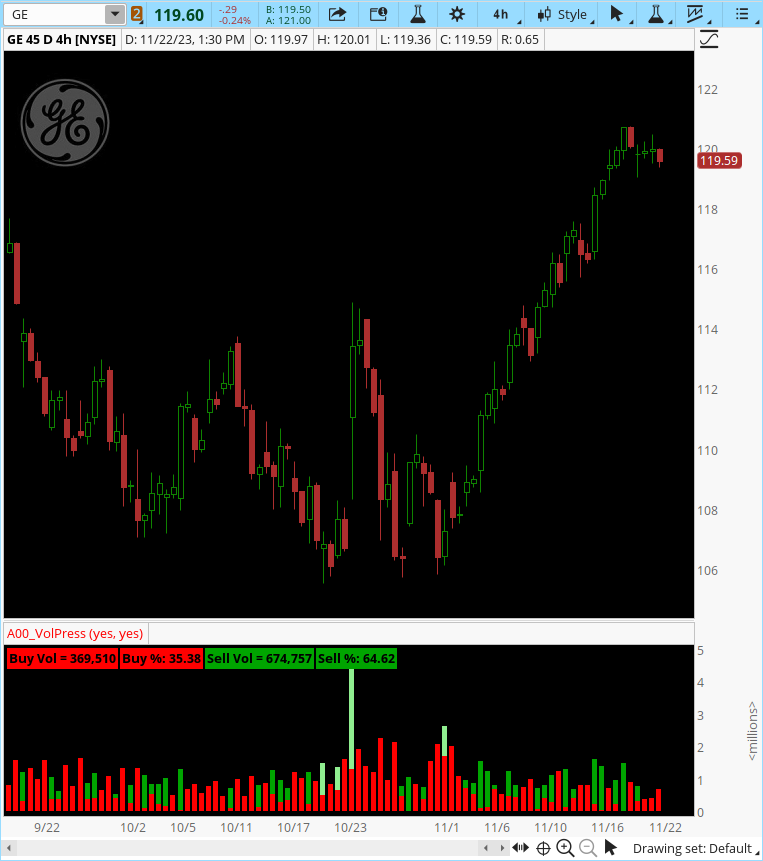
One request @MerryDay , the study which you referred for the buying/selling pressure is superb and I intend to use it on a 4 hour aggregation. I Have copied the as attached but I only see the labels, not the contrast of buy/sell on a single volume bar. Please suggest
One request @MerryDay , the study which you referred for the buying/selling pressure is superb and I intend to use it on a 4 hour aggregation. I Have copied the as attached but I only see the labels, not the contrast of buy/sell on a single volume bar. Please suggest
As mentioned in the earlier reply, it's important to note that the ToS data feeds don't include bid-ask volume information. The indicators you've been posting are Volume Pressure Indicators.
These indicators forecast buy/sell volume based on PRICE movement. The concept is that bullish candlesticks typically represent bid volume, while bearish ones reflect ask.
Volume Pressure analyzes price changes, combined with volume, to gauge MOMENTUM rather than specifically identifying bid ask volume.
Regarding your query: When your script is applied to a daily chart, the "current" labels pertain to today's data, while the "lastbar" labels refer to the 'yesterday' data you're inquiring about.
Various shareable links have been posted in here, is there something I am missing about accessing these links with the new Schwab merger. Prior it was just click and open now links open up another TOS while it is open and can’t open the file. Not trying to be that guy, absolutely am that guy. Half of the website is now nit accessible due to many posts having shared links.
Various shareable links have been posted in here, is there something I am missing about accessing these links with the new Schwab merger. Prior it was just click and open now links open up another TOS while it is open and can’t open the file. Not trying to be that guy, absolutely am that guy. Half of the website is now nit accessible due to many posts having shared links.
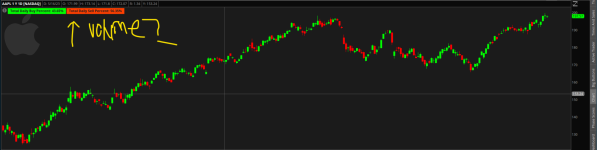
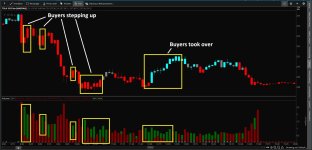
I've been researching all of the volume indicators on the site, looking for something to tell me when a reversal is going to happen. I really didn't find what I was looking for so I threw together something for myself. I think the image below does a good job explaining the indicator.
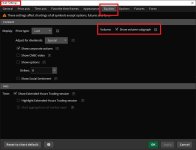
This new toy will go over the top of volume, so be sure you have volume checked in the settings and make it a subgraph.
Ruby:
# Dap711 - 2024

declare on_volume;

#Chart Bars
input PaintBars       = yes;

#Volume Pressure
input Volume_AvgType  = AverageType.EXPONENTIAL;
input Volume_Length   = 14;

#Moving Average
input MovAvg_AvgType  = AverageType.EXPONENTIAL;
input MovAvg_Price    = close;
input MovAvg_Length   = 20;

def selling = volume * ( high - close ) / ( high - low );
def buying  = volume * ( close - low ) / ( high - low );
def vol     = volume;

#Plot Histograms
Plot Plot1 = min(selling,buying);
     Plot1.setPaintingStrategy(PaintingStrategy.Histogram);
     Plot1.AssignValueColor( if selling <= buying then Color.DARK_RED else Color.DARK_GREEN );
     Plot1.HideTitle();
     Plot1.HideBubble();
     Plot1.SetLineWeight(5);

Plot Plot2 =  vol;
     Plot2.setPaintingStrategy(PaintingStrategy.Histogram);
     Plot2.AssignValueColor( if selling <= buying then Color.DARK_GREEN else Color.DARK_RED);
     Plot2.HideTitle();
     Plot2.HideBubble();
     Plot2.SetLineWeight(5);

#Calculate Volume Pressure
def upper_wick = if close>open then high-close else high-open;
def lower_wick = if close>open then open-low else close-low;
def spread = high-low;
def body_length = spread - (upper_wick + lower_wick);
def percent_upper_wick = upper_wick/spread;
def percent_lower_wick = lower_wick/spread;
def percent_body_length = body_length/spread;
def buy_volume = if close>open then
               (percent_body_length + (percent_upper_wick + percent_lower_wick)/2)* volume else
               ((percent_upper_wick + percent_lower_wick)/2) * volume;
def sell_volume = if close<open then
                (percent_body_length + (percent_upper_wick + percent_lower_wick)/2)* volume else
                ((percent_upper_wick + percent_lower_wick)/2) * volume;
def buying_volume = MovingAverage(Volume_AvgType, buy_volume,Volume_Length);
def selling_volume = MovingAverage(Volume_AvgType, sell_volume,Volume_Length);

#Moving Average
def MA = MovingAverage(MovAvg_AvgType,MovAvg_Price,MovAvg_Length);

#Plots
plot Dot_Cyan = if buying_volume > selling_volume and close > MA then 0 else Double.NaN ;
Dot_Cyan.SetPaintingStrategy(PaintingStrategy.SQUARES);
Dot_Cyan.SetLineWeight(5);
Dot_Cyan.AssignValueColor(Color.CYAN);

plot Dot_Red = if buying_volume < selling_volume and close < MA then 0 else Double.NaN ;
Dot_Red.SetPaintingStrategy(PaintingStrategy.SQUARES);
Dot_Red.SetLineWeight(5);
Dot_Red.AssignValueColor(Color.Red);

#Paint Candles
AssignPriceColor( if PaintBars and !IsNan(Dot_Cyan)  then Color.Cyan
                  else if PaintBars and !IsNan(Dot_Red) then Color.Red
                  else if PaintBars then Color.GRAY
                  else Color.CURRENT);
Chris's Enhanced Volume For ThinkOrSwim
Buy / Sell Volume Pressure Percentages View attachment 913
Buyers and Sellers is not information available in the data feeds.
When we look at the movement of price in comparison to volume, it is called Volume Pressure.
The scripts discussed here are representative of the PRICE spread compared to the overall volume spread.
We create a percentage for buying and selling pressure by using the candlestick patterns weighted volume.
Volume Pressure identifies the price movement which when aggregated with volume it is used to define MOMENTUM not actual buyers and sellers.
You can't apply the momentum percentage to the volume number and declare that to be the number of buyers and sellers. View attachment 11814View attachment 11815
I like the Upper Buy/Sell Volume Labels but modified it a bit to show ONLY VOLUME. The Label that is GREEN is the label with the most volume.
#Chris' Enhanced Volume V.2 /w Uptick/Downtick
#Modified by C. Ricks to show volume only 1/5/24
#Note: Whichever label is GREEN (Buy Vol or Sell Vol) will show the most volume.
useThinkScript is the #1 community of stock market investors using indicators and other tools to power their trading strategies. Traders of all skill levels use our forums to learn about scripting and indicators, help each other, and discover new ways to gain an edge in the markets.
How do I get started?
We get it. Our forum can be intimidating, if not overwhelming. With thousands of topics, tens of thousands of posts, our community has created an incredibly deep knowledge base for stock traders. No one can ever exhaust every resource provided on our site.
If you are new, or just looking for guidance, here are some helpful links to get you started.
VIP members get exclusive access to these proven and tested premium indicators: Buy the Dip, Advanced Market Moves 2.0, Take Profit, and Volatility Trading Range. In addition, VIP members get access to over 50 VIP-only custom indicators, add-ons, and strategies, private VIP-only forums, private Discord channel to discuss trades and strategies in real-time, customer support, trade alerts, and much more. Learn all about VIP membership here.
How can I access the premium indicators?
To access the premium indicators, which are plug and play ready, sign up for VIP membership here.