
K_O_Trader
Member
#Chris' Enhanced Volume V.2 /w Uptick/DowntickBuy and Sell Volume Pressure Indicator for higher TimeFrames (Weekly, Monthly etc.)
Anyone know how to modify this Indicator to view / use it on higher time frames
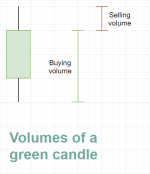
Code:#Total Volume for Regular Trading Day AddLabel(yes, "Total Vol: " + volume(period = AggregationPeriod.DAY), Color.white); #Volume of Current Bar AddLabel(yes, "CurrentBar Vol: " + volume, Color.LIGHT_GREEN); #Volume of the Last Bar AddLabel(yes, "LastBar Vol: " + volume[1], Color.LIGHT_ORANGE); #PreMarket Volume input startTime = 0400; input endTime = 0929; def startCounter = SecondsFromTime(startTime); def endCounter = SecondsTillTime(endTime); def targetPeriod = if startCounter >= 0 and endCounter >= 0 then 1 else 0; rec volumeTotal = if targetPeriod and !targetPeriod[1] then volume else if targetPeriod then volumeTotal[1] + volume else volumeTotal[1]; AddLabel(yes, Concat("PreMrket Vol: ", volumeTotal), Color.VIOLET); #Volume color coded by amount of volume on up-tick versus amount of volume on down-tick declare lower; def O = open; def H = high; def C = close; def L = low; def V = volume; def Buying = V * (C - L) / (H - L); def Selling = V * (H - C) / (H - L); # Selling Volume plot SV = Selling; SV.SetPaintingStrategy(PaintingStrategy.HISTOGRAM); SV.SetDefaultColor(Color.LIGHT_RED); SV.HideTitle(); SV.HideBubble(); SV.SetLineWeight(5); # Buying Volume # Plot BV = Buying; # Note that Selling + Buying Volume = Volume. plot BV = volume; BV.SetPaintingStrategy(PaintingStrategy.HISTOGRAM); BV.SetDefaultColor(Color.GREEN); BV.HideTitle(); BV.HideBubble(); BV.SetLineWeight(5); #Create an average volume line based on last 50 bars input length = 20; plot Vol = volume; plot VolAvg = Average(volume, length); Vol.SetPaintingStrategy(PaintingStrategy.HISTOGRAM);
declare on_volume;
###############
#DPL CRITERIA #
###############
input agg = aggregationPeriod.fIVE_MIN;
input Audible_Alert = yes;
def Deviation_Length = 60;
def Deviate = 2;
def volumestdev = RelativeVolumeStDev(length = Deviation_Length);
def abovedev = volumestdev >= Deviate;
def belowdev = volumestdev <= Deviate;
############
# DPL BARS #
############
def increase = volume(period=agg) > volume(period=agg)[1];
def devincrease = increase and abovedev;
def decrease = volume(period=agg) < volume(period=agg)[1];
def devdecrease = decrease and abovedev;
##############################
# UPTICK / DOWNTICK CRITERIA #
##############################
def O = open(period=agg);
def H = high(period=agg);
def C = close(period=agg);
def L = low(period=agg);
def V = volume(period=agg);
def Buying = V * (C - L) / (H - L);
def Selling = V * (H - C) / (H - L);
##################
# Selling Volume #
##################
plot SV = Selling;
SV.DefineColor("Decrease", Color.rED);
SV.DefineColor("DevDecrease", Color.pink);
SV.AssignValueColor(if devdecrease then SV.Color("DevDecrease") else SV.Color("Decrease"));
SV.SetPaintingStrategy(PaintingStrategy.HISTOGRAM);
SV.HideTitle();
SV.HideBubble();
SV.SetLineWeight(5);
#################
# Buying Volume #
#################
DefineGlobalColor("LabelGreen", CreateColor(0, 165, 0)) ;
plot BV = Buying;
BV.DefineColor("Increase", GlobalColor("LabelGreen"));
BV.DefineColor("DevIncrease", Color.light_GREEN);
BV.AssignValueColor(if devincrease then BV.Color("DevIncrease") else BV.Color("Increase"));
BV.SetPaintingStrategy(PaintingStrategy.HISTOGRAM);
BV.HideTitle();
BV.HideBubble();
BV.SetLineWeight(5);
#################
# Adding Volume Labels #
#################
input Show_Labels = yes;
AddLabel(Show_Labels, "Buy Vol = " + Round(Buying, 0),
if Buying > Selling then GlobalColor("LabelGreen") else color.red);
AddLabel(Show_Labels, "Buy %: " + Round((Buying/(Buying+Selling))*100,2), If (Buying/(Buying+Selling))*100 > 60 then GlobalColor("LabelGreen") else color.red);
AddLabel(Show_Labels, "Sell Vol = " + Round(Selling, 0),
if Selling > Buying then GlobalColor("LabelGreen") else color.red);
AddLabel(Show_Labels, "Sell %: " + Round((Selling/(Selling+Buying))*100,2), If (Selling/(Selling+Buying))*100 > 60 then GlobalColor("LabelGreen") else color.RED);
")