All Buy / Sell Volume Pressure Indicators & Labels For ThinkOrSwim

I would like to add " Last VOl" & "Pre Market" Vol label to below code. I am not sure who the owner and should be credit.


# CustVolumeStudy by 7of9 for BRT

declare lower;

#Inputs

input Show30DayAvg = yes;
input ShowTodayVolume = yes;
input ShowPercentOf30DayAvg = yes;
input UnusualVolumePercent = 200;
input Show30BarAvg = yes;
input ShowCurrentBar = yes;
input ShowPercentOf30BarAvg = yes;
input ShowSellVolumePercent = yes;

def O = open;
def H = high;
def C = close;
def L = low;
def V = volume;
def buying = V*(C-L)/(H-L);
def selling = V*(H-C)/(H-L);

# Selling Volume

Plot SellVol = selling;
SellVol.setPaintingStrategy(PaintingStrategy.Histogram);
SellVol.SetDefaultColor(Color.Red);
SellVol.HideTitle();
SellVol.HideBubble();
SellVol.SetLineWeight(5);

# Total Volume

Plot BuyVol = volume;
BuyVol.setPaintingStrategy(PaintingStrategy.Histogram);
BuyVol.SetDefaultColor(Color.Dark_Green);
BuyVol.HideTitle();
BuyVol.HideBubble();
BuyVol.SetLineWeight(5);

#Volume Data

def volLast30DayAvg = (volume(period = "DAY")[1] + volume(period = "DAY")[2] + volume(period = "DAY")[3] + volume(period = "DAY")[4] + volume(period = "DAY")[5] + volume(period = "DAY")[6] + volume(period = "DAY")[7] + volume(period = "DAY")[8] + volume(period = "DAY")[9] + volume(period = "DAY")[10] + volume(period = "DAY")[11] + volume(period = "DAY")[12] + volume(period = "DAY")[13] + volume(period = "DAY")[14] + volume(period = "DAY")[15] + volume(period = "DAY")[16] + volume(period = "DAY")[17] + volume(period = "DAY")[18] + volume(period = "DAY")[19] + volume(period = "DAY")[20] + volume(period = "DAY")[21] + volume(period = "DAY")[22] + volume(period = "DAY")[23] + volume(period = "DAY")[24] + volume(period = "DAY")[25] + volume(period = "DAY")[26] + volume(period = "DAY")[27] + volume(period = "DAY")[28] + volume(period = "DAY")[29] + volume(period = "DAY")[30]) / 30;
def today = volume(period = "DAY");
def percentOf30Day = Round((today / volLast30DayAvg) * 100, 0);
def avg30Bars = (volume[1] + volume[2] + volume[3] + volume[4] + volume[5] + volume[6] + volume[7] + volume[8] + volume[9] + volume[10] + volume[11] + volume[12] + volume[13] + volume[14] + volume[15] + volume[16] + volume[17] + volume[18] + volume[19] + volume[20] + volume[21] + volume[22] + volume[23] + volume[24] + volume[25] + volume[26] + volume[27] + volume[28] + volume[29] + volume[30]) / 30;
def curVolume = volume;
def percentOf30Bar = Round((curVolume / avg30Bars) * 100, 0);
def SellVolPercent = Round((Selling / Volume) * 100, 0);

# Labels

AddLabel(Show30DayAvg, "Avg 30 Days: " + Round(volLast30DayAvg, 0), Color.LIGHT_GRAY);

AddLabel(ShowTodayVolume, "Today: " + today, (if percentOf30Day >= UnusualVolumePercent then Color.GREEN else if percentOf30Day >= 100 then Color.ORANGE else Color.LIGHT_GRAY));

AddLabel(ShowPercentOf30DayAvg, percentOf30Day + "%", (if percentOf30Day >= UnusualVolumePercent then Color.GREEN else if percentOf30Day >= 100 then Color.ORANGE else Color.WHITE) );

AddLabel(Show30BarAvg, "Avg 30 Bars: " + Round(avg30Bars, 0), Color.LIGHT_GRAY);

AddLabel(ShowCurrentBar, "Cur Bar: " + curVolume, (if percentOf30Bar >= UnusualVolumePercent then Color.GREEN else if PercentOf30Bar >= 100 then Color.ORANGE else Color.LIGHT_GRAY));

AddLabel(ShowPercentOf30BarAvg, PercentOf30Bar + "%", (if PercentOf30Bar >= UnusualVolumePercent then Color.GREEN else if PercentOf30Bar >= 100 then Color.ORANGE else Color.WHITE) );

AddLabel(ShowSellVolumePercent, "Cur Bar Sell %: " + SellVolPercent, (if SellVolPercent > 51 then Color.pink else if SellVolPercent < 49 then Color.GREEN else Color.ORANGE));

input length = 50;

plot Vol = volume;
plot VolAvg = Average(volume, length);

Vol.SetPaintingStrategy(PaintingStrategy.HISTOGRAM);
Vol.SetLineWeight(3);
Vol.DefineColor("Up", Color.UPTICK);
Vol.DefineColor("Down", Color.DOWNTICK);
Vol.AssignValueColor(if close > close[1] then Vol.color("Up") else if close < close[1] then Vol.color("Down") else GetColor(1));
VolAvg.SetDefaultColor(GetColor(8));
 
Good Afternoon,
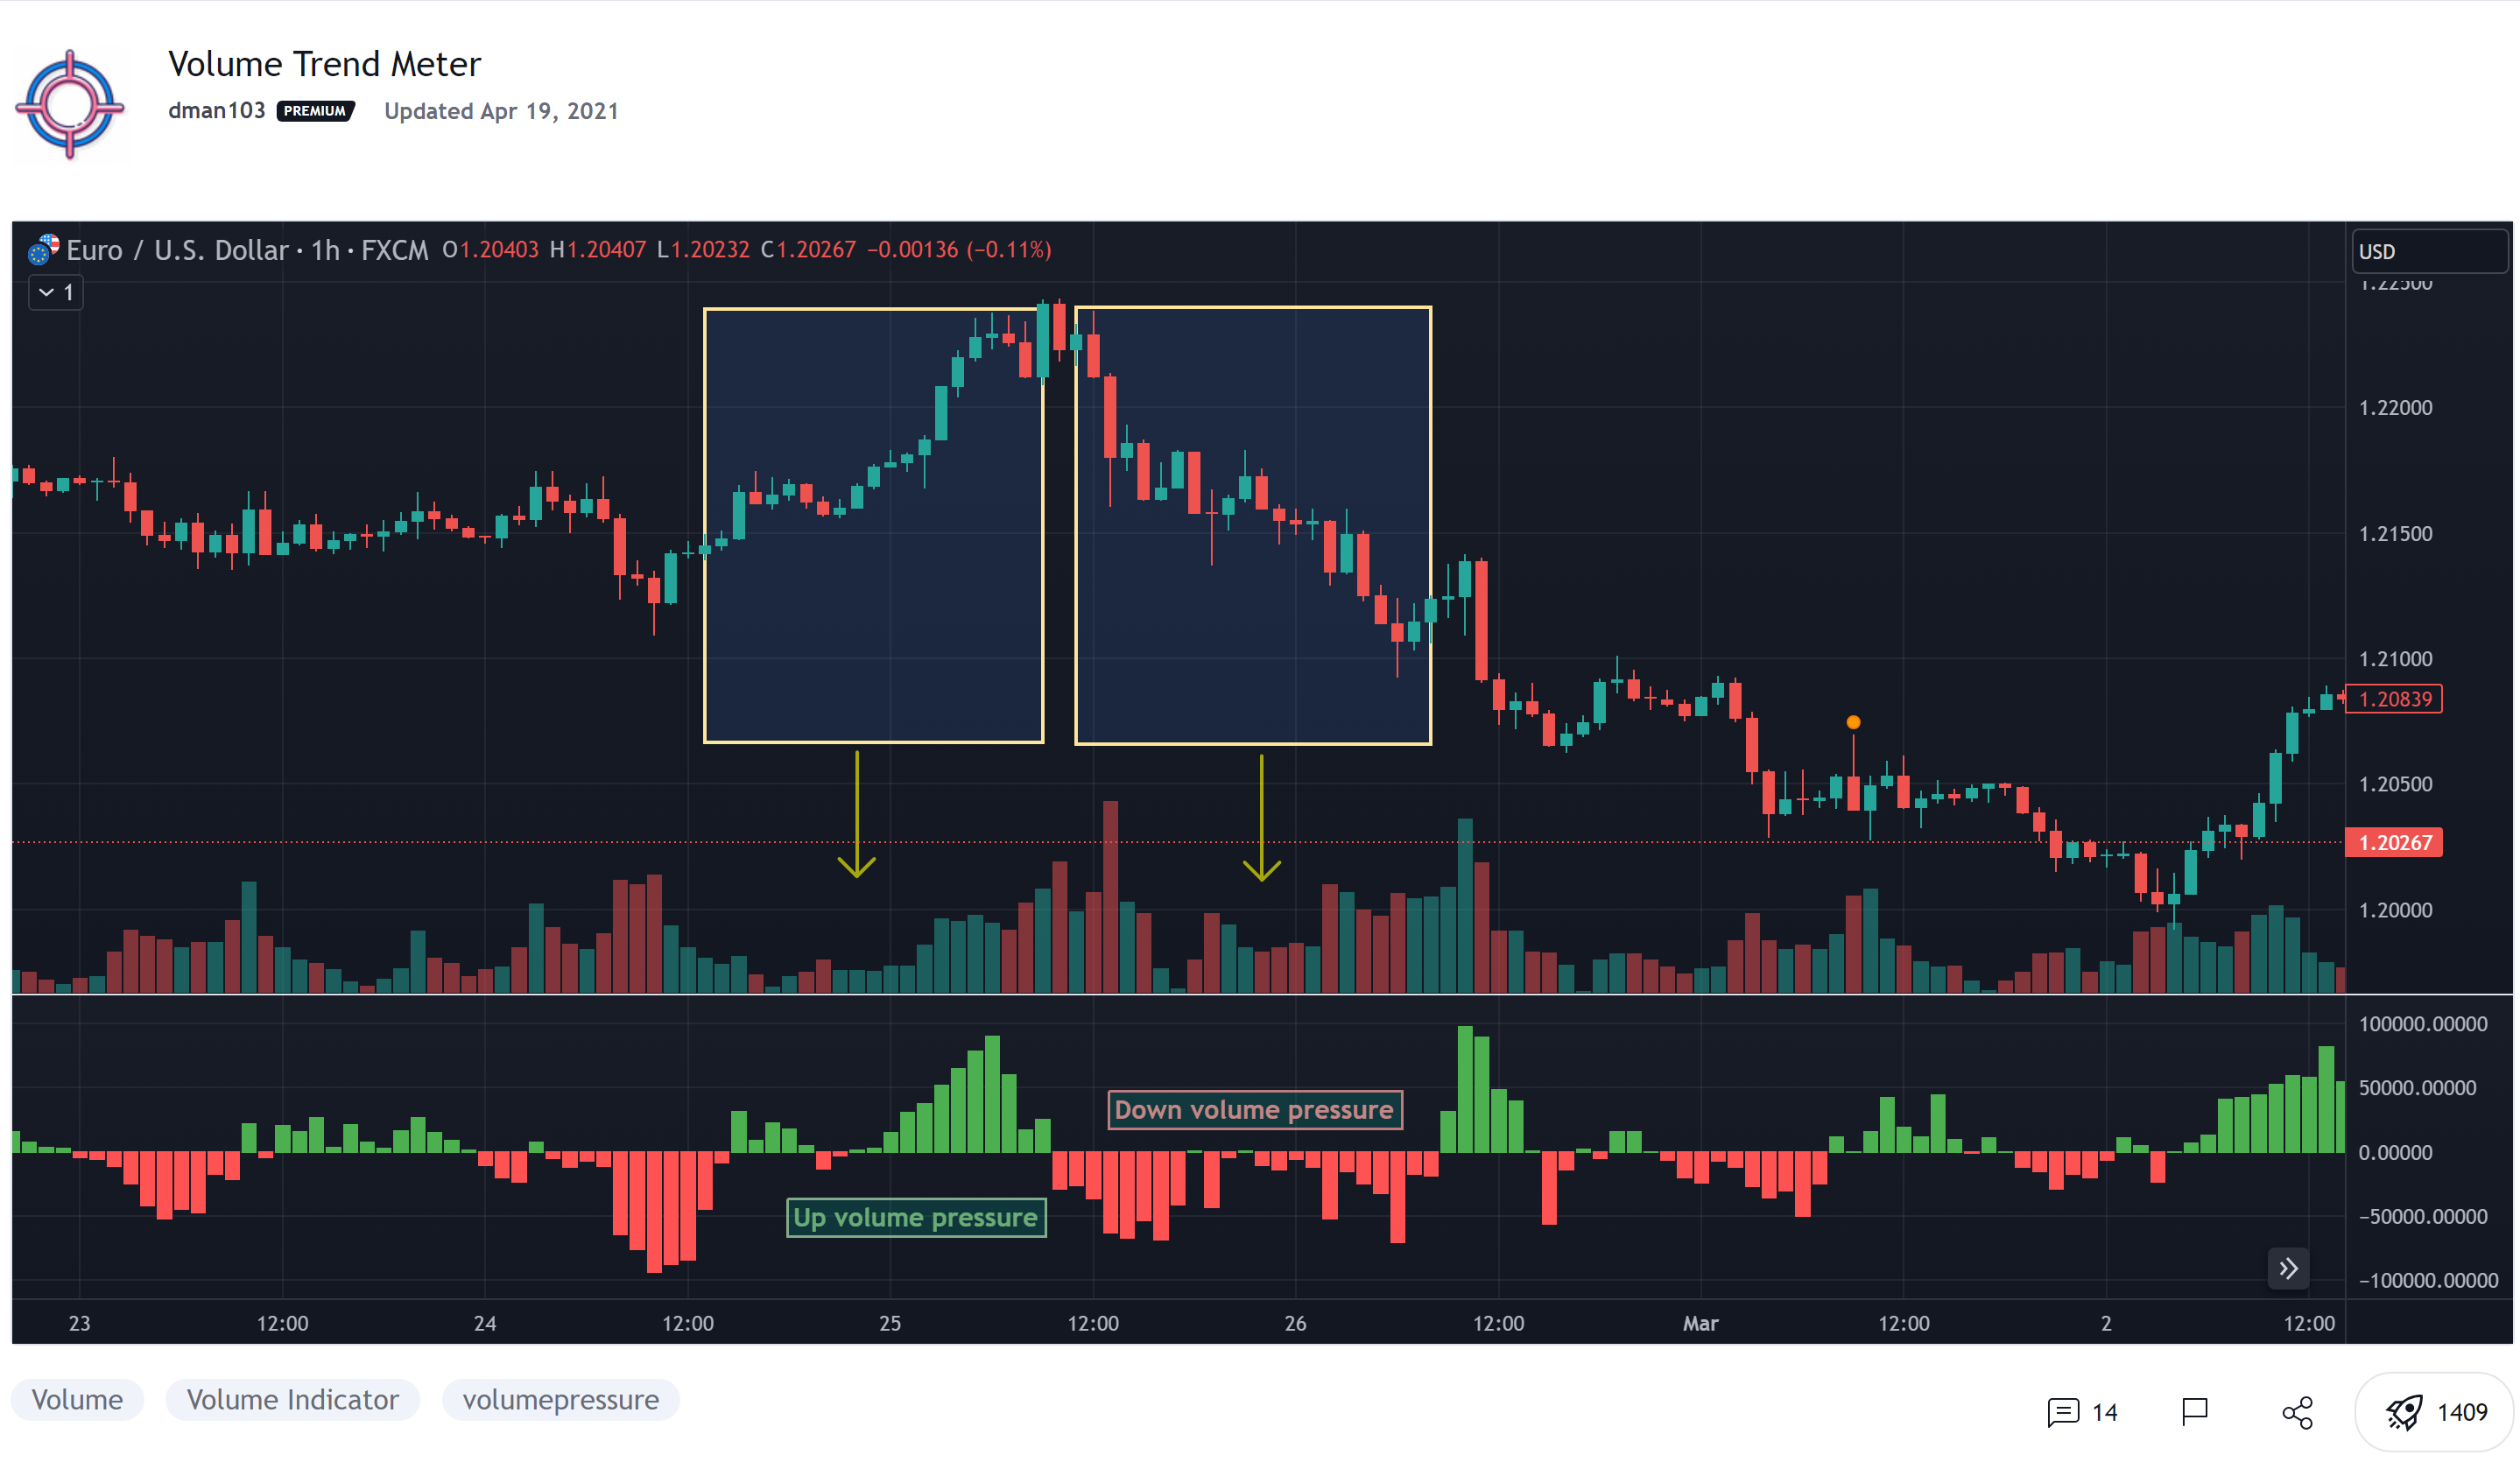
I was seeing if anybody could convert this to ThinkorSwim
Volume Trend Meter - Trading View
https://www.tradingview.com/script/ywEEvEtI-Volume-Trend-Meter/

Is this possible to be converted to thinkorswim?
Author states:
The indicator sums up all green candles volume and red candles volumes over a specific period of bars (you set in settings) and plots their values.
Use this indicator to identify increasing volume with the green candles (close higher than open) and increasing volume of the red candles (close is lower than open).

======= Calculation ==========
For Green Column: Total volume of green candles is higher than total red candles volume.
For Red Column: Total volume of red candles is higher than total green candles volume.
DvrmnuS.png


find below. I added price and volume trend meter along with MTF option

CSS:
#// This work is licensed under a Creative Commons Attribution-ShareAlike 4.0 International License https:/
#// © dman103
#// Sweet little indicator which measures volume pressure over a specific period of time.
#// The indicator sums up all green candles volume and red candles volumes over a specific period of bars (you set in settings) and plots their values.
#// Use this indicator to identify increasing volume with the green candles (close bigger than open) and increasing volume of the red candles (close is smaller than open).
#study("Price/Volume Trend Meter","PVTM",overlay=false)
# Converted by Sam4Cok@Samer800     - 02/2024
Declare Lower;

input useChartTimeframe = yes;
input customTimeframe = AggregationPeriod.FIFTEEN_MIN;
input source = FundamentalType.CLOSE;
input PreviousBarsToCheck = 9;
input PositiveValuesOnly = no;
input calculationType = {Default "Volume Trend", "Price Trend"};

def na = Double.NaN;
def last = isNaN(close);
def tf = GetAggregationPeriod();
def v = volume(Period = if useChartTimeframe then tf else customTimeframe);
def o = open(Period = if useChartTimeframe then tf else customTimeframe);
def c = Fundamental(FundamentalType = source, Period = if useChartTimeframe then tf else customTimeframe);
def vol = calculationType==calculationType."Volume Trend";
def src = calculationType==calculationType."Price Trend";

def up = c > o;
def vol_up = sum(if up then v else 0, PreviousBarsToCheck);
def vol_dn = sum(if up then 0 else v, PreviousBarsToCheck);
def src_up = sum(if up then c else 0, PreviousBarsToCheck);
def src_dn = sum(if up then 0 else c, PreviousBarsToCheck);

def total_up_dn_vol = (vol_up - vol_dn);
def total_up_dn_src = (src_up - src_dn);

def col = if total_up_dn_src>0 and total_up_dn_vol>0 then  2 else
          if total_up_dn_src<0 and total_up_dn_vol<0 then -2 else
          if (col[1]== 2 or col[1]== 1) then  1 else
          if (col[1]==-2 or col[1]==-1) then -1 else 0;

plot volHist = if !vol or last then na else
               if PositiveValuesOnly then AbsValue(total_up_dn_vol) else total_up_dn_vol;
volHist.SetPaintingStrategy(PaintingStrategy.SQUARED_HISTOGRAM);
volHist.AssignValueColor(if col== 2 then Color.GREEN else
                         if col== 1 then Color.DARK_GREEN else
                         if col==-2 then Color.RED else
                         if col==-1 then Color.DARK_RED else Color.RED);

plot priceHist = if !src or last then na else
                 if PositiveValuesOnly then AbsValue(total_up_dn_src) else total_up_dn_src;
priceHist.SetPaintingStrategy(PaintingStrategy.SQUARED_HISTOGRAM);
priceHist.AssignValueColor(if col== 2 then Color.GREEN else
                         if col== 1 then Color.DARK_GREEN else
                         if col==-2 then Color.RED else
                         if col==-1 then Color.DARK_RED else Color.RED);


#-- END of CODE
 
Last edited by a moderator:
Author states:
The indicator sums up all green candles volume and red candles volumes over a specific period of bars (you set in settings) and plots their values.
Use this indicator to identify increasing volume with the green candles (close higher than open) and increasing volume of the red candles (close is lower than open).

======= Calculation ==========
For Green Column: Total volume of green candles is higher than total red candles volume.
For Red Column: Total volume of red candles is higher than total green candles volume.
DvrmnuS.png


find below. I added price and volume trend meter along with MTF option

CSS:
#// This work is licensed under a Creative Commons Attribution-ShareAlike 4.0 International License https:/
#// © dman103
#// Sweet little indicator which measures volume pressure over a specific period of time.
#// The indicator sums up all green candles volume and red candles volumes over a specific period of bars (you set in settings) and plots their values.
#// Use this indicator to identify increasing volume with the green candles (close bigger than open) and increasing volume of the red candles (close is smaller than open).
#study("Price/Volume Trend Meter","PVTM",overlay=false)
# Converted by Sam4Cok@Samer800     - 02/2024
Declare Lower;

input useChartTimeframe = yes;
input customTimeframe = AggregationPeriod.FIFTEEN_MIN;
input source = FundamentalType.CLOSE;
input PreviousBarsToCheck = 9;
input PositiveValuesOnly = no;
input calculationType = {Default "Volume Trend", "Price Trend"};

def na = Double.NaN;
def last = isNaN(close);
def tf = GetAggregationPeriod();
def v = volume(Period = if useChartTimeframe then tf else customTimeframe);
def o = open(Period = if useChartTimeframe then tf else customTimeframe);
def c = Fundamental(FundamentalType = source, Period = if useChartTimeframe then tf else customTimeframe);
def vol = calculationType==calculationType."Volume Trend";
def src = calculationType==calculationType."Price Trend";

def up = c > o;
def vol_up = sum(if up then v else 0, PreviousBarsToCheck);
def vol_dn = sum(if up then 0 else v, PreviousBarsToCheck);
def src_up = sum(if up then c else 0, PreviousBarsToCheck);
def src_dn = sum(if up then 0 else c, PreviousBarsToCheck);

def total_up_dn_vol = (vol_up - vol_dn);
def total_up_dn_src = (src_up - src_dn);

def col = if total_up_dn_src>0 and total_up_dn_vol>0 then  2 else
          if total_up_dn_src<0 and total_up_dn_vol<0 then -2 else
          if (col[1]== 2 or col[1]== 1) then  1 else
          if (col[1]==-2 or col[1]==-1) then -1 else 0;

plot volHist = if !vol or last then na else
               if PositiveValuesOnly then AbsValue(total_up_dn_vol) else total_up_dn_vol;
volHist.SetPaintingStrategy(PaintingStrategy.SQUARED_HISTOGRAM);
volHist.AssignValueColor(if col== 2 then Color.GREEN else
                         if col== 1 then Color.DARK_GREEN else
                         if col==-2 then Color.RED else
                         if col==-1 then Color.DARK_RED else Color.RED);

plot priceHist = if !src or last then na else
                 if PositiveValuesOnly then AbsValue(total_up_dn_src) else total_up_dn_src;
priceHist.SetPaintingStrategy(PaintingStrategy.SQUARED_HISTOGRAM);
priceHist.AssignValueColor(if col== 2 then Color.GREEN else
                         if col== 1 then Color.DARK_GREEN else
                         if col==-2 then Color.RED else
                         if col==-1 then Color.DARK_RED else Color.RED);


#-- END of CODE

You're awesome! Thanks @samer800!
 
What's the proper way to interpret the Dev Increase and Dev Decrease, what does this mean, and what action would someone take when these bars occur?
 
What's the proper way to interpret the Dev Increase and Dev Decrease, what does this mean, and what action would someone take when these bars occur?
Please provide the script that you are referring to.
A quick perusal of the 9 pages of this thread, did not locate the use of the variables that you are referencing.
Perhaps you are looking at a different thread?
 
Last edited:
Hello All,

Can anyone please help me with a script that shows the up/down volume ratio as histogram bars? I would like to use it on any aggregation period.

Thank you
 
Chris's Enhanced Volume For ThinkOrSwim
Buy / Sell Volume Pressure Percentages

View attachment 913
Buyers and Sellers is not information available in the data feeds.
When we look at the movement of price in comparison to volume, it is called Volume Pressure.
The scripts discussed here are representative of the PRICE spread compared to the overall volume spread.

We create a percentage for buying and selling pressure by using the candlestick patterns weighted volume.
Volume Pressure identifies the price movement which when aggregated with volume it is used to define MOMENTUM not actual buyers and sellers.
You can't apply the momentum percentage to the volume number and declare that to be the number of buyers and sellers.
View attachment 11814View attachment 11815
Ruby:
#Chris' Enhanced Volume V.2 /w Uptick/Downtick

declare on_volume;

###############
#DPL CRITERIA #
###############
input Audible_Alert = yes;
def Deviation_Length = 60;
def Deviate = 2;
def volumestdev = RelativeVolumeStDev(length = Deviation_Length);
def abovedev = volumestdev >= Deviate;
def belowdev = volumestdev <= Deviate;

############
# DPL BARS #
############
def increase = volume > volume[1];
def devincrease = increase and abovedev;
def decrease = volume < volume[1];
def devdecrease = decrease and abovedev;

##############################
# UPTICK / DOWNTICK CRITERIA #
##############################
def O = open;
def H = high;
def C = close;
def L = low;
def V = volume;
def Buying = V * (C - L) / (H - L);
def Selling = V * (H - C) / (H - L);

##################
# Selling Volume #
##################
plot SV = Selling;
SV.DefineColor("Decrease", Color.rED);
SV.DefineColor("DevDecrease", Color.pink);
SV.AssignValueColor(if devdecrease then SV.Color("DevDecrease") else SV.Color("Decrease"));
SV.SetPaintingStrategy(PaintingStrategy.HISTOGRAM);
SV.HideTitle();
SV.HideBubble();
SV.SetLineWeight(5);

#################
# Buying Volume #
#################
DefineGlobalColor("LabelGreen",  CreateColor(0, 165, 0)) ;
plot BV = Buying;
BV.DefineColor("Increase", GlobalColor("LabelGreen"));
BV.DefineColor("DevIncrease", Color.light_GREEN);
BV.AssignValueColor(if devincrease then BV.Color("DevIncrease") else BV.Color("Increase"));
BV.SetPaintingStrategy(PaintingStrategy.HISTOGRAM);
BV.HideTitle();
BV.HideBubble();
BV.SetLineWeight(5);

#################
# Adding Volume Labels #
#################

input Show_Labels = yes;
AddLabel(Show_Labels, "Buy Vol = " + Round(Buying, 0),
if Buying > Selling then GlobalColor("LabelGreen") else color.red);

AddLabel(Show_Labels, "Buy %: " + Round((Buying/(Buying+Selling))*100,2), If (Buying/(Buying+Selling))*100 > 60 then GlobalColor("LabelGreen") else color.red);

AddLabel(Show_Labels, "Sell Vol = " + Round(Selling, 0),
if Selling > Buying then GlobalColor("LabelGreen") else color.red);

AddLabel(Show_Labels, "Sell %: " + Round((Selling/(Selling+Buying))*100,2), If (Selling/(Selling+Buying))*100 > 60 then GlobalColor("LabelGreen") else color.RED);

Buy / Sell Volume Pressure w/ volumes and percentages -- Upper Study Labels Only
Ruby:
#Chris' Enhanced Volume V.2 /w Uptick/Downtick LABELS ONLY

declare upper;
###############
#DPL CRITERIA #
###############
def Deviation_Length = 60;
def Deviate = 2;
def volumestdev = RelativeVolumeStDev(length = Deviation_Length);
def abovedev = volumestdev >= Deviate;
def belowdev = volumestdev <= Deviate;

############
# DPL BARS #
############
def increase = volume > volume[1];
def devincrease = increase and abovedev;
def decrease = volume < volume[1];
def devdecrease = decrease and abovedev;

##############################
# UPTICK / DOWNTICK CRITERIA #
##############################
def O = open;
def H = high;
def C = close;
def L = low;
def V = volume;
def Buying = V * (C - L) / (H - L);
def Selling = V * (H - C) / (H - L);

##################
# Selling Volume #
##################
def SV = Selling;
def BV = Buying;

#################
# Adding Volume Labels #
#################
DefineGlobalColor("LabelGreen",  CreateColor(0, 165, 0)) ;
input Show_Labels = yes;
AddLabel(Show_Labels, "Buy Vol = " + Round(Buying, 0),
if Buying > Selling then GlobalColor("LabelGreen") else color.red);

AddLabel(Show_Labels, "Buy %: " + Round((Buying/(Buying+Selling))*100,2), If (Buying/(Buying+Selling))*100 > 60 then GlobalColor("LabelGreen") else color.red);

AddLabel(Show_Labels, "Sell Vol = " + Round(Selling, 0),
if Selling > Buying then GlobalColor("LabelGreen") else color.red);

AddLabel(Show_Labels, "Sell %: " + Round((Selling/(Selling+Buying))*100,2), If (Selling/(Selling+Buying))*100 > 60 then GlobalColor("LabelGreen") else color.RED);
Don't know why but - these don't show on my chart...
 
Don't know why but - these don't show on my chart...
You didn't provide enough information to say where you went astray.
By default, ToS puts volume charts on the volume subgraph line.
But if you have "show volume subgraph line" unclicked in settings, no volume chart will show.

So, first make sure that you have dragged this volume study to a lower chart subgraph
hJ7kphf.png


If that does not resolve the issue, here is a chart with the indicator already applied:
shared chart link: http://tos.mx/!Hsl2cJZz Click here for --> Easiest way to load shared links
Importing the above link, will provide you a working indicator on a working chart.
gm4SAwd.png
 
Last edited:
Hi all,

I have this daily buy/sell pressure volume percentage label that seems to be pretty accurate with the daily moves.

AddLabel(1, GetSymbol(), Color.white);

input ShowTodayVolume = yes;
input Show30DayAvg = yes;
input ShowPercentOf30DayAvg = yes;
input UnusualVolumePercent = 200;

def O = open;
def H = high;
def C = close;
def L = low;
def V = volume;

input agg = AggregationPeriod.DAY;
def v1 = volume(period = agg);
def h1 = high(period = agg);
def o1 = open(period = agg);
def c1 = close(period = agg);
def l1 = low(period = agg);

def buyvol1 = Round(((h1 - o1 + (c1 - l1)) / 2 / (h1 - l1)) * v1, 0);
def sellvol1 = Round(((l1 - o1) + (c1 - h1)) / 2 / (h1 - l1) * v1, 0);
def buyvolper = buyvol1 / v1 * 100;
def sellvolper = AbsValue(sellvol1) / v1 * 100;

#Volume Data#

def AggDay = AggregationPeriod.DAY;
def DayVol = volume(period = AggDay);

def VolLast30DayAvg = (DayVol[1] + DayVol[2] + DayVol[3] + DayVol[4] + DayVol[5] + DayVol[6]
  • DayVol[7] + DayVol[8] + DayVol[9] + DayVol[10] + DayVol[11] + DayVol[12] + DayVol[13]
  • DayVol[14] + DayVol[15] + DayVol[16] + DayVol[17] + DayVol[18] + DayVol[19] + DayVol[20]
  • DayVol[21] + DayVol[22] + DayVol[23] + DayVol[24] + DayVol[25] + DayVol[26] + DayVol[27]
  • DayVol[28] + DayVol[29] + DayVol[30]) / 30;

def PercentOf30Day = Round((DayVol / VolLast30DayAvg) * 100, 0);

def Avg30Bars = (V[1] + V[2] + V[3] + V[4] + V[5] + V[6] + V[7] + V[8] + V[9] + V[10] + V[11]
  • V[12] + V[13] + V[14] + V[15] + V[16] + V[17] + V[18] + V[19] + V[20] + V[21] + V[22] + V[23]
  • V[24] + V[25] + V[26] + V[27] + V[28] + V[29] + V[30]) / 30;

def PercentOf30Bar = Round((V / Avg30Bars) * 100, 0);

#Labels#

AddLabel(1, ".", Color.DARK_GRAY);

AddLabel(Show30DayAvg, "30D: " + Round(volLast30DayAvg, 0), Color.GRAY);

#AddLabel(1, ".", Color.DARK_GRAY);

AddLabel(ShowTodayVolume, "Today " + DayVol, (if PercentOf30Day >= UnusualVolumePercent
then Color.GREEN else if PercentOf30Day >= 100 then Color.ORANGE else Color.LIGHT_GRAY));

#AddLabel(1, ".", Color.DARK_GRAY);

AddLabel(ShowPercentOf30DayAvg, "RV%: " + percentOf30Day, (if percentOf30Day >= UnusualVolumePercent then Color.DARK_GREEN else if percentOf30Day >= 100 then Color.GREEN else Color.RED));

AddLabel(1, ".", Color.DARK_GRAY);

#AddLabel(yes, "Buy Volume: " + buyvol1, Color.GREEN);
#AddLabel(yes, "BVP%: " + Round(buyvolper), Color.GREEN);

AddLabel(yes, "Buy Volume: " + AbsValue(buyvol1), if buyvolper > 50 then Color.Green else Color.gray);
AddLabel(yes, "BVP%: " + Round(buyvolper), if buyvolper > 50 then Color.Green else Color.gray);

#AddLabel(1, "|", Color.DARK_GRAY);

AddLabel(yes, "Sell Volume: " + AbsValue(sellvol1), if sellvolper < 50 then Color.GRAY else Color.RED);
AddLabel(yes, "SVP%: " + Round(sellvolper), if sellvolper < 50 then Color.GRAY else Color.RED);

Looking to see if someone can help me out here and maybe in a very creative way, show some sort of lower study visual on the buy vs sell histogram, or percentage line, or something unique to show the buy or sell volume percentage.

I'd love to see the percentage as the day progresses compared to each candle of price action.

And just for visual purposes, see the Buying Volume Pressure... it's been above 80%, and climbing to 90%+ since 10 am but no way to see this or can you tell by the regular volume buy/sell lower study.

Capture.PNG


Have tried it myself and have failed, miserably. :-|

Thanks in advance.
 
Last edited:
OK so I found something that could work...

I modified this study --> https://usethinkscript.com/threads/premarket-volume-pressure-indicator.14031/post-116641

To 9:30 - 16:15 to show buy and sell, and this is what I get (now I'm not sure if the calculations are the same or not) See lower study.

Capture.PNG


I'd love to be able to do some sort of a line to show percentage of buy vs cell in a lower line chart, but I can't figure out how to add it to my study. Where the buy line vs sell line will always equal 100%. In this case you can see that the calculations are different and they don't add up to 100% (looking at the far right of the chart).
 
Last edited:
Hi all,

I have this daily buy/sell pressure volume percentage label that seems to be pretty accurate with the daily moves.


Looking to see if someone can help me out here and maybe in a very creative way, show some sort of lower study visual on the buy vs sell histogram, or percentage line, or something unique to show the buy or sell volume percentage.

I'd love to see the percentage as the day progresses compared to each candle of price action.

And just for visual purposes, see the Buying Volume Pressure... it's been above 80%, and climbing to 90%+ since 10 am but no way to see this or can you tell by the regular volume buy/sell lower study.


Have tried it myself and have failed, miserably. :-|

Thanks in advance.

#where is the code for your lower line?

maybe this is what you are after?
notes in the code

Code:
#volume_buy_sell2

#https://usethinkscript.com/threads/buy-sell-lines.19001/
#Buy Sell % Lines

#there is no buy/sell volume data in thinkscript. it is approximated with these formuls. (from the referenced code)
#def buying = V*(C-L)/(H-L);
#def selling = V*(H-C)/(H-L);

declare lower;

def o = open;
def h = high;
def l = low;
def c = close;

#they calculate a percent of the bar x volume.  so that is your percent, your ratio. if you want a percent, then just remove volume.
def buying = (C-L)/(H-L);
def selling = (H-C)/(H-L);

#then use them to plot 2 histograms, one positive, one negative.
plot histbuy = buying;
histbuy.SetPaintingStrategy(PaintingStrategy.HISTOGRAM);
#histbuy.SetPaintingStrategy(PaintingStrategy.ARROW_UP);
histbuy.SetDefaultColor(Color.green);
histbuy.setlineweight(3);
histbuy.hidebubble();

plot histsell = -selling;
histsell.SetPaintingStrategy(PaintingStrategy.HISTOGRAM);
#histsell.SetPaintingStrategy(PaintingStrategy.ARROW_DOWN);
histsell.SetDefaultColor(Color.red);
histsell.setlineweight(3);
histsell.hidebubble();
#
 

Attachments

  • img1.JPG
    img1.JPG
    59.9 KB · Views: 117
#where is the code for your lower line?

maybe this is what you are after?
notes in the code

Code:
#volume_buy_sell2

#https://usethinkscript.com/threads/buy-sell-lines.19001/
#Buy Sell % Lines

#there is no buy/sell volume data in thinkscript. it is approximated with these formuls. (from the referenced code)
#def buying = V*(C-L)/(H-L);
#def selling = V*(H-C)/(H-L);

declare lower;

def o = open;
def h = high;
def l = low;
def c = close;

#they calculate a percent of the bar x volume.  so that is your percent, your ratio. if you want a percent, then just remove volume.
def buying = (C-L)/(H-L);
def selling = (H-C)/(H-L);

#then use them to plot 2 histograms, one positive, one negative.
plot histbuy = buying;
histbuy.SetPaintingStrategy(PaintingStrategy.HISTOGRAM);
#histbuy.SetPaintingStrategy(PaintingStrategy.ARROW_UP);
histbuy.SetDefaultColor(Color.green);
histbuy.setlineweight(3);
histbuy.hidebubble();

plot histsell = -selling;
histsell.SetPaintingStrategy(PaintingStrategy.HISTOGRAM);
#histsell.SetPaintingStrategy(PaintingStrategy.ARROW_DOWN);
histsell.SetDefaultColor(Color.red);
histsell.setlineweight(3);
histsell.hidebubble();
#

I modified this study for lower lines --> https://usethinkscript.com/threads/premarket-volume-pressure-indicator.14031/post-116641

The histogram doesn't reflect what I'm looking for.
Yesterday for example, the buy % was basically at 70% and climbing all day... matching the days price action.

Instead of a histogram, is it possible to plot lines - green for buy % and red for sell %?
Basically always adding up to 100%?

This way the green line will show continues increase in buy % as the day progresses and the sell % will show continues decrease.

I hope this makes sense.
 
OK so I added the last 2 lines to the code to plot the buy and sell volume precentages;

def buyvol1 = Round(((h1 - o1 + (c1 - l1)) / 2 / (h1 - l1)) * v1, 0);
def sellvol1 = Round(((l1 - o1) + (c1 - h1)) / 2 / (h1 - l1) * v1, 0);
def buyvolper = AbsValue(buyvol1) / v1 * 100;
def sellvolper = AbsValue(sellvol1) / v1 * 100;
plot buyvol = Round(buyvolper);
plot sellvol = Round(sellvolper);


But now this is what I get... just plots the current percentage and not the percentage throughout the day.

Capture.PNG


I know I'm missing something, probably simple to actually plot the percentage as the day goes on.

Just wondering if anyone can help out with this…

I know @samer800 can knock this out in a few mins. 😉

Asking for a friend!
 
Last edited by a moderator:
# plot percentage of buy / sell volume pressure
ArpNO7r.png


Ruby:
# plot percentage of buy / sell volume pressure
def buyvol = Round(((high - open + (close - low)) / 2 / (high - low)) * volume, 0);
def sellvol = Round(((low - open) + (close - high)) / 2 / (high - low) * volume, 0);
def buyvolper = AbsValue(buyvol) / volume * 100;
def sellvolper = AbsValue(sellvol) / volume * 100;

declare lower;
plot pbuyvol = Round(buyvolper,2);
plot psellvol = Round(sellvolper,2);
addcloud(pbuyvol,psellvol,color.dark_green, color.dark_red);

@PT_Scalper
 
Can someone make this work with tick charts?

input agg = AggregationPeriod.DAY;
def v = volume(period = agg);
def h = high(period = agg);
def o = open(period = agg);
def c = close(period = agg);
def l = low(period = agg);
def buyvol = Round(((h - o + (c - l)) / 2 / (h - l)) * v, 0);
def sellvol = Round(((l - o) + (c - h)) / 2 / (h - l) * v, 0);
def buyvolper = buyvol / v * 100;
def sellvolper = AbsValue(sellvol) / v * 100;


AddLabel(yes, "Buy Volume: " + buyvol, Color.GREEN);
AddLabel(yes, "Sell Volume: " + AbsValue(sellvol), Color.RED);
 
@JDS
Scripts referencing time cannot work on tick or renko charts as there is no time axis.

Taking out the timeframe references should allow your script to work on tick charts.

Ruby:
def v = volume;
def h = high;
def o = open;
def c = close;
def l = low;
def buyvol = Round(((h - o + (c - l)) / 2 / (h - l)) * v, 0);
def sellvol = Round(((l - o) + (c - h)) / 2 / (h - l) * v, 0);
def buyvolper = buyvol / v * 100;
def sellvolper = AbsValue(sellvol) / v * 100;


AddLabel(yes, "Buy Volume: " + buyvol, Color.GREEN);
AddLabel(yes, "Sell Volume: " + AbsValue(sellvol), Color.RED);
Thank You!!! Just what I was looking for.
 

Join useThinkScript to post your question to a community of 21,000+ developers and traders.

Similar threads

Not the exact question you're looking for?

Start a new thread and receive assistance from our community.

87k+ Posts
223 Online
Create Post

Similar threads

Similar threads

The Market Trading Game Changer

Join 2,500+ subscribers inside the useThinkScript VIP Membership Club
  • Exclusive indicators
  • Proven strategies & setups
  • Private Discord community
  • ‘Buy The Dip’ signal alerts
  • Exclusive members-only content
  • Add-ons and resources
  • 1 full year of unlimited support

Frequently Asked Questions

What is useThinkScript?

useThinkScript is the #1 community of stock market investors using indicators and other tools to power their trading strategies. Traders of all skill levels use our forums to learn about scripting and indicators, help each other, and discover new ways to gain an edge in the markets.

How do I get started?

We get it. Our forum can be intimidating, if not overwhelming. With thousands of topics, tens of thousands of posts, our community has created an incredibly deep knowledge base for stock traders. No one can ever exhaust every resource provided on our site.

If you are new, or just looking for guidance, here are some helpful links to get you started.

What are the benefits of VIP Membership?
VIP members get exclusive access to these proven and tested premium indicators: Buy the Dip, Advanced Market Moves 2.0, Take Profit, and Volatility Trading Range. In addition, VIP members get access to over 50 VIP-only custom indicators, add-ons, and strategies, private VIP-only forums, private Discord channel to discuss trades and strategies in real-time, customer support, trade alerts, and much more. Learn all about VIP membership here.
How can I access the premium indicators?
To access the premium indicators, which are plug and play ready, sign up for VIP membership here.
Back
Top