UPDATE: 9/30/24 new indicators! new chart!
This is a new update I am using for all time frames. You can continue to use the old setup (see post below) or this new one if you prefer. I am using the new one on all time frames.
Chart Link: AGAIF BestTradingChartSetup 9-30-24
http://tos.mx/!ayok5Szv
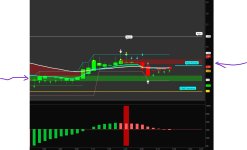
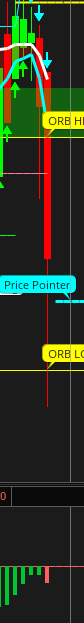
Chart Look:
Here is some further narration.
AGAIG Best Trading Chart Setup Update
I have added a couple of things to this chart. Added is the 9:55 “Time To Trade Heads Up” (30 min ORB coming to a finish and methinks the first two changes in direction may be the best trades of the day?) and I have also added a Revamped Oscillator showing on Lower and Overlaid on my Lowered Squared Histogram. The Histogram coordinates with the upper Long/Short Bubbles and the Oscillator shows previous candle movement as well as current candle movement. I will usually enter a trade when the Red/Green Heikin Ashi Candle first shows and is corroborated by my Long/Short Bubble and/or another change in direction indicator.
Heikin Candles Overview
Let’s review Heikin Candles so as to better understand them.
A Green Candle is Bullish. It should be Flat on the bottom with wick protruding up from top of candle. The wick shows continuing direction movement. As the Candle moves up you would like for each candle to be larger and close above previous candle (acceleration is body growing in length). If you start getting a wick showing on the bottom as well as top momentum may be slowing and may be signaling a change in direction (also probable change if showing candle shrinking in size as well as closing below last candle). A candle with wicks protruding evenly both sides is most likely a change in direction.
A Red Candle is Bearish. It should be Flat on Top with wick protruding down from bottom of candle. The wick shows continuing direction movement. As the Candle moves down you would like for each candle to be larger and close below previous candle (acceleration is body growing in length). If you start getting a wick showing on the top as well as bottom momentum may be slowing and may be signaling a change in direction (also probable change if showing candle shrinking in size and closing above last candle). A candle with wicks protruding evenly both sides is most likely a change in direction.