Repaints AGAIG Best Trading Chart Setup For ThinkOrSwim

Repaints
The candle color. They don't match what I have selected in Settings:Appearance. The lower study does.
 

Attachments

  • Candles.PNG
    Candles.PNG
    8.1 KB · Views: 107
The candle color. They don't match what I have selected in Settings:Appearance. The lower study does.
Try replacing this code: #shared_shared_AsGood_T#TM_TrendCandles_2Color7
with the following:
Code:
#shared_shared_AsGood_T#TM_TrendCandles_2Color7

input price = close;
input length = 20;

def K = (Highest(high, length) + Lowest(low, length)) / 2 + ExpAverage(close, length);
def momo = Inertia(price - K / 2, length);

def pos         = momo >= 0;
def neg         = momo < 0;
def up         = momo >= momo[1];
def dn         = momo < momo[1];

def PosUp = pos and up;
def PosDn = pos and dn;
def NegDn = neg and dn;
def NegUp = neg and up;

DefineGlobalColor("Up", Color.UPTICK);
DefineGlobalColor("Down", Color.DOWNTICK);
AssignPriceColor( if neg and up then GlobalColor("Up") else if PosDn then GlobalColor("Down") else if NegDn then GlobalColor("Down") else if NegUp then GlobalColor("Up") else GlobalColor("Up"));
 
Hi, Thanks for beautiful script. May I know what are these highlighted number 1, 2 and 3 in screenshot?
 

Attachments

  • ScreenshotOct10.jpg
    ScreenshotOct10.jpg
    194.1 KB · Views: 203
Hi, Thanks for beautiful script. May I know what are these highlighted number 1, 2 and 3 in screenshot?
Put your pointer on the area in (or line) in question, right-click and it should tell you what is being highlighted (it looks like the line is making a change in direction?)
 
No stop orders for day trades... I'm familiar with your trading style.. Looks like the strategy is built for swing trading.

Also, what are you using to confirm your trades.. Any successes?
I use changes in direction to exit trades...two, or more, indicators in agreement
 
Indications for change in direction I.e. candle change in color, long/short bubbles, pivot points, traffic light, oscillator on lower, MTF alignment, etc when two, or more, suggest a change (but remember there is no holy grail). If new to this paper trade until you get a handle on it. Everything you need is available on this chart. I have been suggesting that the two best trades are the first two changes in direction after ORB (opening range breakout) around 10:00 a.m. when the market settles a bit!
Hello, I have been using open range for options trading daily.....I am interested in this script, but I can not seem to be able to see anything when I attempt to load it......is there a way that i can get the script so that I can cut and past it? I also would love some help with creating what I think would be a simple script, which would be to plot the daily high and low of the 9:08 to 9:24 time frame each day. I would like to add this to my open range script......thank you
 
Hello, I have been using open range for options trading daily.....I am interested in this script, but I can not seem to be able to see anything when I attempt to load it......is there a way that i can get the script so that I can cut and past it? I also would love some help with creating what I think would be a simple script, which would be to plot the daily high and low of the 9:08 to 9:24 time frame each day. I would like to add this to my open range script......thank you

The chart setup contains a multitude of scripts. Not just a single script to be copy and pasted.

You did not provide enough information to say where you went astray.

To add this chart set-up to your ToS app,
you MUST follow these instructions when loading this link: http://tos.mx/!ayok5Szv
Please come back and report which step in the above instructions is causing you difficulty.
 
Last edited:
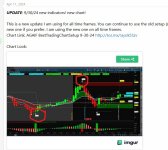
UPDATE: 9/30/24 new indicators! new chart!

This is a new update I am using for all time frames. You can continue to use the old setup (see post below) or this new one if you prefer. I am using the new one on all time frames.
Chart Link: AGAIF BestTradingChartSetup 9-30-24 http://tos.mx/!ayok5Szv

Chart Look:
Here is some further narration.

AGAIG Best Trading Chart Setup Update​

I have added a couple of things to this chart. Added is the 9:55 “Time To Trade Heads Up” (30 min ORB coming to a finish and methinks the first two changes in direction may be the best trades of the day?) and I have also added a Revamped Oscillator showing on Lower and Overlaid on my Lowered Squared Histogram. The Histogram coordinates with the upper Long/Short Bubbles and the Oscillator shows previous candle movement as well as current candle movement. I will usually enter a trade when the Red/Green Heikin Ashi Candle first shows and is corroborated by my Long/Short Bubble and/or another change in direction indicator.

Heikin Candles Overview​

Let’s review Heikin Candles so as to better understand them.

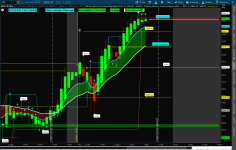
A Green Candle is Bullish. It should be Flat on the bottom with wick protruding up from top of candle. The wick shows continuing direction movement. As the Candle moves up you would like for each candle to be larger and close above previous candle (acceleration is body growing in length). If you start getting a wick showing on the bottom as well as top momentum may be slowing and may be signaling a change in direction (also probable change if showing candle shrinking in size as well as closing below last candle). A candle with wicks protruding evenly both sides is most likely a change in direction.

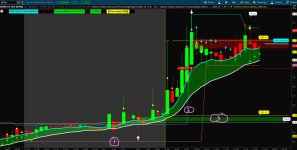
A Red Candle is Bearish. It should be Flat on Top with wick protruding down from bottom of candle. The wick shows continuing direction movement. As the Candle moves down you would like for each candle to be larger and close below previous candle (acceleration is body growing in length). If you start getting a wick showing on the top as well as bottom momentum may be slowing and may be signaling a change in direction (also probable change if showing candle shrinking in size and closing above last candle). A candle with wicks protruding evenly both sides is most likely a change in direction.
@csricksdds
Random question, why did you remove the other TTM colors? Thanks J
 
Last edited by a moderator:
UPDATE: 9/30/24 new indicators! new chart!

This is a new update I am using for all time frames. You can continue to use the old setup (see post below) or this new one if you prefer. I am using the new one on all time frames.
Chart Link: AGAIF BestTradingChartSetup 9-30-24 http://tos.mx/!ayok5Szv

Chart Look:
Here is some further narration.

AGAIG Best Trading Chart Setup Update​

I have added a couple of things to this chart. Added is the 9:55 “Time To Trade Heads Up” (30 min ORB coming to a finish and methinks the first two changes in direction may be the best trades of the day?) and I have also added a Revamped Oscillator showing on Lower and Overlaid on my Lowered Squared Histogram. The Histogram coordinates with the upper Long/Short Bubbles and the Oscillator shows previous candle movement as well as current candle movement. I will usually enter a trade when the Red/Green Heikin Ashi Candle first shows and is corroborated by my Long/Short Bubble and/or another change in direction indicator.

Heikin Candles Overview​

Let’s review Heikin Candles so as to better understand them.

A Green Candle is Bullish. It should be Flat on the bottom with wick protruding up from top of candle. The wick shows continuing direction movement. As the Candle moves up you would like for each candle to be larger and close above previous candle (acceleration is body growing in length). If you start getting a wick showing on the bottom as well as top momentum may be slowing and may be signaling a change in direction (also probable change if showing candle shrinking in size as well as closing below last candle). A candle with wicks protruding evenly both sides is most likely a change in direction.
A Red Candle is Bearish. It should be Flat on Top with wick protruding down from bottom of candle. The wick shows continuing direction movement. As the Candle moves down you would like for each candle to be larger and close below previous candle (acceleration is body growing in length). If you start getting a wick showing on the top as well as bottom momentum may be slowing and may be signaling a change in direction (also probable change if showing candle shrinking in size and closing above last candle). A candle with wicks protruding evenly both sides is most likely a change in direction.
@csricksdds
Great Chart! The description is very good too. I had success paper trading with it this morning on /ES futures in real time. Could you tell me what the white or yellow dots in the wick area of the bars mean? Do the colors have significance?
Thanks so much for making this!
 
Last edited by a moderator:
I have tried several charts in the past, but after reading the instructions and actually sticking with one stock for the past two days I have had only successful trades. I am cautious, so I take profit 10% after each Green overlay on the oscillator below. I will definitely be pinning this thread to wait for updates!
Thank you so much to the creator.
 
UPDATE: 9/30/24 new indicators! new chart!

This is a new update I am using for all time frames. You can continue to use the old setup (see post below) or this new one if you prefer. I am using the new one on all time frames.
Chart Link: AGAIF BestTradingChartSetup 9-30-24 http://tos.mx/!ayok5Szv

Chart Look:
Here is some further narration.

AGAIG Best Trading Chart Setup Update​

I have added a couple of things to this chart. Added is the 9:55 “Time To Trade Heads Up” (30 min ORB coming to a finish and methinks the first two changes in direction may be the best trades of the day?) and I have also added a Revamped Oscillator showing on Lower and Overlaid on my Lowered Squared Histogram. The Histogram coordinates with the upper Long/Short Bubbles and the Oscillator shows previous candle movement as well as current candle movement. I will usually enter a trade when the Red/Green Heikin Ashi Candle first shows and is corroborated by my Long/Short Bubble and/or another change in direction indicator.

Heikin Candles Overview​

Let’s review Heikin Candles so as to better understand them.

A Green Candle is Bullish. It should be Flat on the bottom with wick protruding up from top of candle. The wick shows continuing direction movement. As the Candle moves up you would like for each candle to be larger and close above previous candle (acceleration is body growing in length). If you start getting a wick showing on the bottom as well as top momentum may be slowing and may be signaling a change in direction (also probable change if showing candle shrinking in size as well as closing below last candle). A candle with wicks protruding evenly both sides is most likely a change in direction.
A Red Candle is Bearish. It should be Flat on Top with wick protruding down from bottom of candle. The wick shows continuing direction movement. As the Candle moves down you would like for each candle to be larger and close below previous candle (acceleration is body growing in length). If you start getting a wick showing on the top as well as bottom momentum may be slowing and may be signaling a change in direction (also probable change if showing candle shrinking in size and closing above last candle). A candle with wicks protruding evenly both sides is most likely a change in direction.
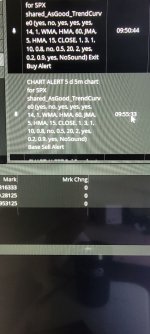
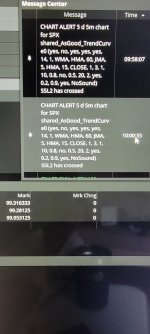
Question about the signals. ( Been using it for a while)
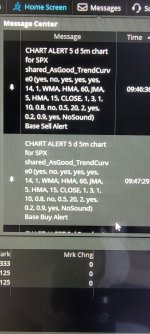
I get a signal ( 9:46) Message says Base sell alert. Then 9:47 message says Base buy alert. 9:50 Exit buy alert. Then 9:55 Base sell alert. Followed up by 9:58 SSL2 has crossed. And then 10:00 ssl2 has crossed. This was when the SPX was bottoming. Im guessing it was transitioning from a sell to a buy? Market dipped a bit moore before it took off. What confirmation should I have been looking / waiting for. Thanks for all you do. Mike See attached chart and messages
 

Attachments

  • 2024-11-21-TOS_CHARTS.png
    2024-11-21-TOS_CHARTS.png
    167.8 KB · Views: 77
  • 20241121_135121.jpg
    20241121_135121.jpg
    366.1 KB · Views: 77
  • 20241121_135207.jpg
    20241121_135207.jpg
    301.1 KB · Views: 62
  • 20241121_135212.jpg
    20241121_135212.jpg
    260.6 KB · Views: 76
Hi,
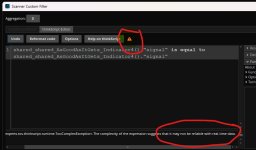
I am trying to create a scanner on daily basis using ......_indicator4(attached screenshot for complete study name), but it's giving error. Can you please help?

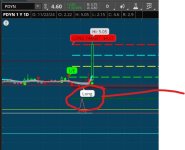
script I am using gives long and short signals, I wanted to create a scanner when long signal appears as per attached screenshot.

@csricksdds, I know it's complex to use scanner based on "Long" and "Short" , will it be possible to use it for daily scanner?
 

Attachments

  • Screenshot 2024-11-24 072150.jpg
    Screenshot 2024-11-24 072150.jpg
    57 KB · Views: 51
  • Screenshot 2024-11-24 080522_2.jpg
    Screenshot 2024-11-24 080522_2.jpg
    42.5 KB · Views: 46
  • 1.jpg
    1.jpg
    85.2 KB · Views: 43
Last edited by a moderator:
Hi,
I am trying to create a scanner on daily basis using ......_indicator4(attached screenshot for complete study name), but it's giving error. Can you please help?

script I am using gives long and short signals, I wanted to create a scanner when long signal appears as per attached screenshot.

@csricksdds, I know it's complex to use scanner based on "Long" and "Short" , will it be possible to use it for daily scanner?

Unfortunately, no.
The script is too complex to be used in the scanner.

While no script is "too complex" to plot on the chart; Schwab does throttle the use of complex scripts in scans, watchlists, and conditional orders to prevent high load runs on its servers.
 
UPDATE: 9/30/24 new indicators! new chart!

This is a new update I am using for all time frames. You can continue to use the old setup (see post below) or this new one if you prefer. I am using the new one on all time frames.
Chart Link: AGAIG BestTradingChartSetup 9-30-24 http://tos.mx/!ayok5Szv

Chart Look:
Here is some further narration.

AGAIG Best Trading Chart Setup Update​

I have added a couple of things to this chart. Added is the 9:55 “Time To Trade Heads Up” (30 min ORB coming to a finish and methinks the first two changes in direction may be the best trades of the day?) and I have also added a Revamped Oscillator showing on Lower and Overlaid on my Lowered Squared Histogram. The Histogram coordinates with the upper Long/Short Bubbles and the Oscillator shows previous candle movement as well as current candle movement. I will usually enter a trade when the Red/Green Heikin Ashi Candle first shows and is corroborated by my Long/Short Bubble and/or another change in direction indicator.

Heikin Candles Overview​

Let’s review Heikin Candles so as to better understand them.

A Green Candle is Bullish. It should be Flat on the bottom with wick protruding up from top of candle. The wick shows continuing direction movement. As the Candle moves up you would like for each candle to be larger and close above previous candle (acceleration is body growing in length). If you start getting a wick showing on the bottom as well as top momentum may be slowing and may be signaling a change in direction (also probable change if showing candle shrinking in size as well as closing below last candle). A candle with wicks protruding evenly both sides is most likely a change in direction.
A Red Candle is Bearish. It should be Flat on Top with wick protruding down from bottom of candle. The wick shows continuing direction movement. As the Candle moves down you would like for each candle to be larger and close below previous candle (acceleration is body growing in length). If you start getting a wick showing on the top as well as bottom momentum may be slowing and may be signaling a change in direction (also probable change if showing candle shrinking in size and closing above last candle). A candle with wicks protruding evenly both sides is most likely a change in direction.
Do we need to adjust the times in the indicators for PST time zone?
 
I use changes in direction to exit trades...two, or more, indicators in agreement
@csricksdds
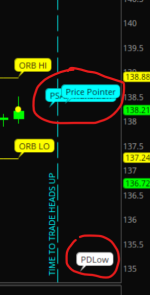
I turn off some indicators and/or study, but I still can not get off the three labels shown in the screen-shot (red circles) on the right side. Would you please let me know how to remove those three labels? Thanks!
 

Attachments

  • Screenshot 2024-11-25 092429.png
    Screenshot 2024-11-25 092429.png
    52.7 KB · Views: 29
Last edited by a moderator:

Join useThinkScript to post your question to a community of 21,000+ developers and traders.

Not the exact question you're looking for?

Start a new thread and receive assistance from our community.

87k+ Posts
385 Online
Create Post

The Market Trading Game Changer

Join 2,500+ subscribers inside the useThinkScript VIP Membership Club
  • Exclusive indicators
  • Proven strategies & setups
  • Private Discord community
  • ‘Buy The Dip’ signal alerts
  • Exclusive members-only content
  • Add-ons and resources
  • 1 full year of unlimited support

Frequently Asked Questions

What is useThinkScript?

useThinkScript is the #1 community of stock market investors using indicators and other tools to power their trading strategies. Traders of all skill levels use our forums to learn about scripting and indicators, help each other, and discover new ways to gain an edge in the markets.

How do I get started?

We get it. Our forum can be intimidating, if not overwhelming. With thousands of topics, tens of thousands of posts, our community has created an incredibly deep knowledge base for stock traders. No one can ever exhaust every resource provided on our site.

If you are new, or just looking for guidance, here are some helpful links to get you started.

What are the benefits of VIP Membership?
VIP members get exclusive access to these proven and tested premium indicators: Buy the Dip, Advanced Market Moves 2.0, Take Profit, and Volatility Trading Range. In addition, VIP members get access to over 50 VIP-only custom indicators, add-ons, and strategies, private VIP-only forums, private Discord channel to discuss trades and strategies in real-time, customer support, trade alerts, and much more. Learn all about VIP membership here.
How can I access the premium indicators?
To access the premium indicators, which are plug and play ready, sign up for VIP membership here.
Back
Top