This script looks at 4 candles at a time.
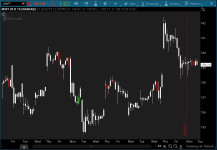
- If the first 3 candles in the pattern are BEARISH and the 4th candle BULLISH engulfs the 3rd candle then a GREEN triangle UP will display BELOW the 4th candle
- If the first 3 candles in the pattern are BULLISH and the 4th candle BEARISH engulfs the 3rd candle then a RED triangle DOWN will display ABOVE the 4th candle
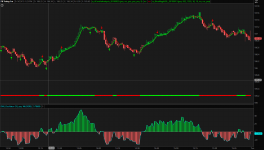
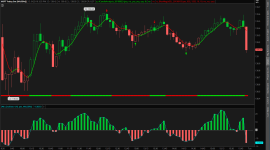
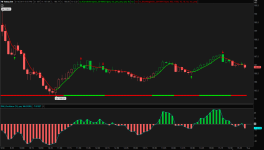
This version for ThinkorSwim, I replaced the signals with green and red colored bars.
Recommended timeframes:
- Hourly and Daily to identify trend / swing trading
- 5m for day trading
thinkScript Code
Code:
# 4 Candle Analysis
# Assembled by BenTen at useThinkScript.com
# Converted from https://www.tradingview.com/script/3TPknP5w-4-Candle-Analysis/

def candle1_Open = open[3];
def candle1_Close = close[3];
def candle2_Open = open[2];
def candle2_Close = close[2];
def candle3_Open = open[1];
def candle3_Close = close[1];

def candle4_Open = open;
def candle4_Close = close;

def isBullishTripleCandle = (candle1_Close > candle1_Open) and(candle2_Close > candle2_Open) and(candle3_Close >= candle3_Open) and(candle2_Close > candle1_Close);
def engulfCandle3withCandle4 = (candle4_Close <= candle4_Open) and(candle4_Close < candle3_Open);

def bearishReversalPredicted = isBullishTripleCandle and engulfCandle3withCandle4;

def isBearishTripleCandle = (candle1_Close < candle1_Open) and(candle2_Close < candle2_Open) and(candle3_Close <= candle3_Open) and(candle2_Close<candle1_Close);
def engulfCandle3withCandle4_1 = (candle4_Close >= candle4_Open) and(candle4_Close > candle3_Open);

def bullishReversalPredicted = isBearishTripleCandle and engulfCandle3withCandle4_1;

assignPriceColor(if bullishReversalPredicted then Color.Green else if bearishReversalPredicted then Color.Red else Color.White);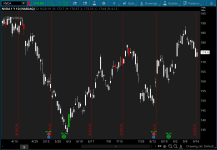
")