4 Candle Reversal Indicator for ThinkorSwim

BenTen

Administrative
Staff member
Staff
VIP
Lifetime
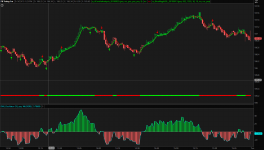
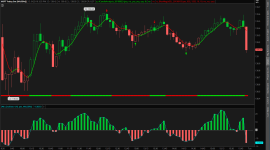
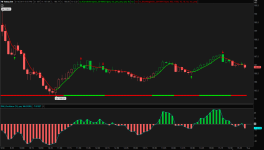
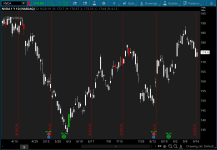
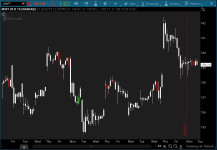
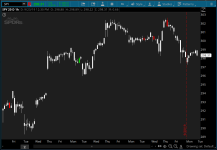
This script looks at 4 candles at a time.
  • If the first 3 candles in the pattern are BEARISH and the 4th candle BULLISH engulfs the 3rd candle then a GREEN triangle UP will display BELOW the 4th candle
  • If the first 3 candles in the pattern are BULLISH and the 4th candle BEARISH engulfs the 3rd candle then a RED triangle DOWN will display ABOVE the 4th candle

This version for ThinkorSwim, I replaced the signals with green and red colored bars.

Recommended timeframes:
  • Hourly and Daily to identify trend / swing trading
  • 5m for day trading

iZPnYnV.png

UpCSTD4.png

3oH2GA2.png


thinkScript Code

Code:
# 4 Candle Analysis
# Assembled by BenTen at useThinkScript.com
# Converted from https://www.tradingview.com/script/3TPknP5w-4-Candle-Analysis/

def candle1_Open = open[3];
def candle1_Close = close[3];
def candle2_Open = open[2];
def candle2_Close = close[2];
def candle3_Open = open[1];
def candle3_Close = close[1];

def candle4_Open = open;
def candle4_Close = close;

def isBullishTripleCandle = (candle1_Close > candle1_Open) and(candle2_Close > candle2_Open) and(candle3_Close >= candle3_Open) and(candle2_Close > candle1_Close);
def engulfCandle3withCandle4 = (candle4_Close <= candle4_Open) and(candle4_Close < candle3_Open);

def bearishReversalPredicted = isBullishTripleCandle and engulfCandle3withCandle4;

def isBearishTripleCandle = (candle1_Close < candle1_Open) and(candle2_Close < candle2_Open) and(candle3_Close <= candle3_Open) and(candle2_Close<candle1_Close);
def engulfCandle3withCandle4_1 = (candle4_Close >= candle4_Open) and(candle4_Close > candle3_Open);

def bullishReversalPredicted = isBearishTripleCandle and engulfCandle3withCandle4_1;

assignPriceColor(if bullishReversalPredicted then Color.Green else if bearishReversalPredicted then Color.Red else Color.White);
 

Attachments

  • 3oH2GA2.png
    3oH2GA2.png
    78.5 KB · Views: 288
  • UpCSTD4.png
    UpCSTD4.png
    67.1 KB · Views: 382
  • iZPnYnV.png
    iZPnYnV.png
    74 KB · Views: 294

Join useThinkScript to post your question to a community of 21,000+ developers and traders.

This looks like it will have great potential in 1 min chart. need to backtest - adding to my backlog. Does anyone have any good exit indicators that will complement this strategy?
 
@diazlaz Heard of DMI Oscillator? It's available in ThinkorSwim. I heard it's very good with helping you stay in and ride the trend. Test it out.
 
@diazlaz Heard of DMI Oscillator? It's available in ThinkorSwim. I heard it's very good with helping you stay in and ride the trend. Test it out.

MXW6s9D.png


Thanks Ben, shows promise, suggest folks to experiment with your favorite and share your findings. I have a number of other ideas I will test.

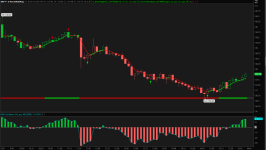
Here is the 4 candles, turned into arrows, with the SSL as a bar below and a ALMA + DMI below. There are a number of possible exit indicators, you can see the DMI maps nicely, when the DMI turns opposite of the trend exit, the SSL can also be used when it turns counter trend exit, and also once it breaks a lower ALMA it could also be used. (moving average line plotted on the upper).

great potential. suggest folks to play with it some more.
 

Attachments

  • MXW6s9D.png
    MXW6s9D.png
    217.4 KB · Views: 300
@diazlaz I'm not sure about your preference or the type of trader you are but for me the 1 minute chart is too noisy. I found the 5m chart to be the bare minimum for day trading. But if the 1m works for you then absolutely use that. I found some great backtesting result with this candle indicator on the 5 minute chart. You should check it out as well.
 
@diazlaz I'm not sure about your preference or the type of trader you are but for me the 1 minute chart is too noisy. I found the 5m chart to be the bare minimum for day trading. But if the 1m works for you then absolutely use that. I found some great backtesting result with this candle indicator on the 5 minute chart. You should check it out as well.
thanks Ben. I will build systems and have automated algo's trade the 1 minute, intraday trade the 5 minute and then swing trade. also more and more looking at weekly trading position and momentum. I been so focus on the 1 minute chart lately, thanks for awareness and need to go to a higher timeframe. appreciate that.

I'm amazed the simplicity of this indicator and leveraging price action with great potential. we should all pair this up with 1 or 2 additional confirmation indicators and I think this could turn into a viable trading plan.

Here is the an example on a 5 minute MSFT and FB.

pO59eC4.png


zLZvoUC.png
 

Attachments

  • zLZvoUC.png
    zLZvoUC.png
    182.3 KB · Views: 258
  • pO59eC4.png
    pO59eC4.png
    180.3 KB · Views: 269
Last edited:
@diazlaz Glad to hear your plan. I hope you the best of luck. Great looking chart there. Simple and clean ;)
 
@korygill as promised here is the updates on SSL to display it in bar form and steps to replicate the chart:

eUWHLwU.png


Indicators
  1. Modified Ben's BlueMagikSSL (upper)
  2. Modified Ben's 4CandleAnalysis (upper)
  3. DMI_Oscillator (lower)
Changes:

  1. Added Arrows to 4Candle Analysis
  2. Added Arrows to SSL (configure via input)
  3. Added Dashboard Bar to SSL (configure via input)

Code:
# Blue Magik SSL
# I assume this is based on the popular SSL indicator
# Assembled by BenTen at useThinkScript.com
# Converted from https://www.tradingview.com/script/i85H2tZ8-blue-magik/


input period = 10;
input len = 10;
input colorBars = yes;
input showArrows = no;
input showDashboard = no;

def smaHigh = simpleMovingAvg(high, len);
def smaLow = simpleMovingAvg(low, len);
def Hlv = if close > smaHigh then 1 else if close<smaLow then -1 else Hlv[1];
def sslDown = if Hlv< 0 then smaHigh else smaLow;
def sslUp = if Hlv< 0 then smaLow else smaHigh;
plot isup = sslUp;
plot isdown = sslDown;
isup.SetDefaultColor(GetColor(1));
isdown.SetDefaultColor(GetColor(0));
def sBlueSSL = if Hlv< 0 then -100 else 100;
isup.SetHiding (showDashboard);
isdown.SetHiding (showDashboard);

def sColorData = sBlueSSL;
AssignPriceColor(
   if colorBars then    
      if sColorData == 100 then COLOR.GREEN else
      COLOR.RED
   else
     Color.CURRENT);

plot pUP = sBlueSSL crosses above 0;
pUP.SetPaintingStrategy(PaintingStrategy.BOOLEAN_ARROW_UP);
pUP.AssignValueColor(COLOR.GREEN);
pUP.SetLineWeight(2);
pUP.SetHiding (!showArrows);

plot pDOWN = sBlueSSL crosses below 0;
pDOWN.SetPaintingStrategy(PaintingStrategy.BOOLEAN_ARROW_DOWN);
pDOWN.AssignValueColor(COLOR.RED);
pDOWN.SetLineWeight(2);
pDOWN.SetHiding (!showArrows);

plot pDB1 = LowestAll(low) - 0.01;
pDB1.AssignValueColor(
if IsNaN(sBlueSSL) then Color.DARK_GRAY else
if sBlueSSL == 100 then COLOR.GREEN else COLOR.RED);
pDB1.SetPaintingStrategy (PaintingStrategy.HORIZONTAL);
pDB1.SetLineWeight(5);
pDB1.HideTitle();
pDB1.HideBubble();
pDB1.SetHiding (!showDashboard);
 

Attachments

  • eUWHLwU.png
    eUWHLwU.png
    181.1 KB · Views: 273
Thank you for sharing @diazlaz. Did you know you can also share charts/grids/etc from the menu on the chart? This will put a hyperlink on your clipboard you can then send to others. You have the option to share just the chart, or the chart + all the studies.

SM1DJQI.png


For example, here is your chart except I don't have your colored moving average, and I added my own code to change the arrows.

https://tos.mx/XJGDjaZ

From main window, Setup | Open Shared Item and paste in that hyperlink.

Appreciate your post!
 
Is it possible to just have the Red and Green arrows below/above the candles, without changing the default candle colors?
 
How change this script don't change the colors on the bars (all white) just leave them as are for default (Green and Red), just show a arrow (green or red) when meet the 4bars reversal? thanks
 
@wilmanv Below is the updated script with your requested feature.

Code:
# 4 Candle Analysis
# Assembled by BenTen at useThinkScript.com
# Converted from https://www.tradingview.com/script/3TPknP5w-4-Candle-Analysis/

def candle1_Open = open[3];
def candle1_Close = close[3];
def candle2_Open = open[2];
def candle2_Close = close[2];
def candle3_Open = open[1];
def candle3_Close = close[1];

def candle4_Open = open;
def candle4_Close = close;

def isBullishTripleCandle = (candle1_Close > candle1_Open) and(candle2_Close > candle2_Open) and(candle3_Close >= candle3_Open) and(candle2_Close > candle1_Close);
def engulfCandle3withCandle4 = (candle4_Close <= candle4_Open) and(candle4_Close < candle3_Open);

def bearishReversalPredicted = isBullishTripleCandle and engulfCandle3withCandle4;

def isBearishTripleCandle = (candle1_Close < candle1_Open) and(candle2_Close < candle2_Open) and(candle3_Close <= candle3_Open) and(candle2_Close<candle1_Close);
def engulfCandle3withCandle4_1 = (candle4_Close >= candle4_Open) and(candle4_Close > candle3_Open);

def bullishReversalPredicted = isBearishTripleCandle and engulfCandle3withCandle4_1;

#assignPriceColor(if bullishReversalPredicted then Color.Green else if bearishReversalPredicted then Color.Red else Color.White);

# Plot Signals
plot bullish = bullishReversalPredicted;
bullish.SetPaintingStrategy(PaintingStrategy.BOOLEAN_ARROW_UP);
bullish.SetDefaultColor(Color.CYAN);
bullish.SetLineWeight(1);
plot bearish = bearishReversalPredicted;
bearish.SetPaintingStrategy(PaintingStrategy.BOOLEAN_ARROW_DOWN);
bearish.SetDefaultColor(Color.CYAN);
bearish.SetLineWeight(1);
 
@wilmanv Below is the updated script with your requested feature.

Code:
# 4 Candle Analysis
# Assembled by BenTen at useThinkScript.com
# Converted from https://www.tradingview.com/script/3TPknP5w-4-Candle-Analysis/

def candle1_Open = open[3];
def candle1_Close = close[3];
def candle2_Open = open[2];
def candle2_Close = close[2];
def candle3_Open = open[1];
def candle3_Close = close[1];

def candle4_Open = open;
def candle4_Close = close;

def isBullishTripleCandle = (candle1_Close > candle1_Open) and(candle2_Close > candle2_Open) and(candle3_Close >= candle3_Open) and(candle2_Close > candle1_Close);
def engulfCandle3withCandle4 = (candle4_Close <= candle4_Open) and(candle4_Close < candle3_Open);

def bearishReversalPredicted = isBullishTripleCandle and engulfCandle3withCandle4;

def isBearishTripleCandle = (candle1_Close < candle1_Open) and(candle2_Close < candle2_Open) and(candle3_Close <= candle3_Open) and(candle2_Close<candle1_Close);
def engulfCandle3withCandle4_1 = (candle4_Close >= candle4_Open) and(candle4_Close > candle3_Open);

def bullishReversalPredicted = isBearishTripleCandle and engulfCandle3withCandle4_1;

#assignPriceColor(if bullishReversalPredicted then Color.Green else if bearishReversalPredicted then Color.Red else Color.White);
# Plot Signals
plot bullish = bullishReversalPredicted;
bullish.SetPaintingStrategy(PaintingStrategy.BOOLEAN_ARROW_UP);
bullish.SetDefaultColor(Color.CYAN);
bullish.SetLineWeight(1);
plot bearish = bearishReversalPredicted;
bearish.SetPaintingStrategy(PaintingStrategy.BOOLEAN_ARROW_DOWN);
bearish.SetDefaultColor(Color.CYAN);
bearish.SetLineWeight(1);


Thanks Mr @BenTen
 
...... I will build systems and have automated algo's trade the 1 minute, intraday trade the 5 minute and then swing trade. also more and more looking at weekly trading position and momentum.........

Hey diazlaz
Were you able to automate it like TOS will execute based on the indicator without manual intervention?
 
Hey diazlaz
Were you able to automate it like TOS will execute based on the indicator without manual intervention?
Hi @pdxtrader, i'm working on a automation platform that ties into ToS, will likely have a release towards end of December or January 2020 the latest. still not sure if it will be distributed or not, but will keep you all updated on the progress and learnings.
 
Hi @pdxtrader, i'm working on a automation platform that ties into ToS, will likely have a release towards end of December or January 2020 the latest. still not sure if it will be distributed or not, but will keep you all updated on the progress and learnings.
Thank you man. Please update me.
 
Thanks Benten for posting this over on Twitter as I had missed it previously. I prefer the arrows as well because I use trend colorization on my charts and would also like to use this in conjunction with one or two other trend change studies.

Would it be possible to provide the script for a watchlist column?

Thanks
 

Not the exact question you're looking for?

Start a new thread and receive assistance from our community.

87k+ Posts
442 Online
Create Post

The Market Trading Game Changer

Join 2,500+ subscribers inside the useThinkScript VIP Membership Club
  • Exclusive indicators
  • Proven strategies & setups
  • Private Discord community
  • ‘Buy The Dip’ signal alerts
  • Exclusive members-only content
  • Add-ons and resources
  • 1 full year of unlimited support

Frequently Asked Questions

What is useThinkScript?

useThinkScript is the #1 community of stock market investors using indicators and other tools to power their trading strategies. Traders of all skill levels use our forums to learn about scripting and indicators, help each other, and discover new ways to gain an edge in the markets.

How do I get started?

We get it. Our forum can be intimidating, if not overwhelming. With thousands of topics, tens of thousands of posts, our community has created an incredibly deep knowledge base for stock traders. No one can ever exhaust every resource provided on our site.

If you are new, or just looking for guidance, here are some helpful links to get you started.

What are the benefits of VIP Membership?
VIP members get exclusive access to these proven and tested premium indicators: Buy the Dip, Advanced Market Moves 2.0, Take Profit, and Volatility Trading Range. In addition, VIP members get access to over 50 VIP-only custom indicators, add-ons, and strategies, private VIP-only forums, private Discord channel to discuss trades and strategies in real-time, customer support, trade alerts, and much more. Learn all about VIP membership here.
How can I access the premium indicators?
To access the premium indicators, which are plug and play ready, sign up for VIP membership here.
Back
Top