



Scroll down to check out this week's must reads, carefully selected by uTS Moderators!

AGAIG Overnight Trading Indicator
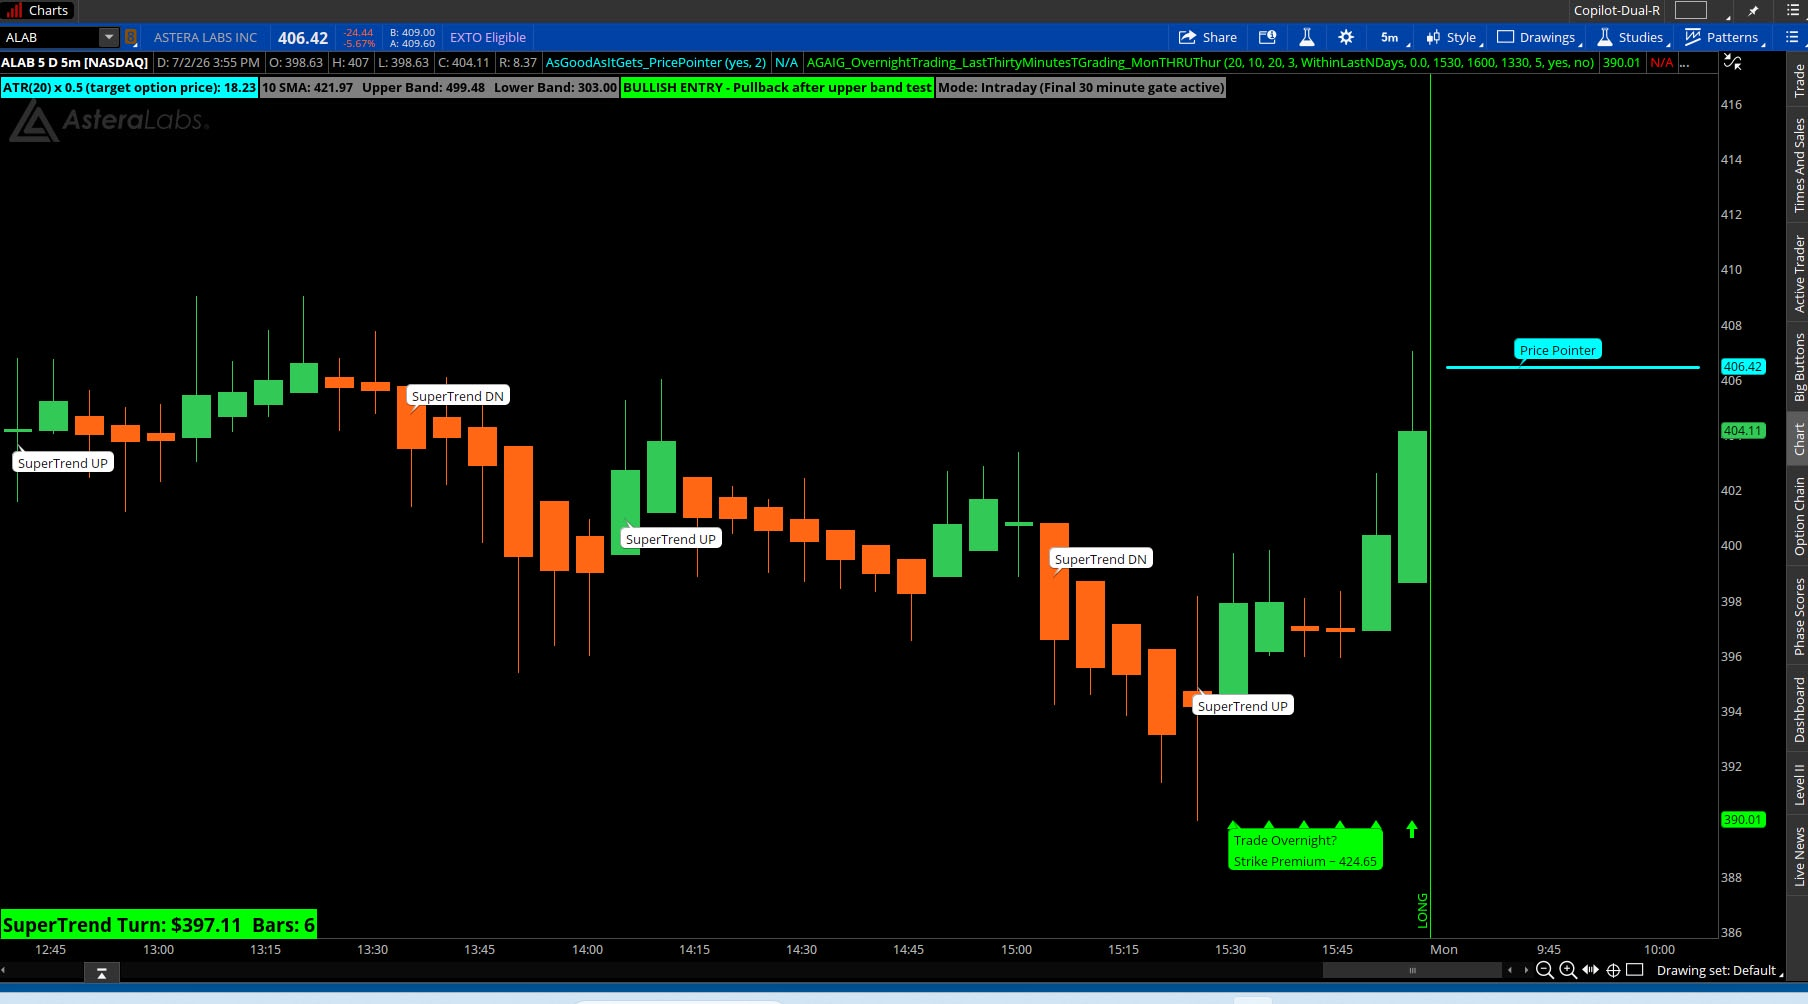
csricksdds said:This indicator only fires (shows) when the "stars align" and the stock (ETF) is suitable for an overnight trade using these parameters. The BUBBLE will state "{Trade Overnight"? The "Strike Premium" is the amount you should be looking to pay that is closest to the option strike that can (or should) be selected.
On the ALAB I’m showing you, the option price is steep, and so it could be traded as a SPREAD to reduce cost and risk? It’s best to place your trade for expirations at least 5 days out but not necessary. On this chart I have added my Price Pointer, the Mobius Super Trend, and the Overnight Indicator.
The upper labels and diagnostics can be toggled on/off (my picture has the Labels on and the diagnostics off). This indicator can be applied to all charts and for all time frames.
https://usethinkscript.com/threads/agaig-overnight-trading-indicator-for-thinkorswim.22545/
Uptrick Liquid Reversal Bands
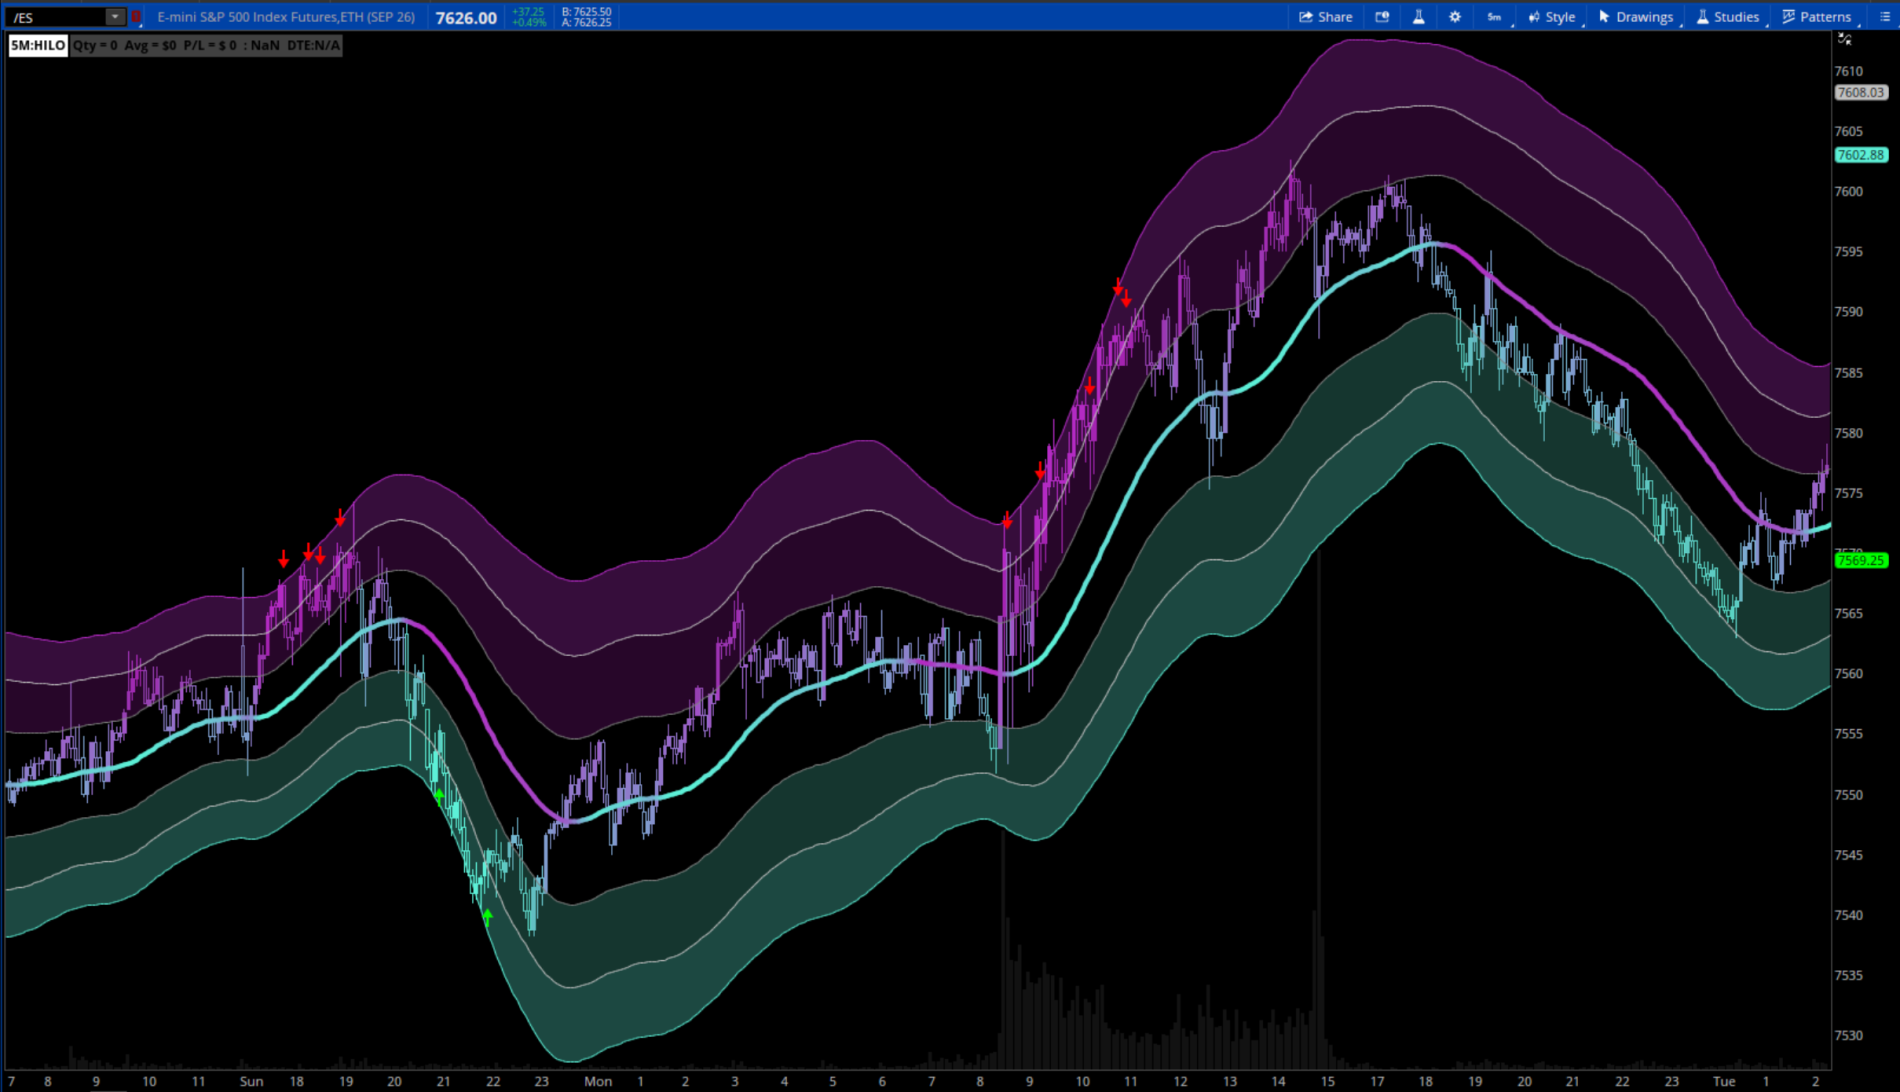
chewie76 said:Liquid Reversal Bands is an overlay indicator designed to help traders identify dynamic support and resistance zones, detect mean-reversion opportunities, and read price position within a volatility-aware envelope. Rather than using fixed standard deviation bands around a single moving average, this system builds its band width from multiple volatility components simultaneously, creating a more adaptive and stable envelope that responds to changing market conditions without overreacting to short-term noise.
The candle coloring, fair value line, and band fills all carry live visual information, making it possible to assess market state and recent signal context at a glance without needing additional tools on the chart.
https://usethinkscript.com/threads/uptrick-liquid-reversal-bands-for-thinkorswim.22559/
VIP SUBSCRIBERS ONLY |
Credit Risk Dashboard
antwerks said:Not that I am a Chicken Little ----
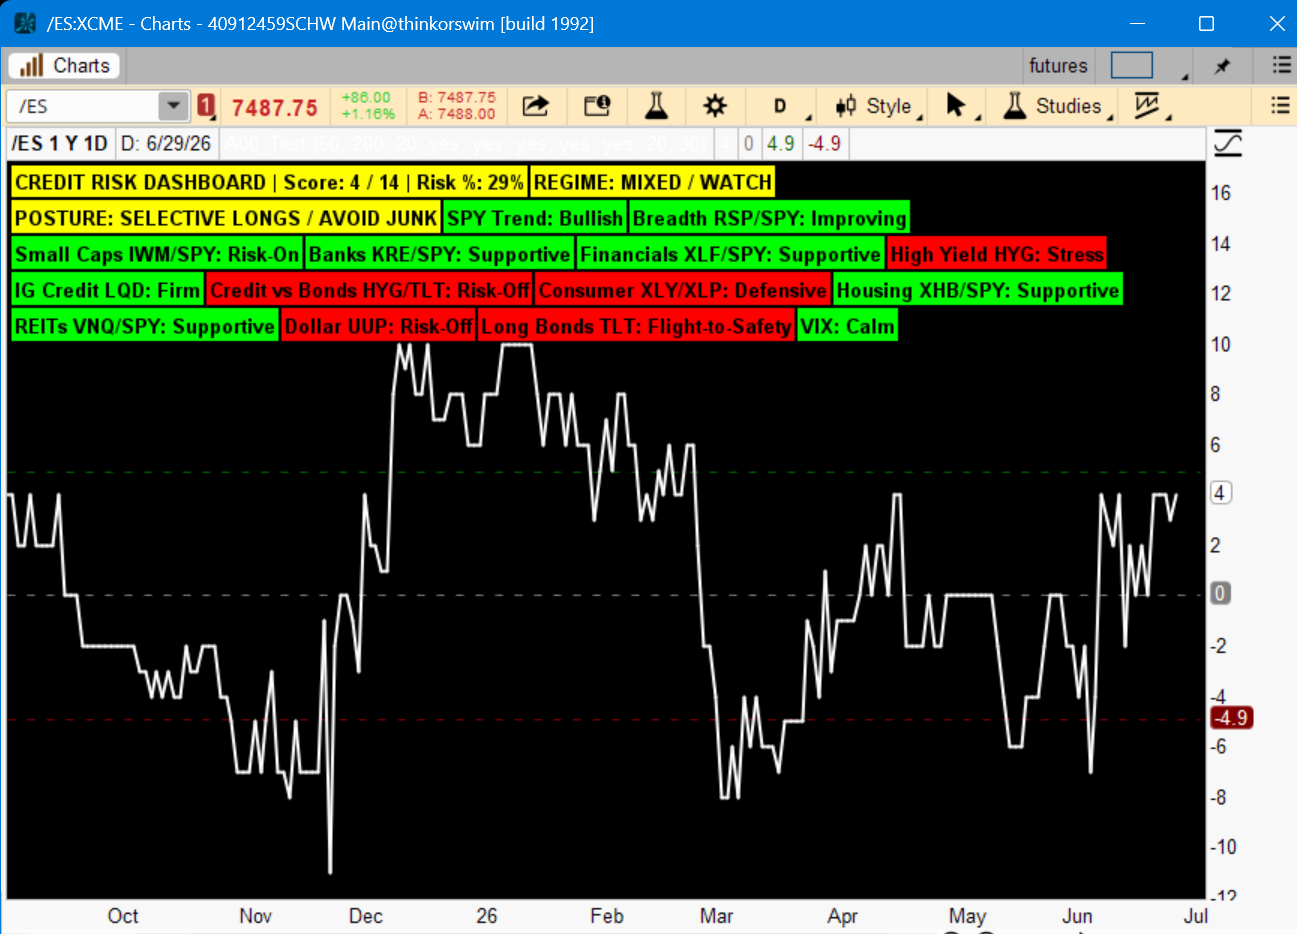
just a watchlist - The relative charts I’d watch most:
RSP / SPY
IWM / SPY
KRE / SPY
HYG / IEF or HYG trend
XLY / XLP
If SPY is rising but KRE, IWM, and HYG are rolling over, I would call that distribution risk.
If credit stress is rising but corporate spreads and banks are calm, respect the bullish tape. If consumer/housing stress starts confirming through banks, high-yield spreads, small caps, and breadth, stop trusting index strength. That is when the market can get disemboweled.
Read more
https://usethinkscript.com/threads/credit-risk-dashboard.22521/
Join our VIP Members Club to get access to our premium indicators including Buy The Dip, Advanced Market Moves and Take Profit.
Your VIP membership includes:
✓Full access to public & private forums
✓No Ads
✓Priority community support
✓Unlimited Postings
✓Premium thinkorswim indicators
✓Exclusive strategies, scanners, add-ons
✓Discord chatroom with Trade Alerts
VIP Membership
LWPI Auction Control Index
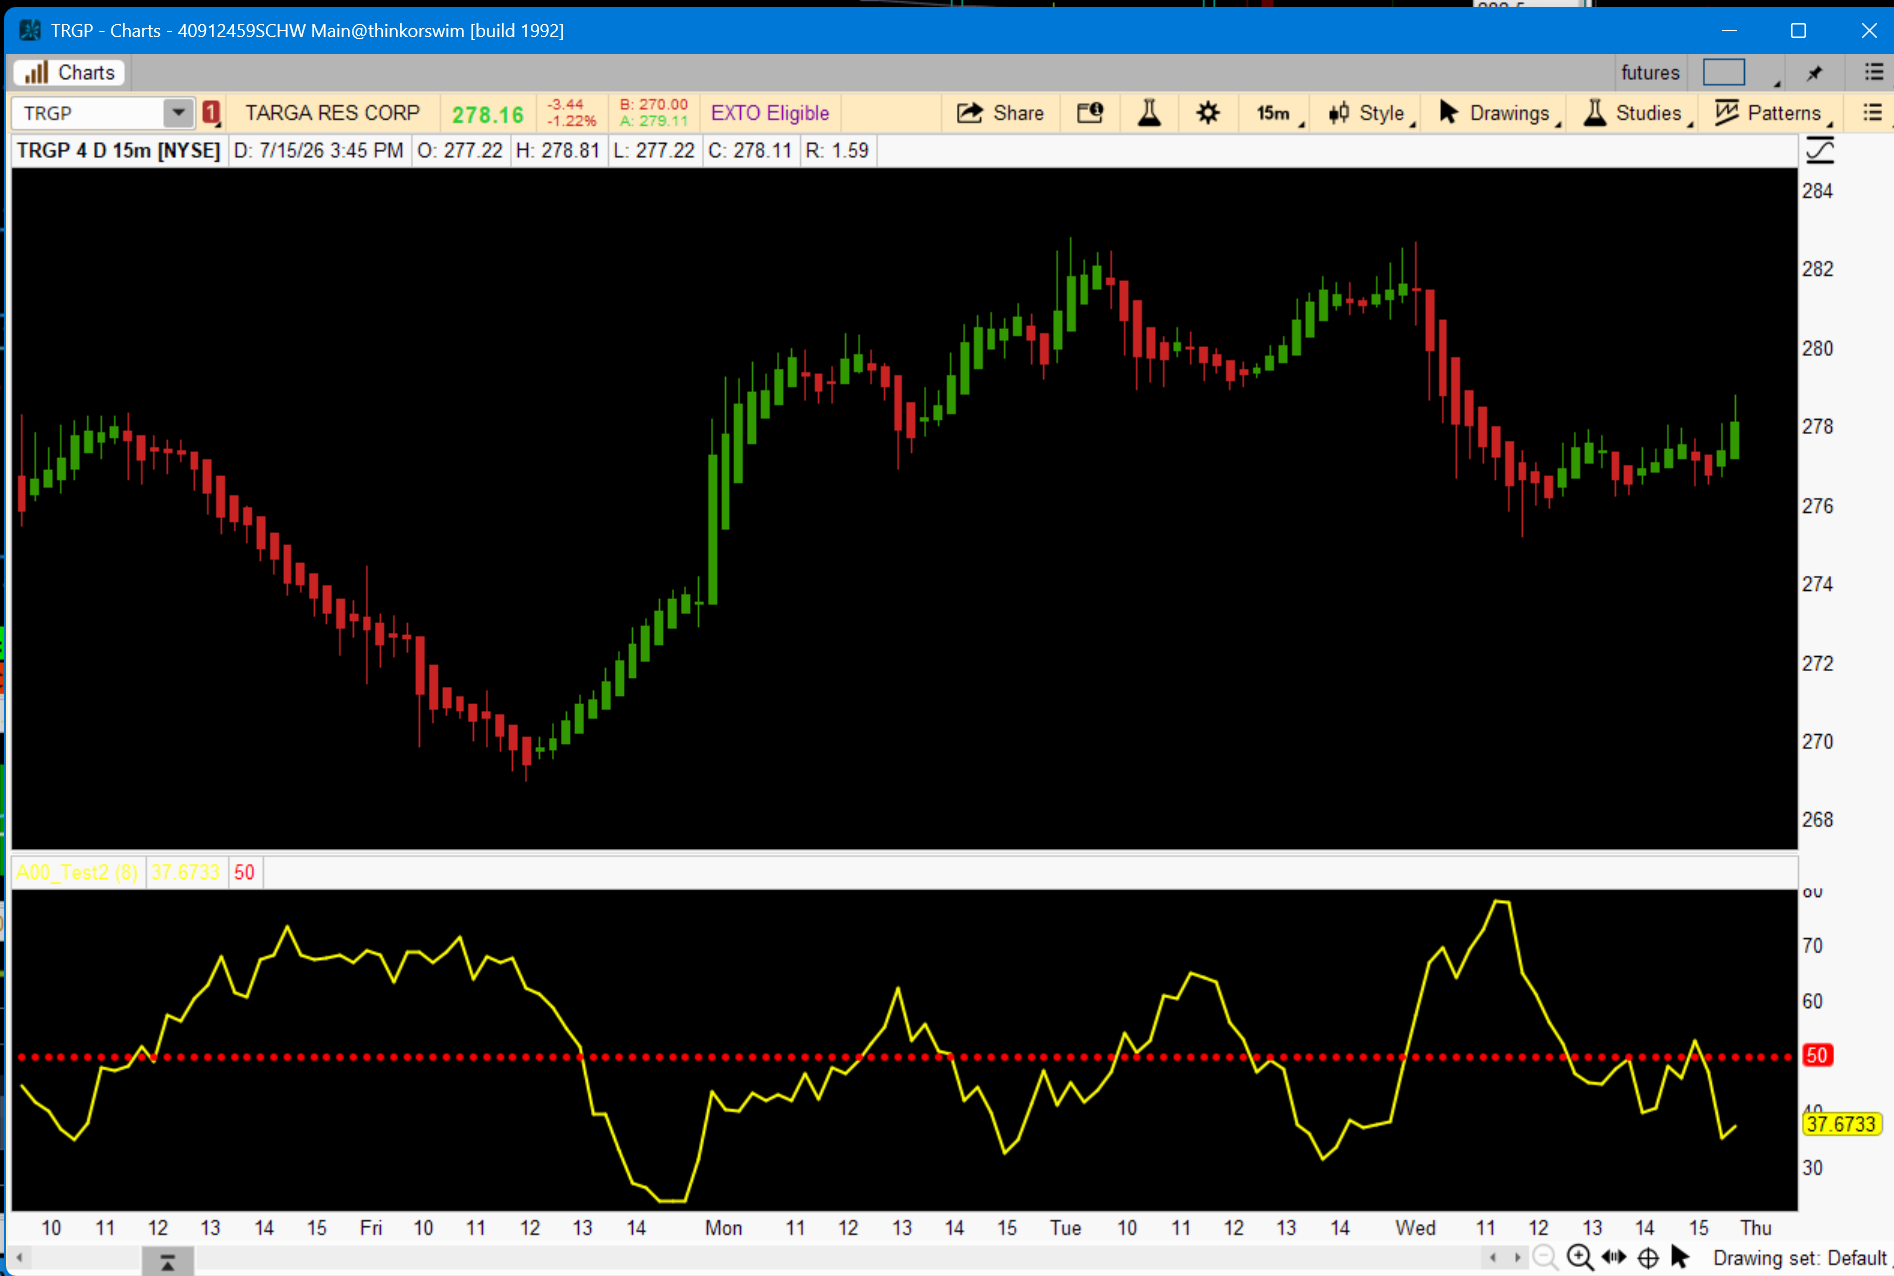
BillW shared:This is not a buy/sell indicator. This study provides something more simple and more important.
Who controls the auction?
Not based on one candle but the last several candles. Normalized by volatility. Most traders focus on patterns, indicators, oscillators, and crossovers while ignoring the actual battle between buyers and sellers. The LWPI forces you to think about that battle.
This can highlight situations where:
» Your indicators are bullish, but buyers are not controlling the auction very well.
» The market may continue higher, but buying pressure is deteriorating.
» Your indicators are bearish, but sellers are beginning to lose control.
» Price is still moving in one direction while participation is quietly shifting in the other.
https://usethinkscript.com/threads/lwpi-auction-control-index-for-thinkorswim.22564/
FROM THE ARCHIVES |
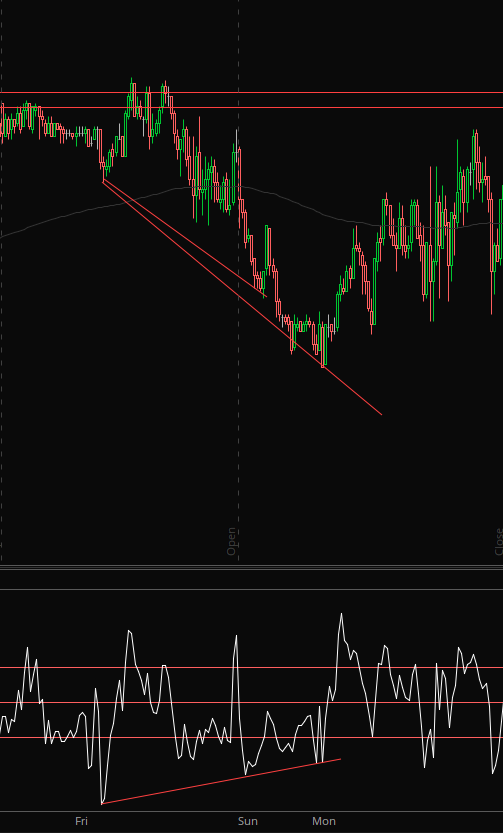
Are Divergence Indicators possible in ThinkOrSwim?
merryDay shared:The issue is that divergences are a pattern without context.
What you really want to identify is the behavior that causes of the change in the direction of price .
Patterns are not consistent but the underlying causes are very consistent. There are many scripts on the forum that make attempts at divergences.
None of them, do the job very well. Part of the problem is, that the code must wait into the future for the divergences to form. So it is late to the party. No way around it. Insult to injury. Divergence scripts are repainters; they go back and repaint the signals.
Most research has found that divergences have the tendency to appear without the actual reversal materializing.
And that reversals materialize without a divergence.
Behavior causing reversals are almost always found at support and resistance lines and key levels.
That is where all good traders start and end when looking for entry.
Those levels identify where the trapped traders are, where expansion will fail, where pushes will exhaust, and where aggressive absorption will step in.
Read more
https://usethinkscript.com/threads/are-divergence-indicators-possible-in-thinkorswim.17298/
Last edited:

