



Scroll down to check out this week's must reads, carefully selected by uTS Moderators!

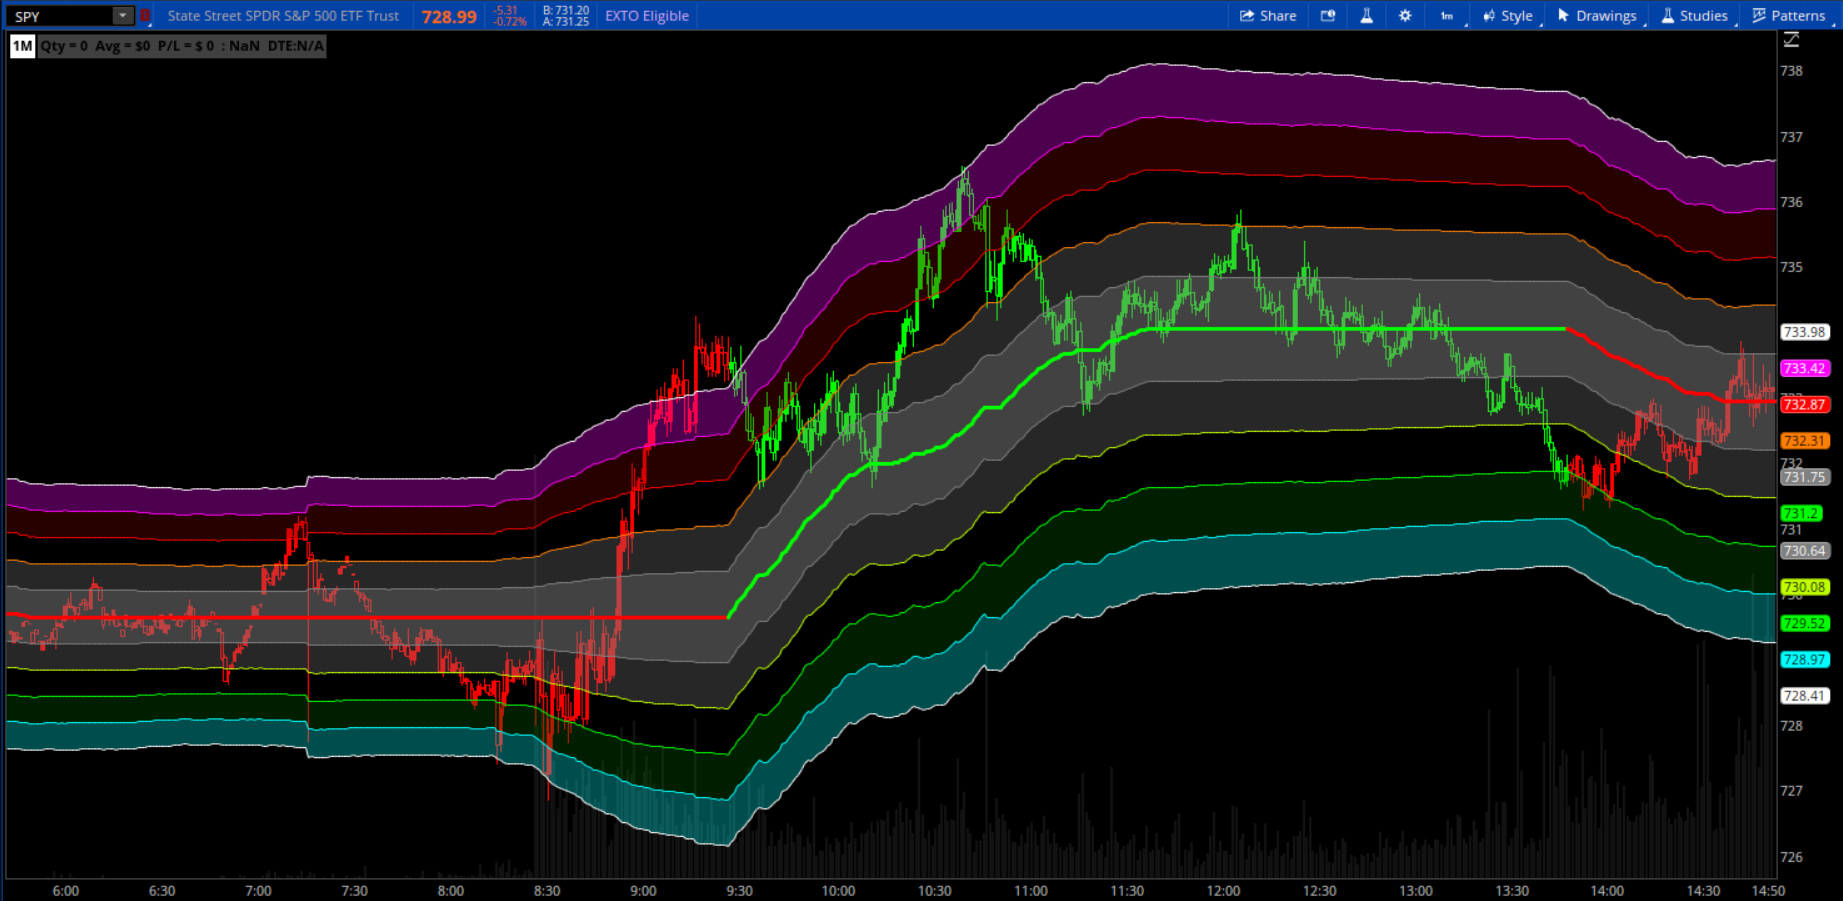
NLMS Volatility Trail-ATR Envelope
chewie76 said:The NLMS Volatility Trail is an adaptive trend-following overlay built on a Normalized Least Mean Squares (NLMS) filter — a machine-learning-derived signal processing algorithm that continuously learns from recent price action to produce a smoothed, predictive estimate of price. Unlike a simple moving average, the NLMS filter adjusts its internal weights bar-by-bar using gradient descent, making it more responsive to genuine trend changes while suppressing noise.
Typically a flat Trail line indicates a choppy market while a moving Trail line is trending. The middle gray shaded areas are normal non-trending trading areas. Alerts, cloud fill, and paint bars are adjustable in the input settings.
https://usethinkscript.com/threads/nlms-volatility-trail-atr-envelope-for-thinkorswim.22511/
AGAIG Ichimoku Simplified Trading Indicator
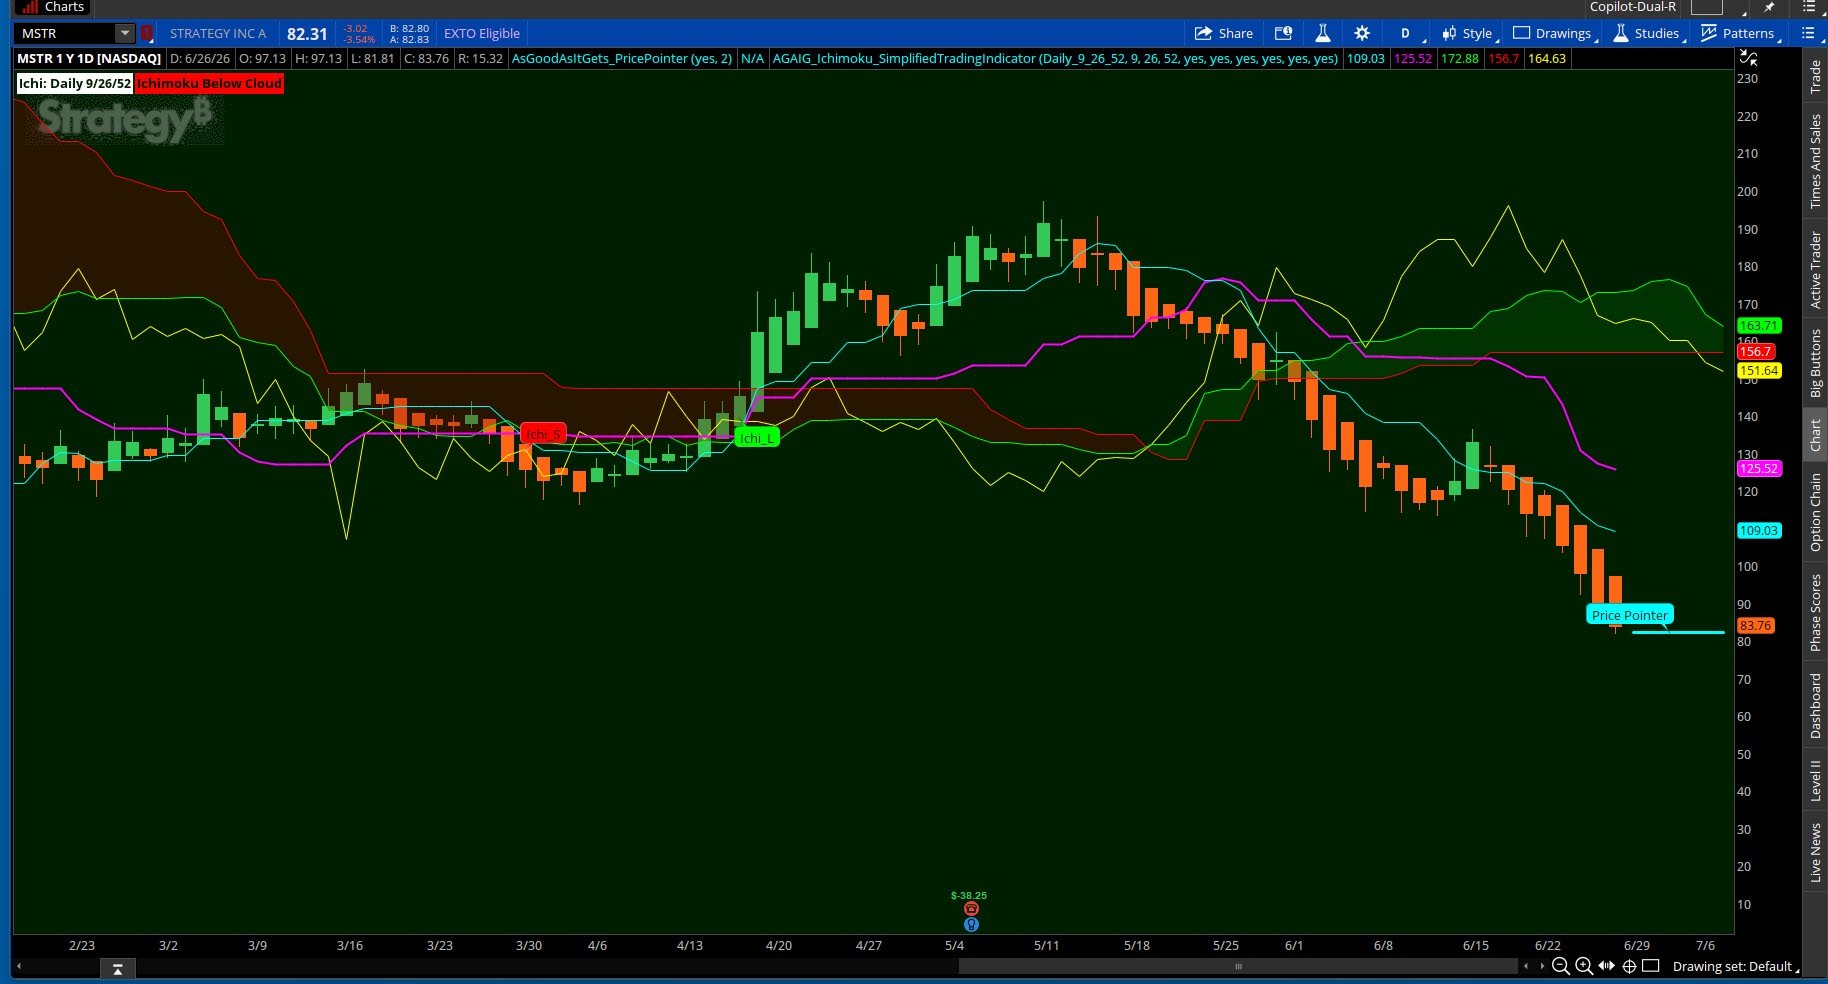
csricksdds said:This is Ichimoku simplified. The Chart Lines and Cloud can be toggled on/off. The Time Frames can be adjusted from Custom thru Weekly. Ichimoku is characteristically used for Swing Trading. If you use shorter time frames you might want to shorten the tankan, kijun, and senkou b to something like 5, 13,26 or 5, 12, 24.
For daily and weekly charts this indicator is at its strongest. The classic 9/26/52 settings are doing exactly what Hosoda designed them to do — the cloud is wide enough to act as meaningful support/resistance, the TK cross carries real weight, and the Chikou confirmation filters out a lot of noise. When all three pillars align for the Ichi L or Ichi S bubble, you're getting a high-conviction signal on a timeframe where Ichimoku genuinely shines.
https://usethinkscript.com/threads/...fied-trading-indicator-for-thinkorswim.22514/
VIP SUBSCRIBERS ONLY |
DCPv2/Ehlers Ultimate Bands
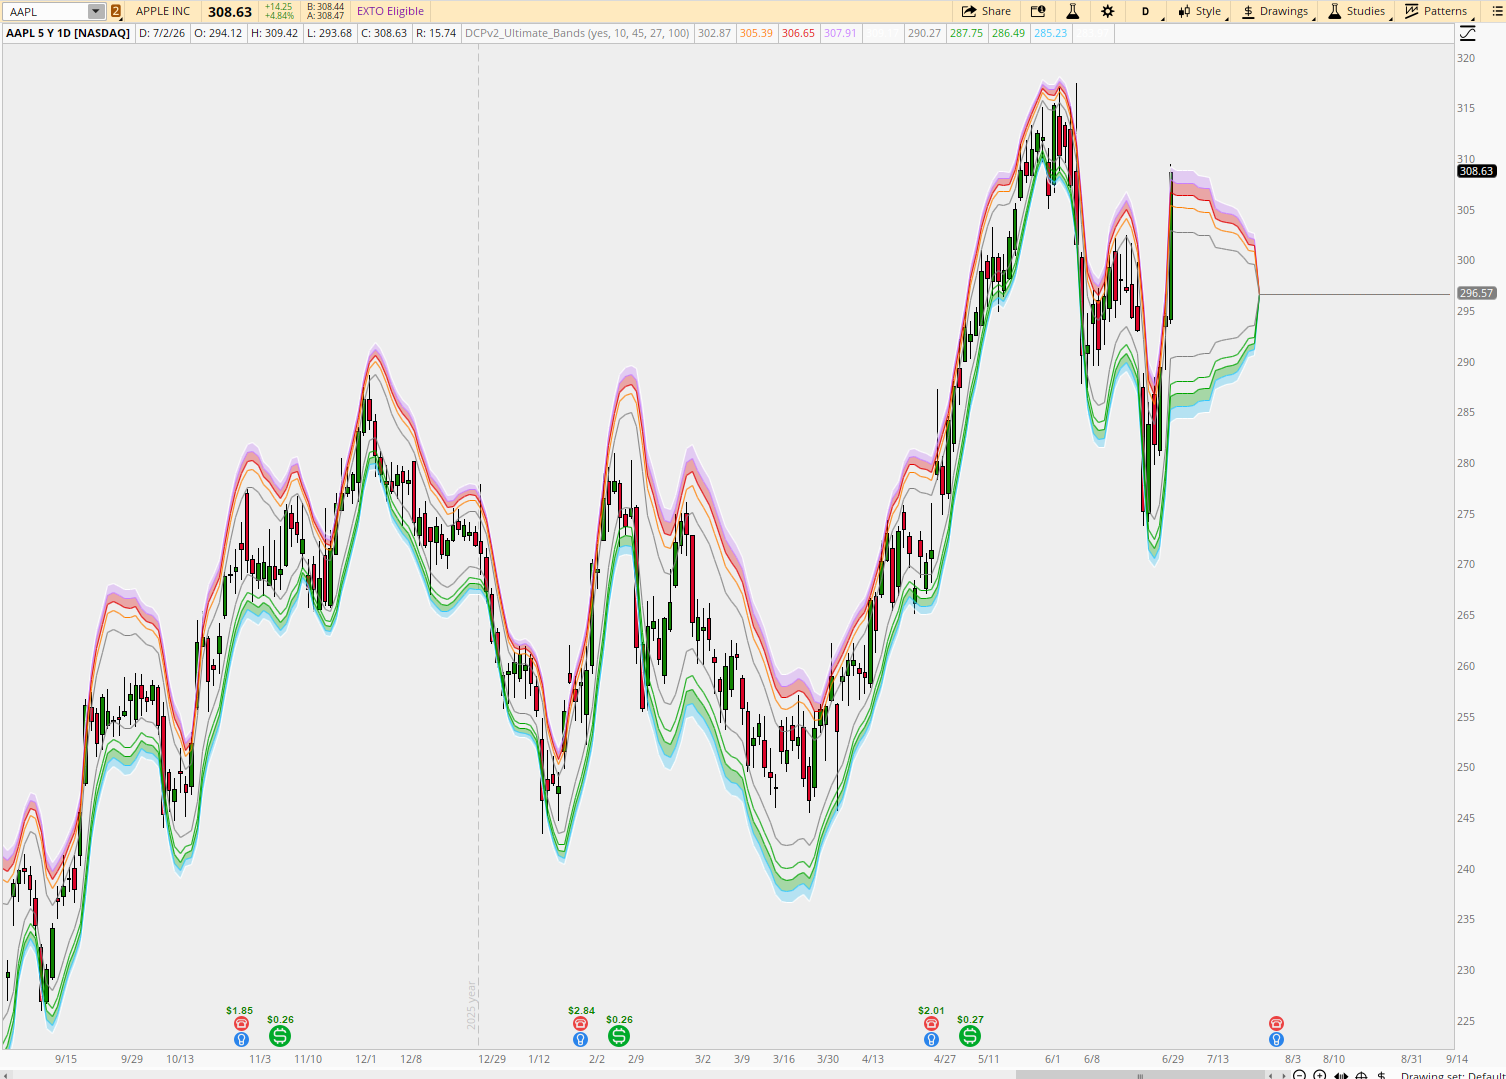
ᚱ ᛁ ᚢ ᛅ ᚱ ᛏ ᛁ ᛅ ᛋ said:These indicators provide a clean read on when the market is stretching, compressing, or loading a move before it happens.
Use Ultimate Bands for a steady volatility envelope that shows how far price is stretching from its cycle mean.
The clean way to see overextension and compression against equilibrium.
Watching @chewie76 kill it these past few days made me turn my attention toward price deviation logic. Similar to the DCPv2\Ultimate Channel but these are the bands.
Hope you like it. As always.
Read more
https://usethinkscript.com/threads/dcpv2-ehlers-ultimate-bands.22537/
Join our VIP Members Club to get access to our premium indicators including Buy The Dip, Advanced Market Moves and Take Profit.
Your VIP membership includes:
✓Full access to public & private forums
✓No Ads
✓Priority community support
✓Unlimited Postings
✓Premium thinkorswim indicators
✓Exclusive strategies, scanners, add-ons
✓Discord chatroom with Trade Alerts
VIP Membership
The Quantum Tunneling Predictor
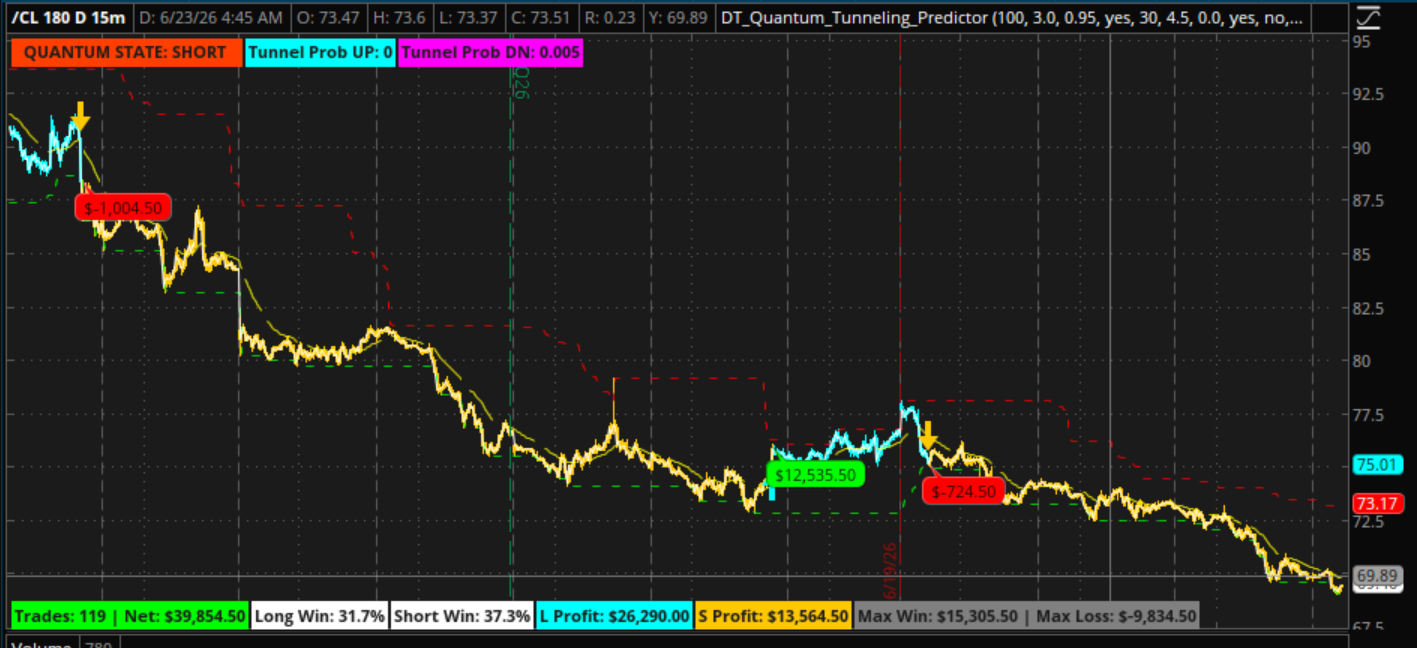
whoDAT shared:The Quantum Tunneling Predictor applies the non-linear mathematical principles of quantum mechanics—specifically particle velocity and potential energy barrier penetration—to isolate high-probability institutional breakouts while insulating capital from market micro-noise.
https://usethinkscript.com/threads/the-quantum-tunneling-predictor-for-thinkorswim.22507/
FROM THE ARCHIVES |
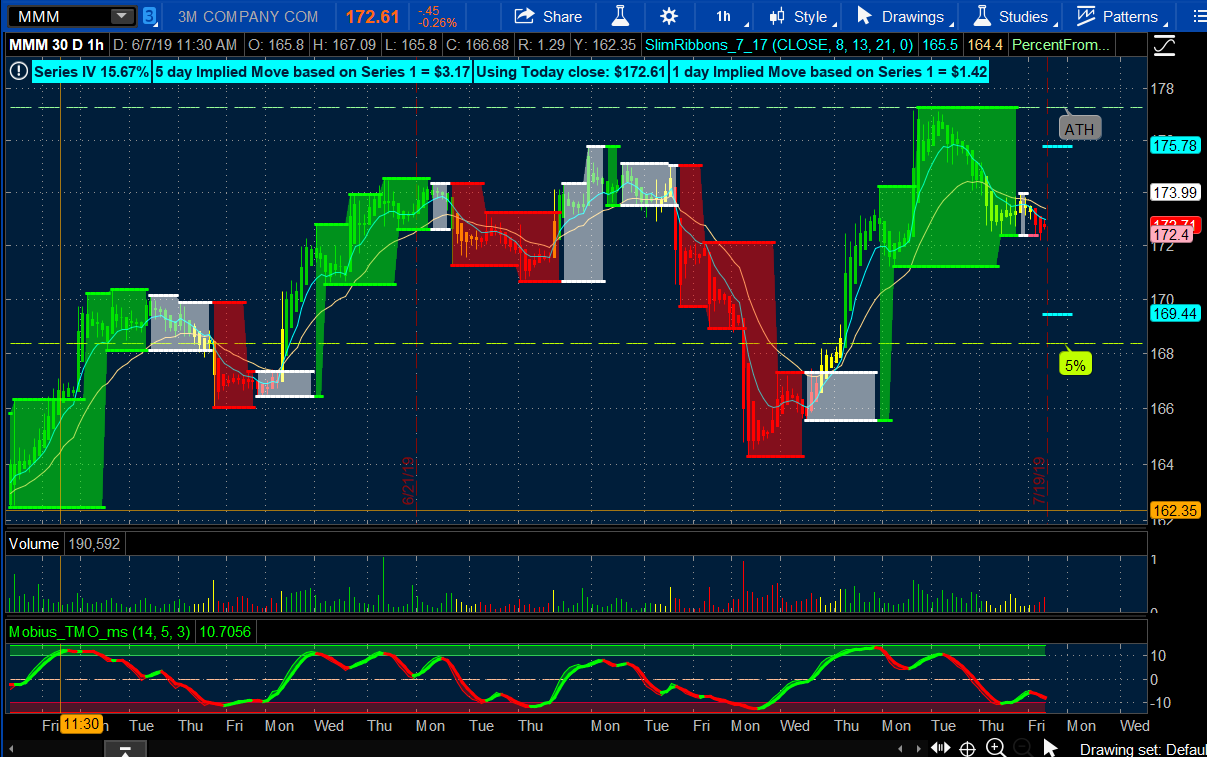
Fractal Boxes by Mobius
markos shared:This indicator provides a clean, objective breakout structure.
Fractal Boxes lock in swing highs and lows, freeze them in a box.
When price breaks a box, you get a real shift in control.
It’s for members who want confirmed levels, stable structure, and breakout clarity.
Read more
https://usethinkscript.com/threads/fractal-boxes-by-mobius-for-thinkorswim.377/
Last edited:

