



Scroll down to check out this week's must reads, carefully selected by uTS Moderators!

CarbonStation Energy Elite Scanner
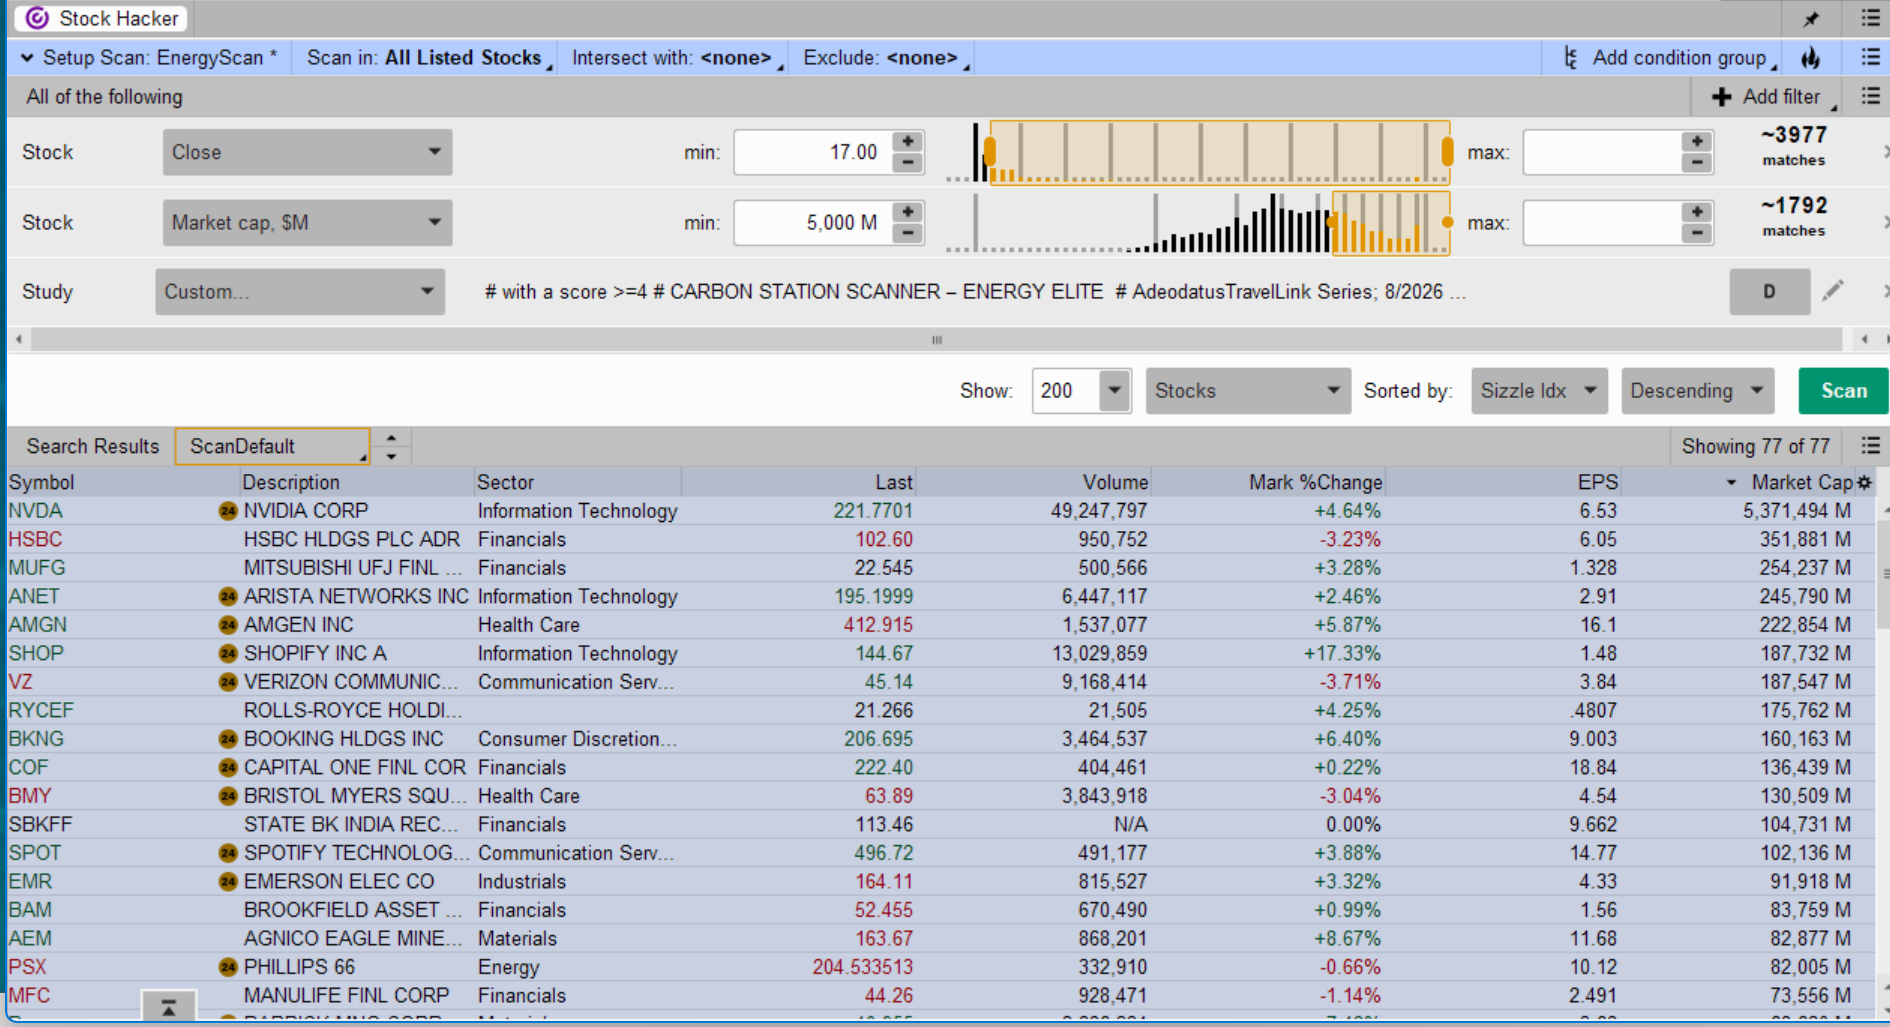
Adeodatus said:When Energy is a showing up as major market driver for the days activity; you want to know where else that strength is showing up. It is looking for stocks that are showing similar strength.
It also looks for expanding volume, expanding range and a developing trend, helping separate stocks that are simply moving from stocks where something meaningful may be developing.
When Energy is driving the market, this can uncover candidates you might never have thought to put on your watchlist.
Read more:
https://usethinkscript.com/threads/carbonstation-energy-elite-scanner-for-thinkorswim.22605/
Self-Adaptive Trend Signals [AlgoAlpha]
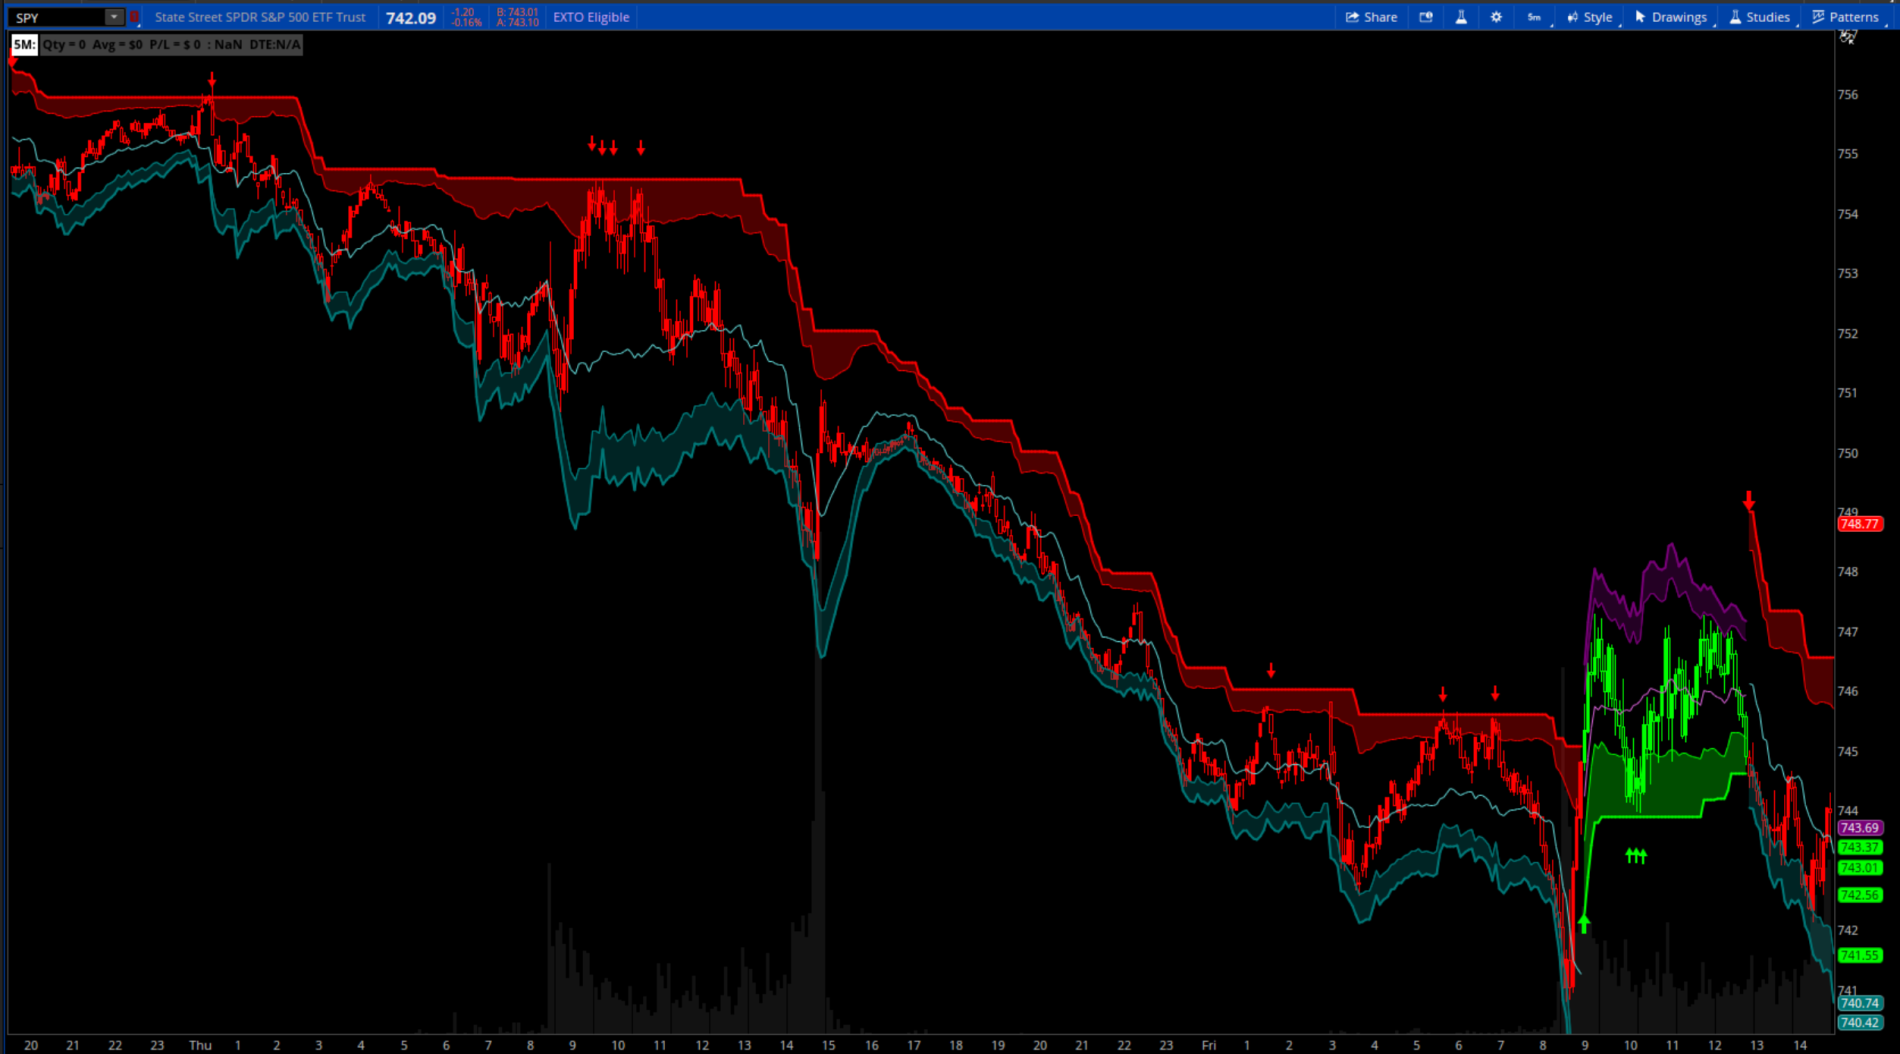
chewie76 said:This script builds on the SuperTrend by replacing its fixed ATR multiplier with one that learns from recent pullback behavior. Instead of assuming every market needs the same amount of room, it continuously measures how deep pullbacks normally become during uptrends and downtrends, then adjusts the trend line to match.
The learning process is separated for bullish and bearish markets because both often behave differently. As new price data arrives, the trend line gradually adapts while remaining stable through smoothing and configurable limits. The result is a SuperTrend that responds to changing market conditions without requiring manual multiplier adjustments.
Read more:
https://usethinkscript.com/threads/self-adaptive-trend-signals-algoalpha-for-thinkorswim.22571/
VIP SUBSCRIBERS ONLY |
Market Regimes & Market Volatility
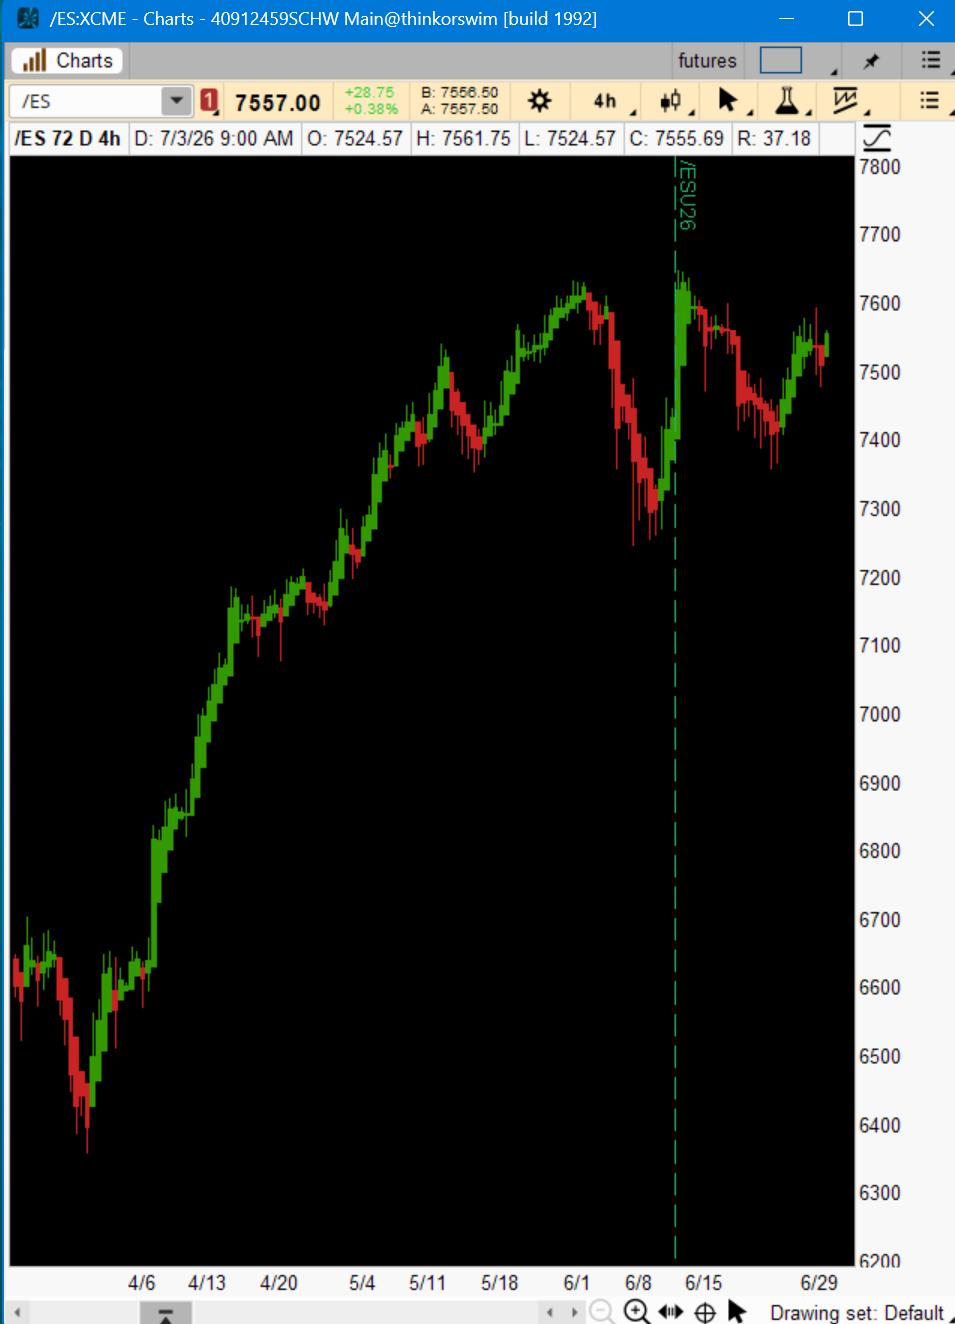
useThinkScript said:In Q2, there were 35 out of 63 total trading days with strong bullish expansion runs (/ES gains>.04%). That's historic. In a typical bull market, only about 30% of the sessions qualify as strong trend/momentum expansion days.
But this quarter, momentum oscillators such as MACD and RSI and trend strategies utilizing moving averages dominated roughly 50% of trading sessions.
Momentum traders were rewarded with deep liquidity and clean trends. Where breakouts ran, volume confirmed, and even sloppy execution got rewarded.
Trading momentum during a bullish expansion is like driving a Mustang on a warm, dry race track. Grip is effortless. Acceleration feels limitless. The problem is when it starts raining...
Read more
https://usethinkscript.com/threads/market-regimes-market-volatility-in-thinkorswim.22601/
Join our VIP Members Club to get access to our premium indicators including Buy The Dip, Advanced Market Moves and Take Profit.
Your VIP membership includes:
✓Full access to public & private forums
✓No Ads
✓Priority community support
✓Unlimited Postings
✓Premium thinkorswim indicators
✓Exclusive strategies, scanners, add-ons
✓Discord chatroom with Trade Alerts
AGAIG Trend Overall Simplified
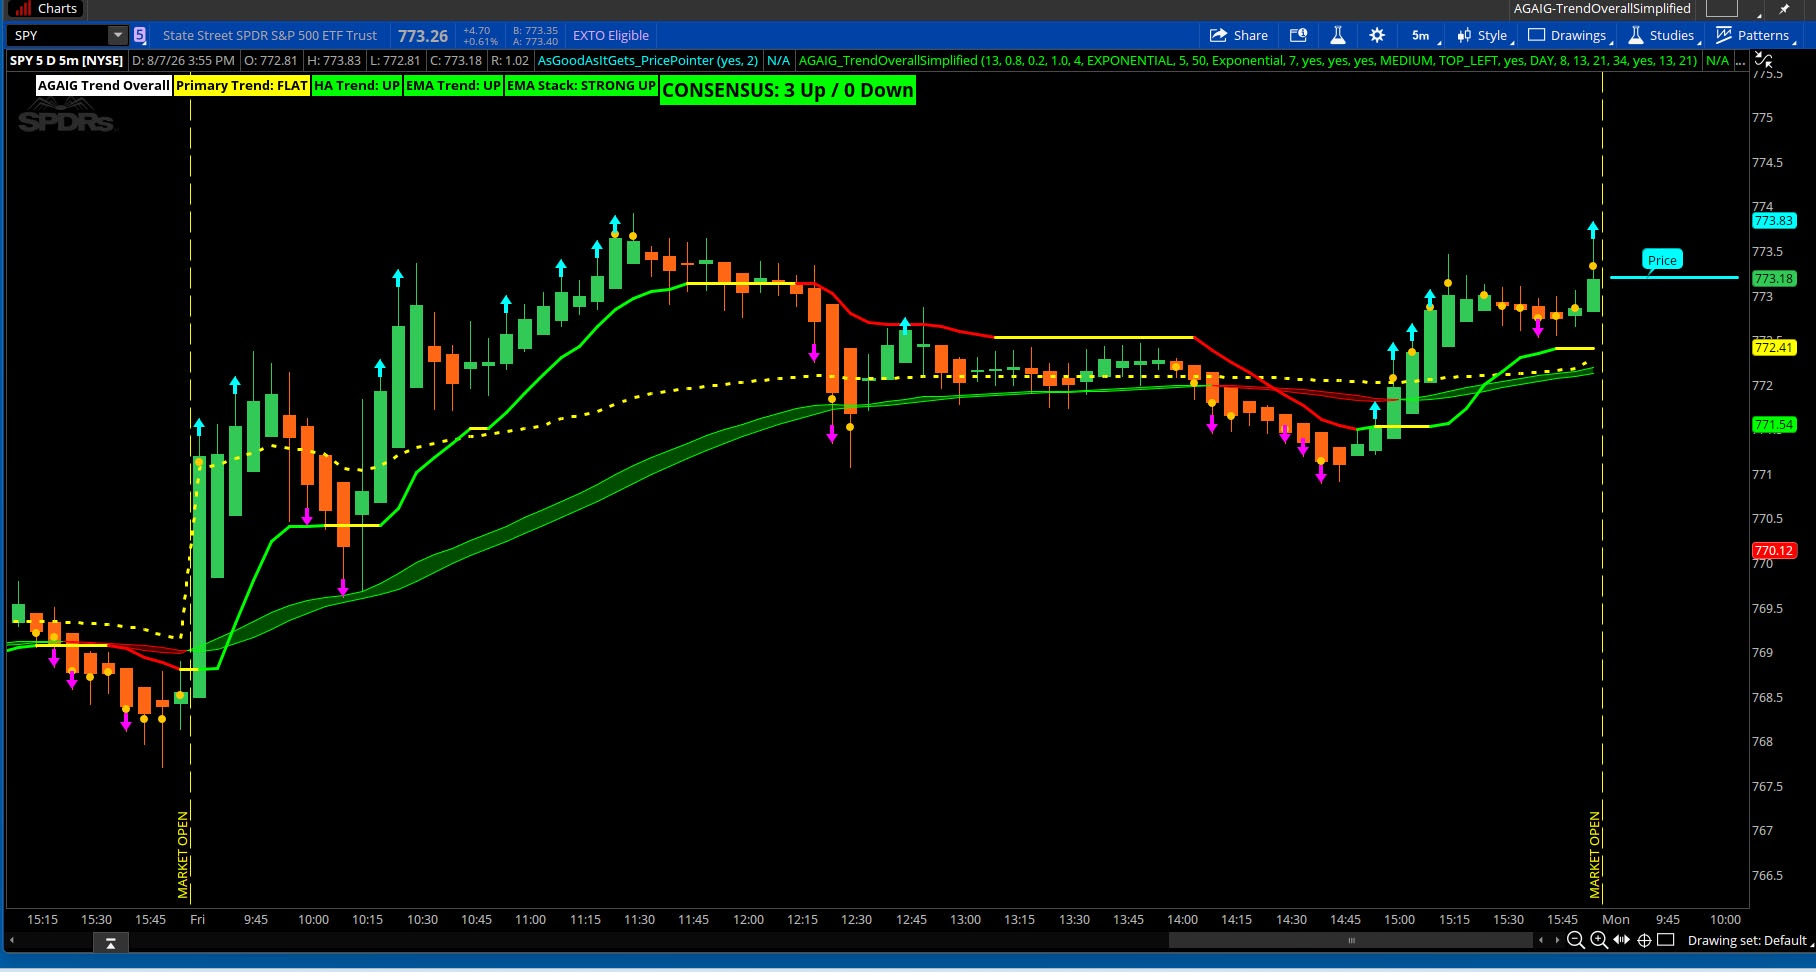
csricksdds shared:My goal is to continually simplify the decision process. In this indicator I am taking several parameters using consensus labels and minimal chart labels for decision making.
A few quick notes for how to actually use it day to day:
The DMI adaptive line (green/red) is your primary bias. Trade with its color, not against it — it's built to hug price closely in trends and flatten out in chop, so when it turns yellow, that's your cue to expect range-bound action, not a clean trend.
HA cloud = zone, not signal. Think of it as "which side of the fence are we on" context, not a trigger. Use it to filter — only take Buy arrows when the cloud is green, only take Sell arrows when it's red.
Volume dots mean the most when they line up with a STRONG EMA Stack read. A lone dot is just "volume was elevated." A dot next to STRONG UP/DOWN is real participation confirming an already-aligned trend — that's the higher-conviction setup.
Consensus label is a tiebreaker, not a trigger. It's most useful for staying out of the market — if it's sitting at 2-3 or 3-2, that's a "sit on hands" reading. 4-1 or 5-0 is when the whole stack agrees.
The Buy/Sell arrows are the most reactive part of the indicator (Super Trend cross + fractal RSI momentum), so they'll fire early and sometimes get faked out in chop — that's exactly why the Consensus and DMI line exist, to give you something slower to check them against before acting.
On 5-min charts, don't force it to react instantly — the HA cloud and EMA Stack are the "slow" reads here (4hr+ effective smoothing), so let them set direction and use the faster elements for timing entries within that direction, not for calling the trend itself.
Read more:
https://usethinkscript.com/threads/agaig-trend-overall-simplified-for-thinkorswim.22615/
FROM THE ARCHIVES |
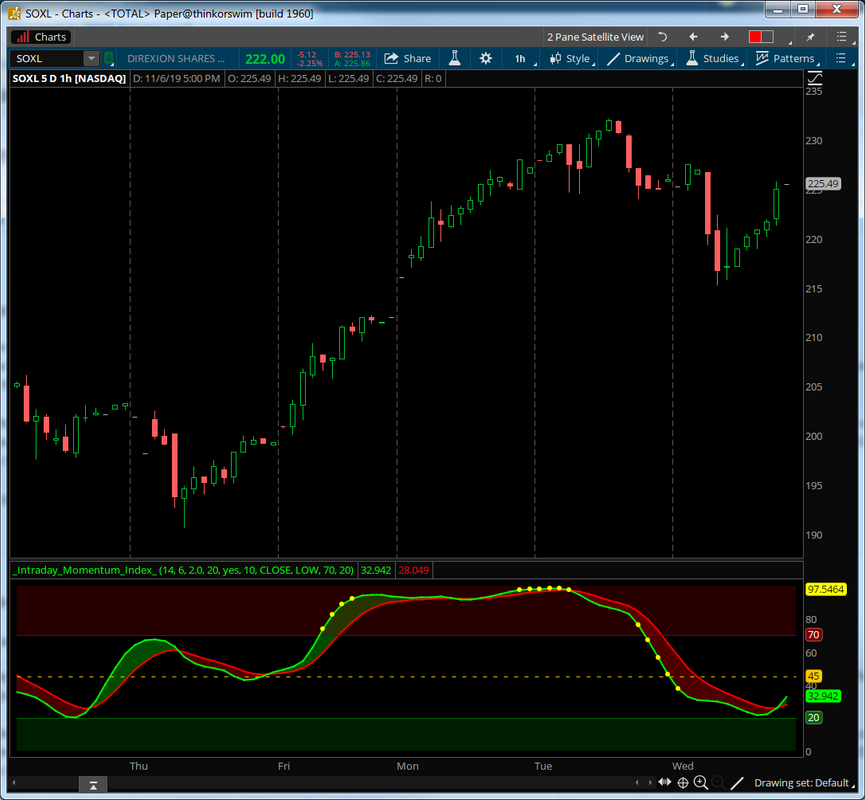
LazyBear's Intraday Momentum Index
netarchitech shared:Standard oscillators like the RSI or standard IMI often suffer from two major flaws on intraday timeframes: excessive noise/whipsaws on short aggs (1m–5m) and static overbought/oversold levels (70/20) that fail during strong trending moves.
This modified version of Tushar Chande’s Intraday Momentum Index (IMI) fixes both issues by layering:
» John Ehlers' SuperSmoother Filter – Removes high-frequency market noise without adding the lag typical of standard moving averages.
» Dynamic Volatility Bands – Runs Bollinger Bands over the smoothed IMI line to adapt extreme thresholds to current market volatility regimes.
Read more
https://usethinkscript.com/threads/lazybears-intraday-momentum-index-for-thinkorswim.999/
Last edited:

