



Scroll down to check out this week's must reads, carefully selected by uTS Moderators!

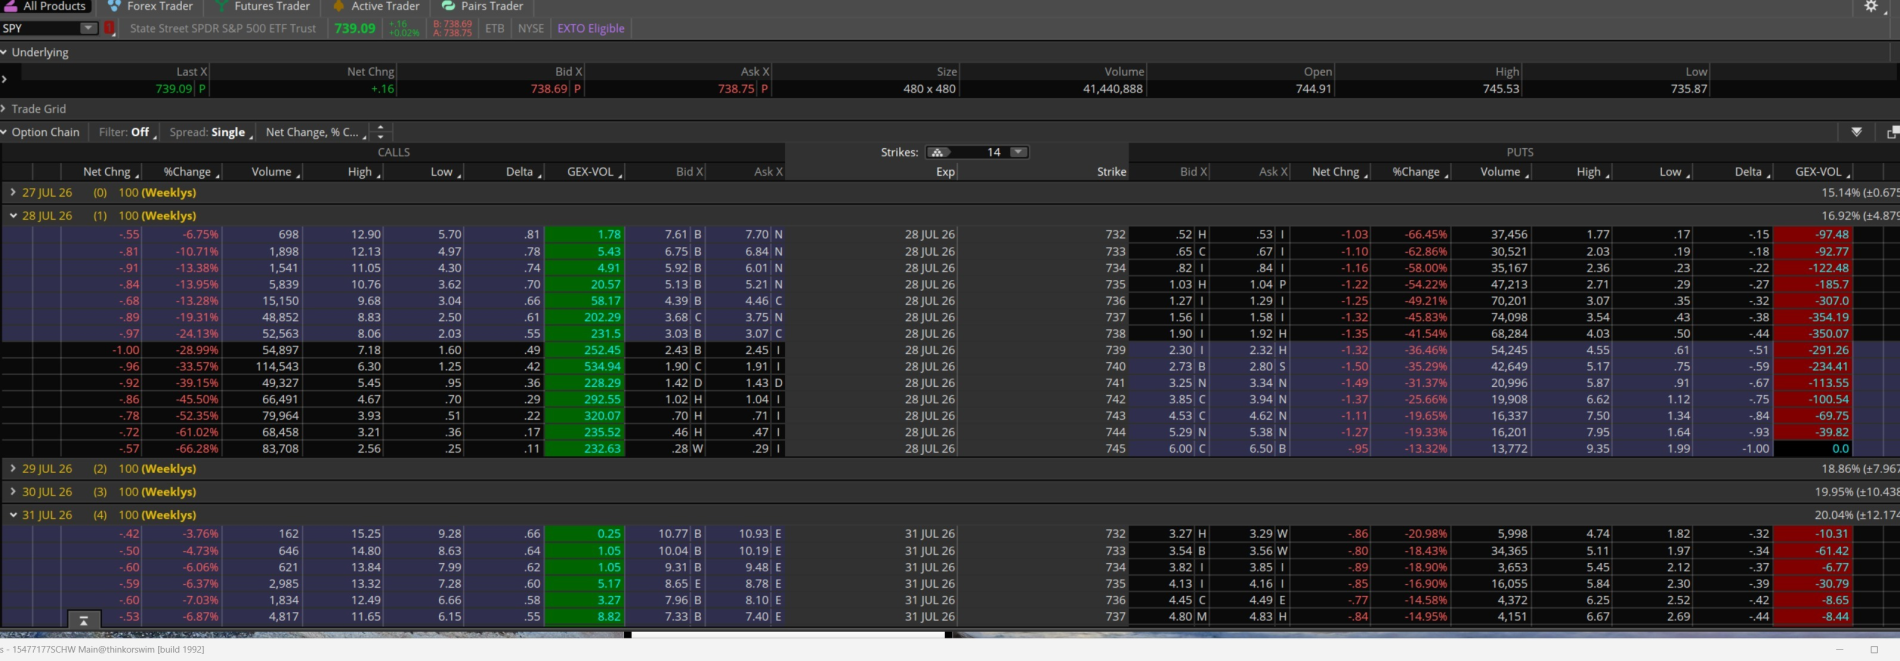
Gamma-Weighted Dollar Flow Proxy
Flyingbulldog said:This indicator provides a proxy for intraday gamma-weighted dollar flow occurring in the current option contract. It highlights where gamma-sensitive option trading activity is taking place today, which may reflect institutional activity and associated dealer hedging.
Read more:
https://usethinkscript.com/threads/gamma-weighted-dollar-flow-proxy-for-thinkorswim.22586/
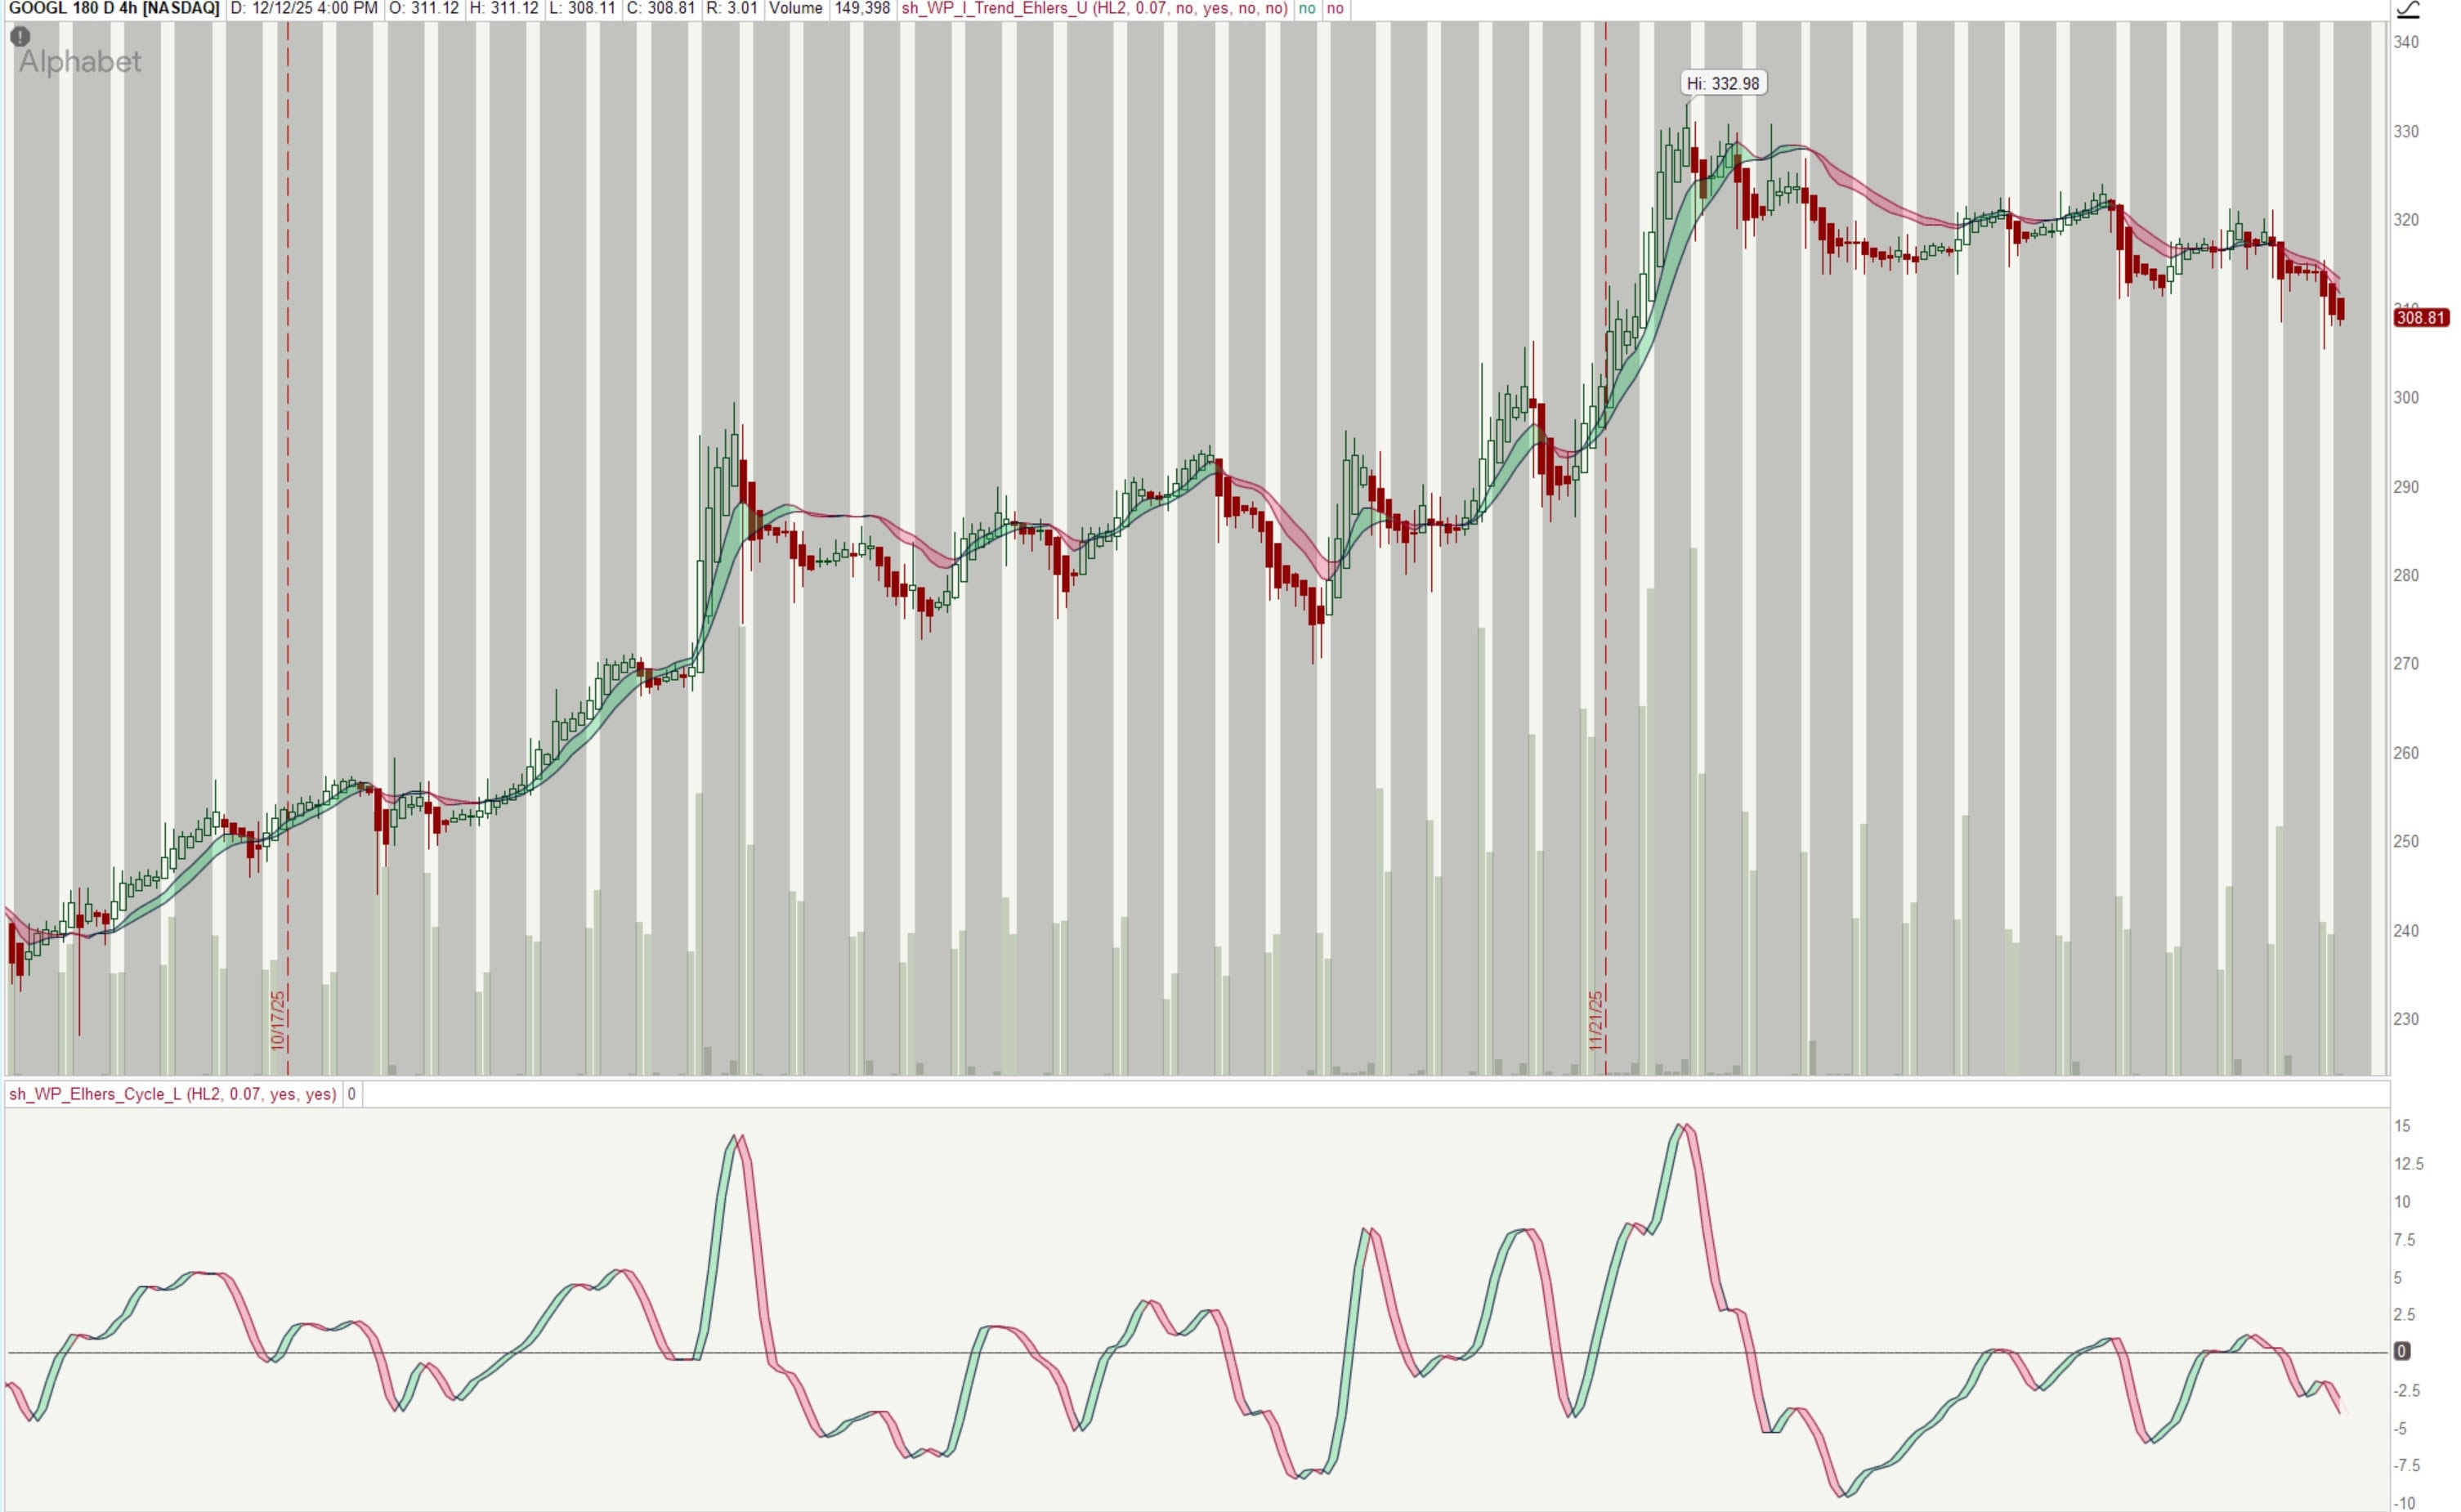
Ehlers Simple Cycle
wpnet50 said:The "Ehlers Simple Cycle" is a lower-panel ThinkOrSwim study (adapted from a LazyBear TradingView script) that plots John Ehlers' smoothed cycle calculation as two lines - the current cycle value and a one-bar-lagged version - around a zero baseline, with the area between them shaded green or red depending on which line is on top.
A bullish crossover (cycle line crossing above the lagging line, cloud turns green) signals the market entering the rising phase of its cycle, while a bearish crossover (cloud turns red) signals the falling phase; readings far from zero suggest the move may be nearing exhaustion, while readings near zero suggest a low-risk "reset" zone for a new entry.
The one adjustable input, a (default 0.07), is a smoothing factor - lower values make the indicator more sensitive/noisy, higher values make it smoother/laggier. In the thread's replies, users noted the oscillator's raw scale is unbounded (tied to the underlying's price) and tends to compress visually, so a follow-up "AI Enhanced" version was posted that normalizes the wave height and fixes the startup scaling for a cleaner display.
Read more:
https://usethinkscript.com/threads/ehlers-simple-cycle-for-thinkorswim.21928/
VIP SUBSCRIBERS ONLY |
DSMA VWAP For Entry/Exit Confirmation
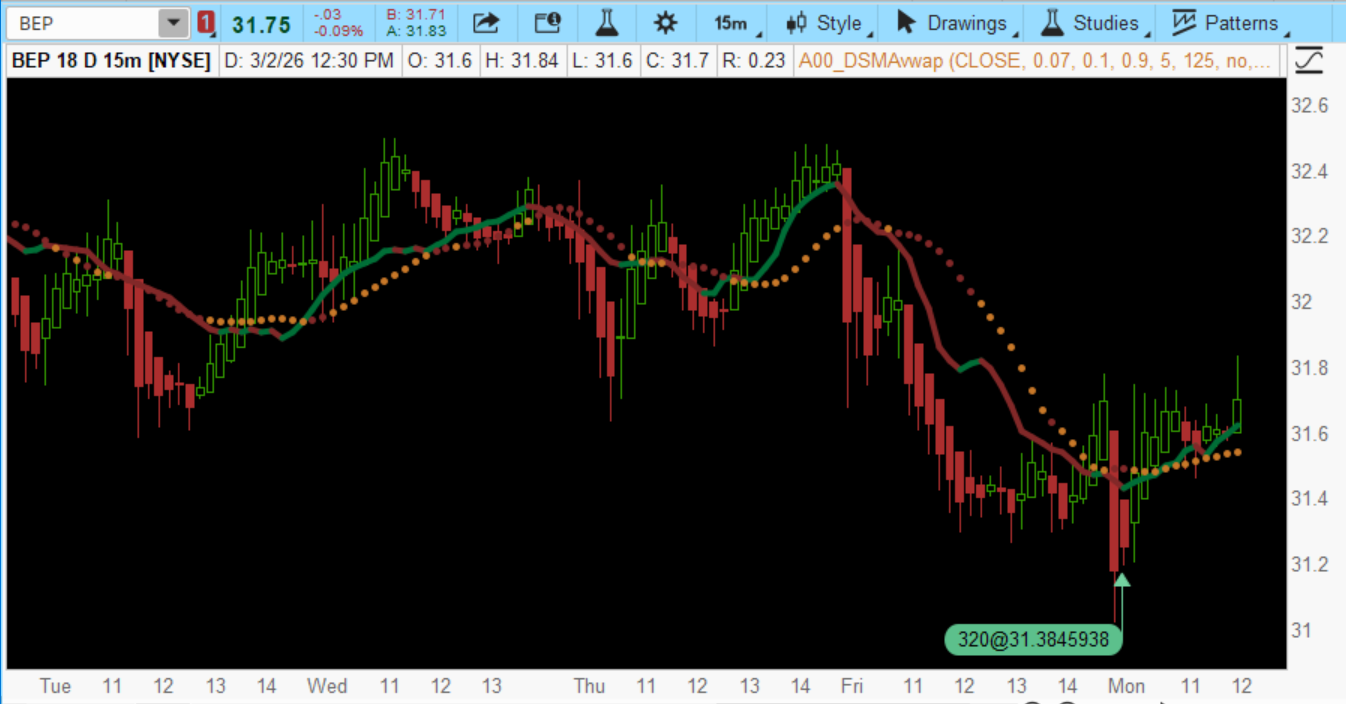
merryDay said:We use the interaction between DSMA, VWAP, and price because it tells us whether the auction is accepting or rejecting the current move
The interaction gives day traders a simple, visual, reliable way to classify the auction into alignment or conflict to know: when to longwhen to avoidwhen to exitand when the move is real vs. a trap.Each line measures a different dimension of market behavior:
- DSMA = trend behavior (speed, curvature, momentum).
- VWAP = value behavior (acceptance, rejection, migration)
- Price = auction behavior (where business is actually happening).
When two out of three align, you’re in a stable, high‑quality environment.
Read more
https://usethinkscript.com/threads/dsma-vwap-for-entry-exit-confirmation.22190/
Join our VIP Members Club to get access to our premium indicators including Buy The Dip, Advanced Market Moves and Take Profit.
Your VIP membership includes:
✓Full access to public & private forums
✓No Ads
✓Priority community support
✓Unlimited Postings
✓Premium thinkorswim indicators
✓Exclusive strategies, scanners, add-ons
✓Discord chatroom with Trade Alerts
VIP Membership
Reversal Trap Probability Bands
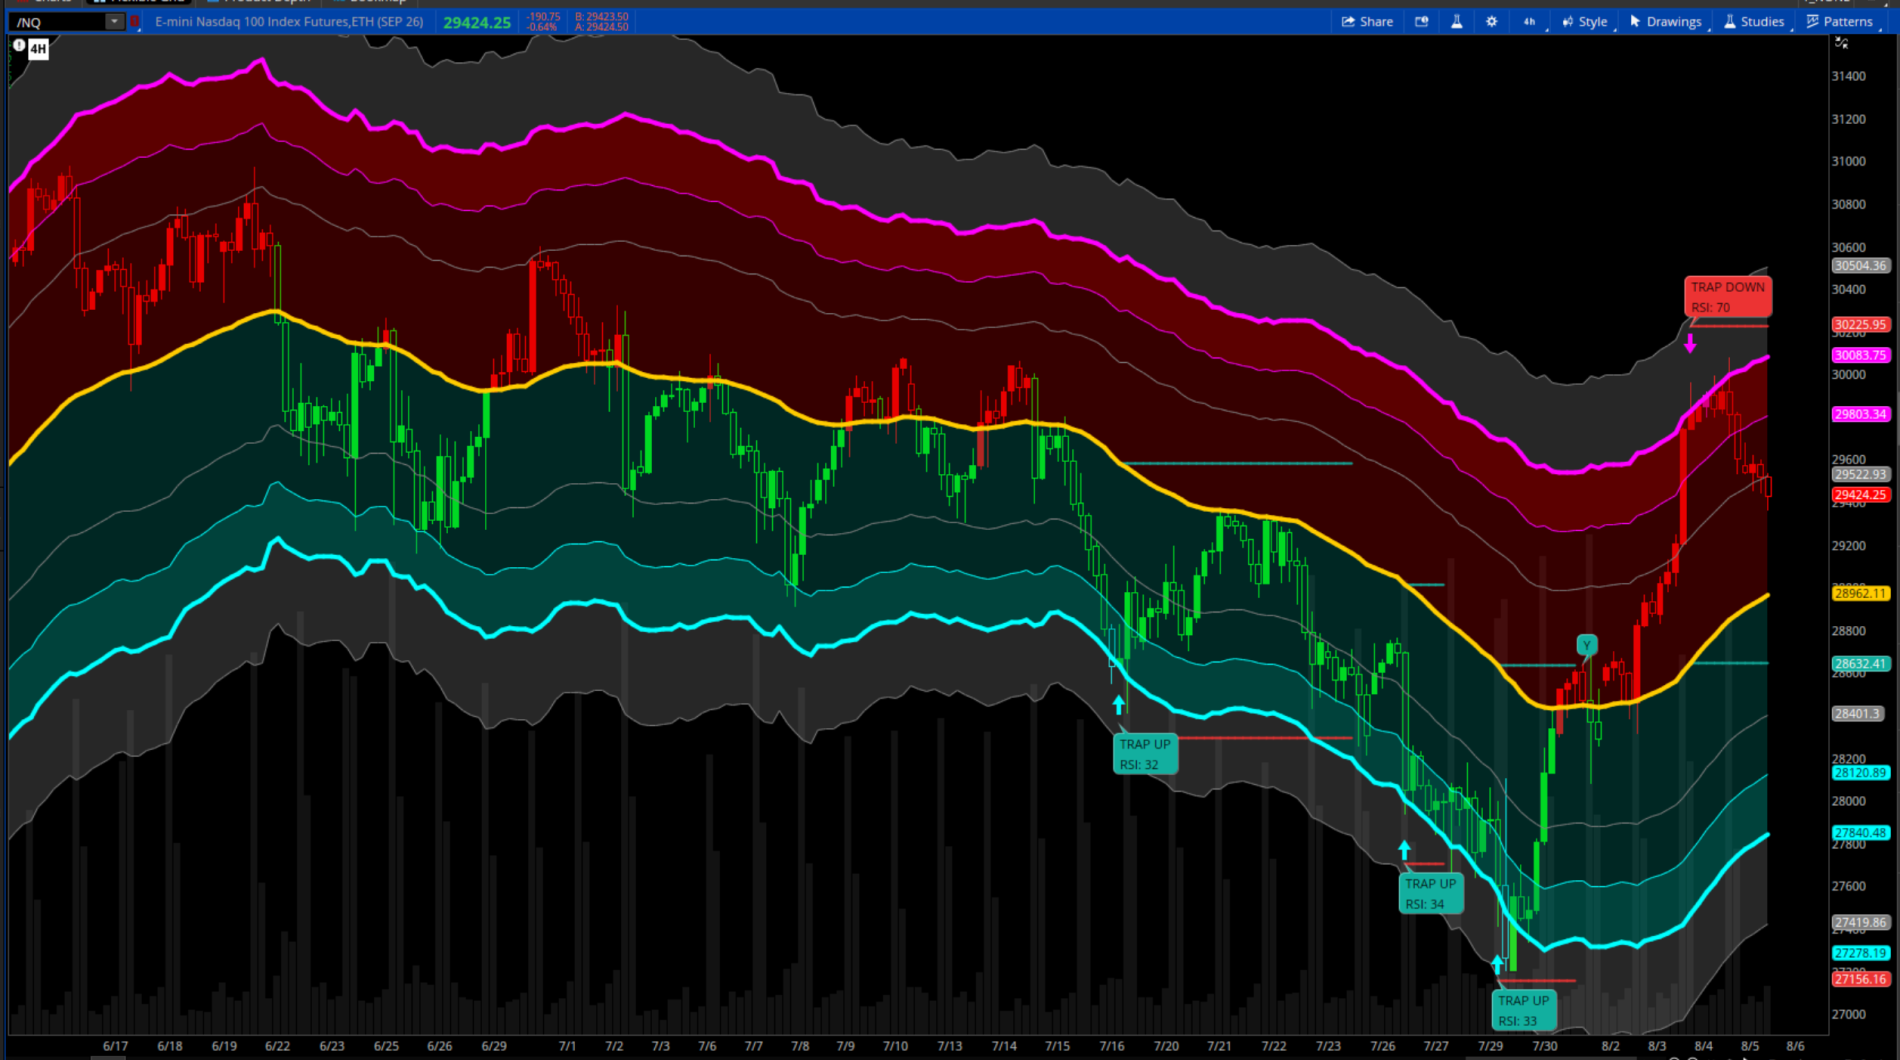
chewie76 shared:The Reversal Trap Probability Bands is an advanced technical indicator created by BigBeluga to identify and trade fakeout traps around market extremes. Traditional envelope or band indicators often fail because traders blindly enter breakouts that quickly reverse into whipsaw losses. In order to provide a solution to this problem, this indicator combines volatility-based envelope channels with a dynamic probability tracking engine, measuring historical RSI buckets to calculate real-time win probabilities for reversal traps.
The indicator aims to visualize institutional exhaustion and subsequent mean-reversion expansions. Candle colors, bubbles, and cloud coloring are all optional in the settings.
Read more:
https://usethinkscript.com/threads/reversal-trap-probability-bands-bigbeluga-for-thinkorswim.22604/
FROM THE ARCHIVES |
Donchian Channel with Fibonacci Zone Indicator
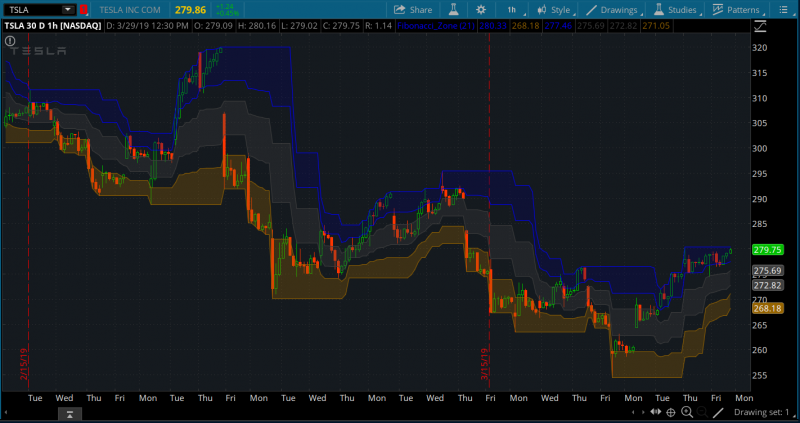
BenTen shared:For day traders, the primary challenge isn't finding entry signals—it's maintaining location awareness and avoiding bad risk-reward entries. The core goal is to avoid buying at the absolute top of a range and selling at the bottom.
Because this script dynamically anchors Fibonacci zones to a rolling 21-period Donchian Channel, it serves as an intuitive real-time location tool.
Read more
https://usethinkscript.com/threads/...-fibonacci-zone-indicator-for-thinkorswim.93/
Last edited:

