



Scroll down to check out this week's must reads, carefully selected by uTS Moderators!

Market Memory Levels
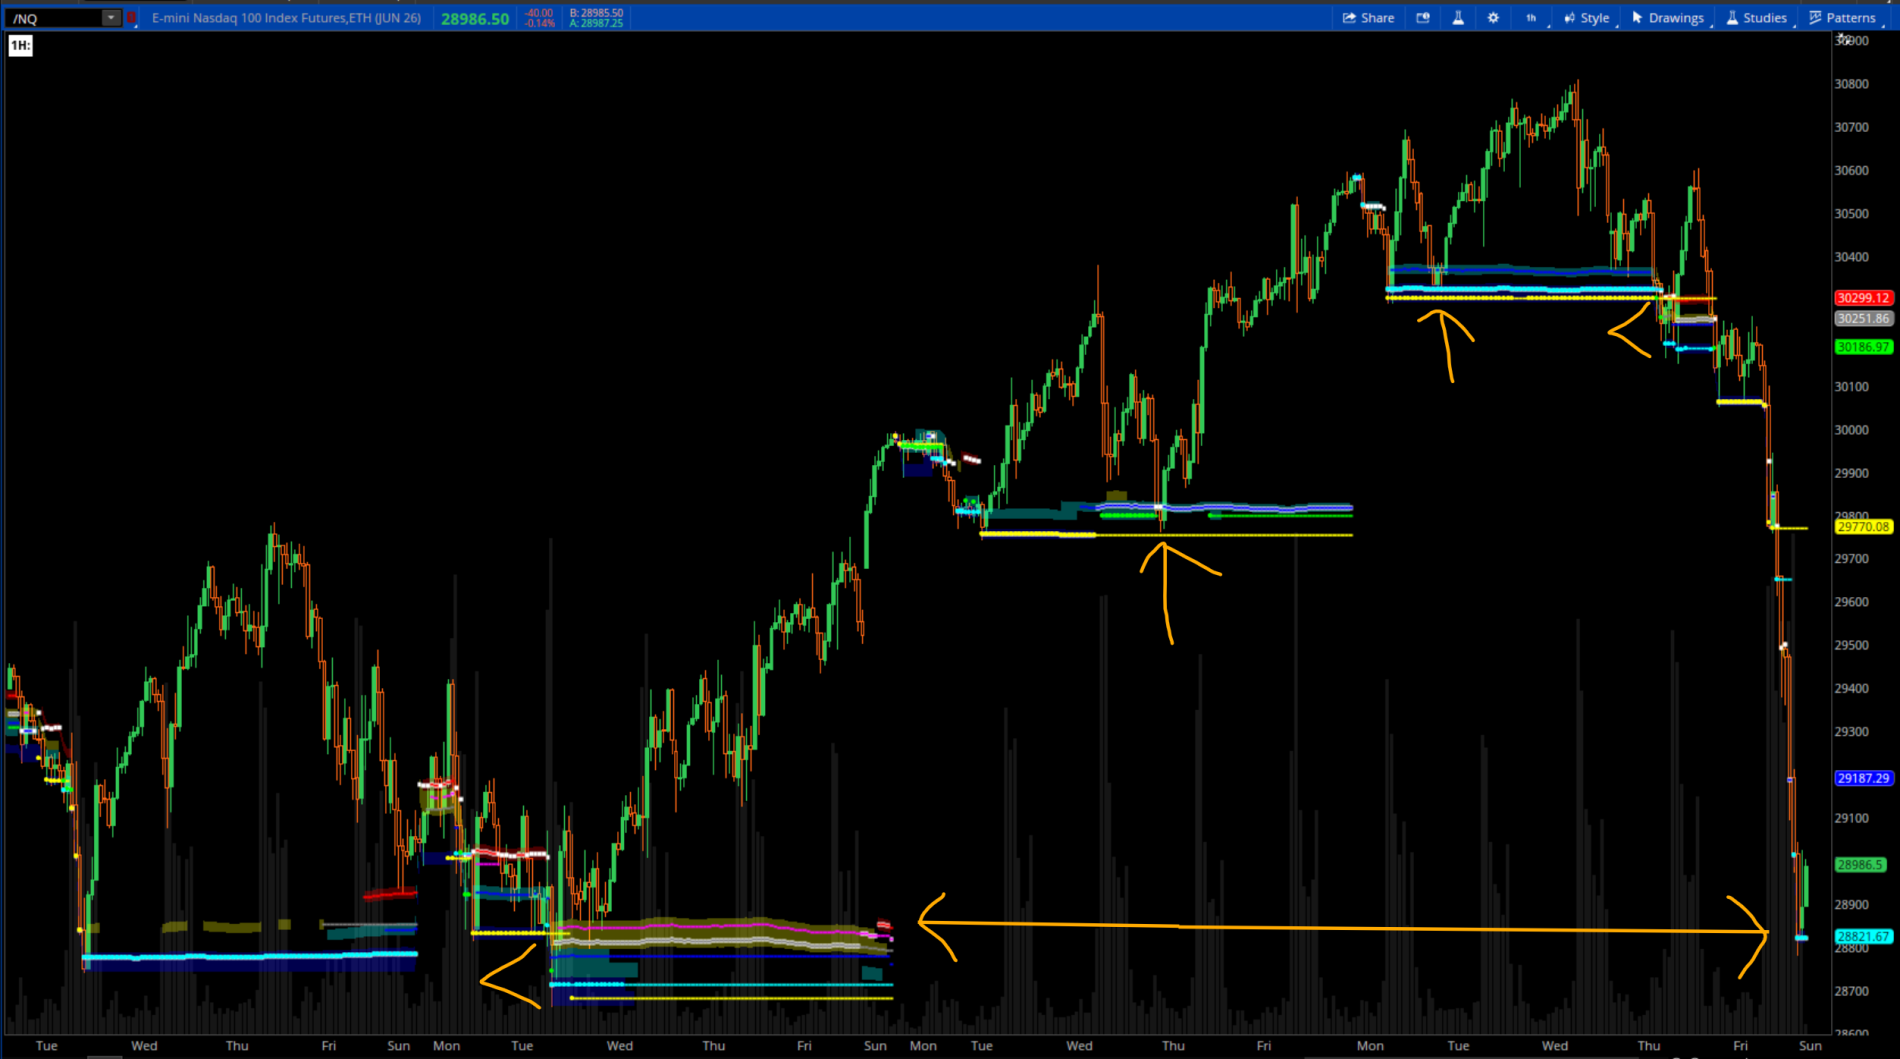
chewie76 said:Market Memory Levels is a higher-timeframe volume distribution indicator designed to identify price areas where the market has historically spent the greatest amount of time and volume. Rather than attempting to predict future price action, it highlights the levels that the market itself has repeatedly recognized as important.
Change the timeframe in settings based on your trading timeframe. WEEKLY is by default. If you're trading on a 30 minute or less chart, use DAILY. If you're trading on a daily chart, use MONTHLY.
The indicator builds a rolling volume profile within a selected higher timeframe (such as a week) and converts those areas of concentrated participation into horizontal "memory levels." These levels often act as natural support and resistance because they represent prices where buyers and sellers previously found agreement. The colors of the levels indicate strength of the retest. Red is a weak pullback, yellow is an average pullback, green is strong and cyan is an extreme pullback.
https://usethinkscript.com/threads/market-memory-levels-for-thinkorswim.22466/
NonRepainting AGAIG Intraday Optimizer Indicator
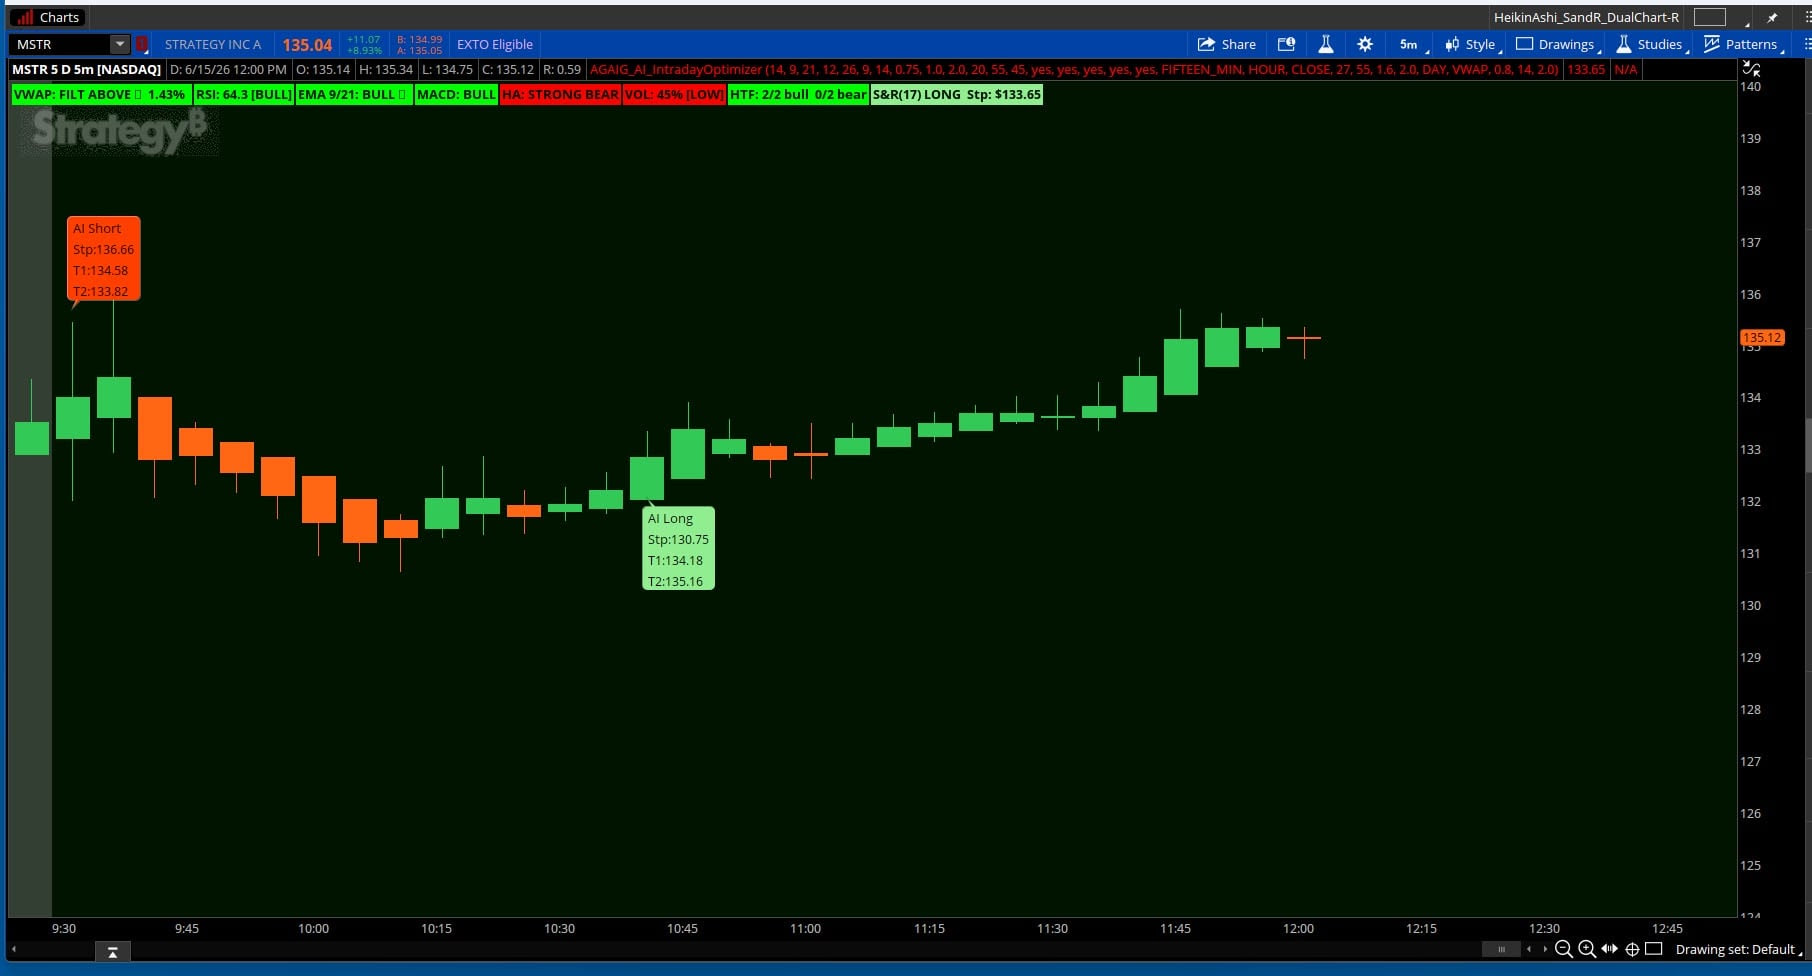
csricksdds said:Because of the HTF inputs the original
https://usethinkscript.com/threads/agaig-ai-intraday-optimiz...
has the ability to repaint. Here is a code version with HTF removed to take away the ability to repaint. Thanks to MerryDay the indicator is now cleaner, faster, and completely repaint free. Two proven signals, no stale data,, and no complexity that doesn't earn it's place?
https://usethinkscript.com/threads/...ay-optimizer-indicator-for-thinkorswim.22484/
VIP SUBSCRIBERS ONLY |
DCPv2/DSMA Trend & VWAP
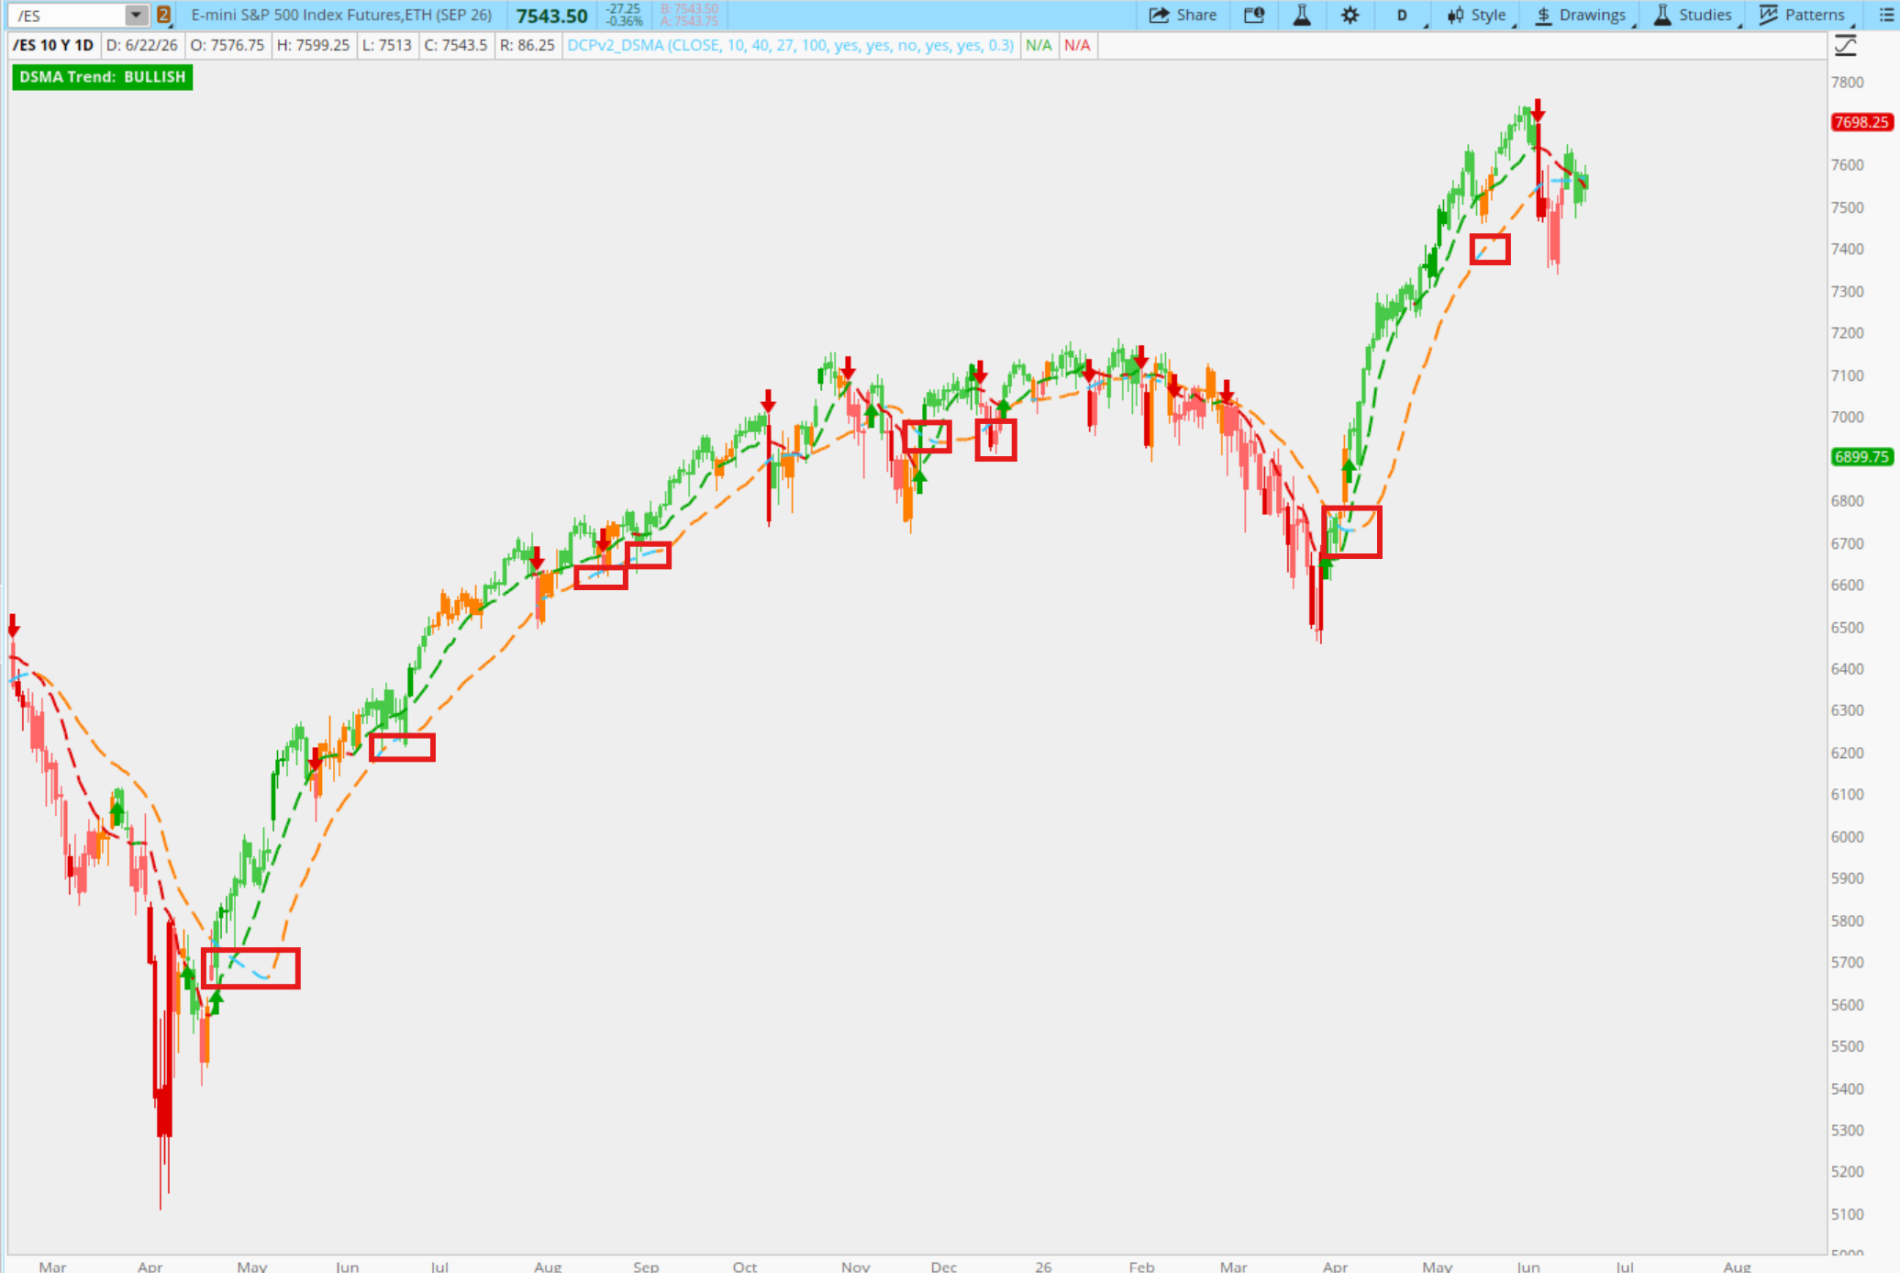
ᚱ ᛁ ᚢ ᛅ ᚱ ᛏ ᛁ ᛅ ᛋ said:After many months of working with DCP, I believe I have finally reached a comfortable stage with it.
This is Ehlers Dominant Cycle Period v2, which incorporates his latest Ehlers Reversion Index paper and study. I also included one of Merry’s go-to VWAP concepts from her cookbook, with an added CycleTrend component.
The general concept is rooted in the Reversion Index logic, which resonates with my personal approach to the stock market. I believe in buying cheap and selling expensive, but I converted that idea into a state machine and wait for price to trade above the LP.
VWAP adds another dimension to the setup. While it does not directly influence the buy and sell signals, it helps guide personal decisions on whether to play a reversal to the mean or a mean expansion move.
However, every time the VWAP turns blue, the battle is on. Watch closely for the reaction.
Read more
https://usethinkscript.com/threads/dcpv2-dsma-trend-vwap.22500/
Join our VIP Members Club to get access to our premium indicators including Buy The Dip, Advanced Market Moves and Take Profit.
Your VIP membership includes:
✓Full access to public & private forums
✓No Ads
✓Priority community support
✓Unlimited Postings
✓Premium thinkorswim indicators
✓Exclusive strategies, scanners, add-ons
✓Discord chatroom with Trade Alerts
VIP Membership
Price Plotting Reverse RSI
cando13579 shared:Most traders use RSI as a traditional oscillator:
Above 70 = overbought
Below 30 = oversold
Around 50 = directional bias
But standard RSI has one major limitation:
It tells you where momentum is — not where price must go for momentum to change.
A Reverse Engineered RSI solves that problem.
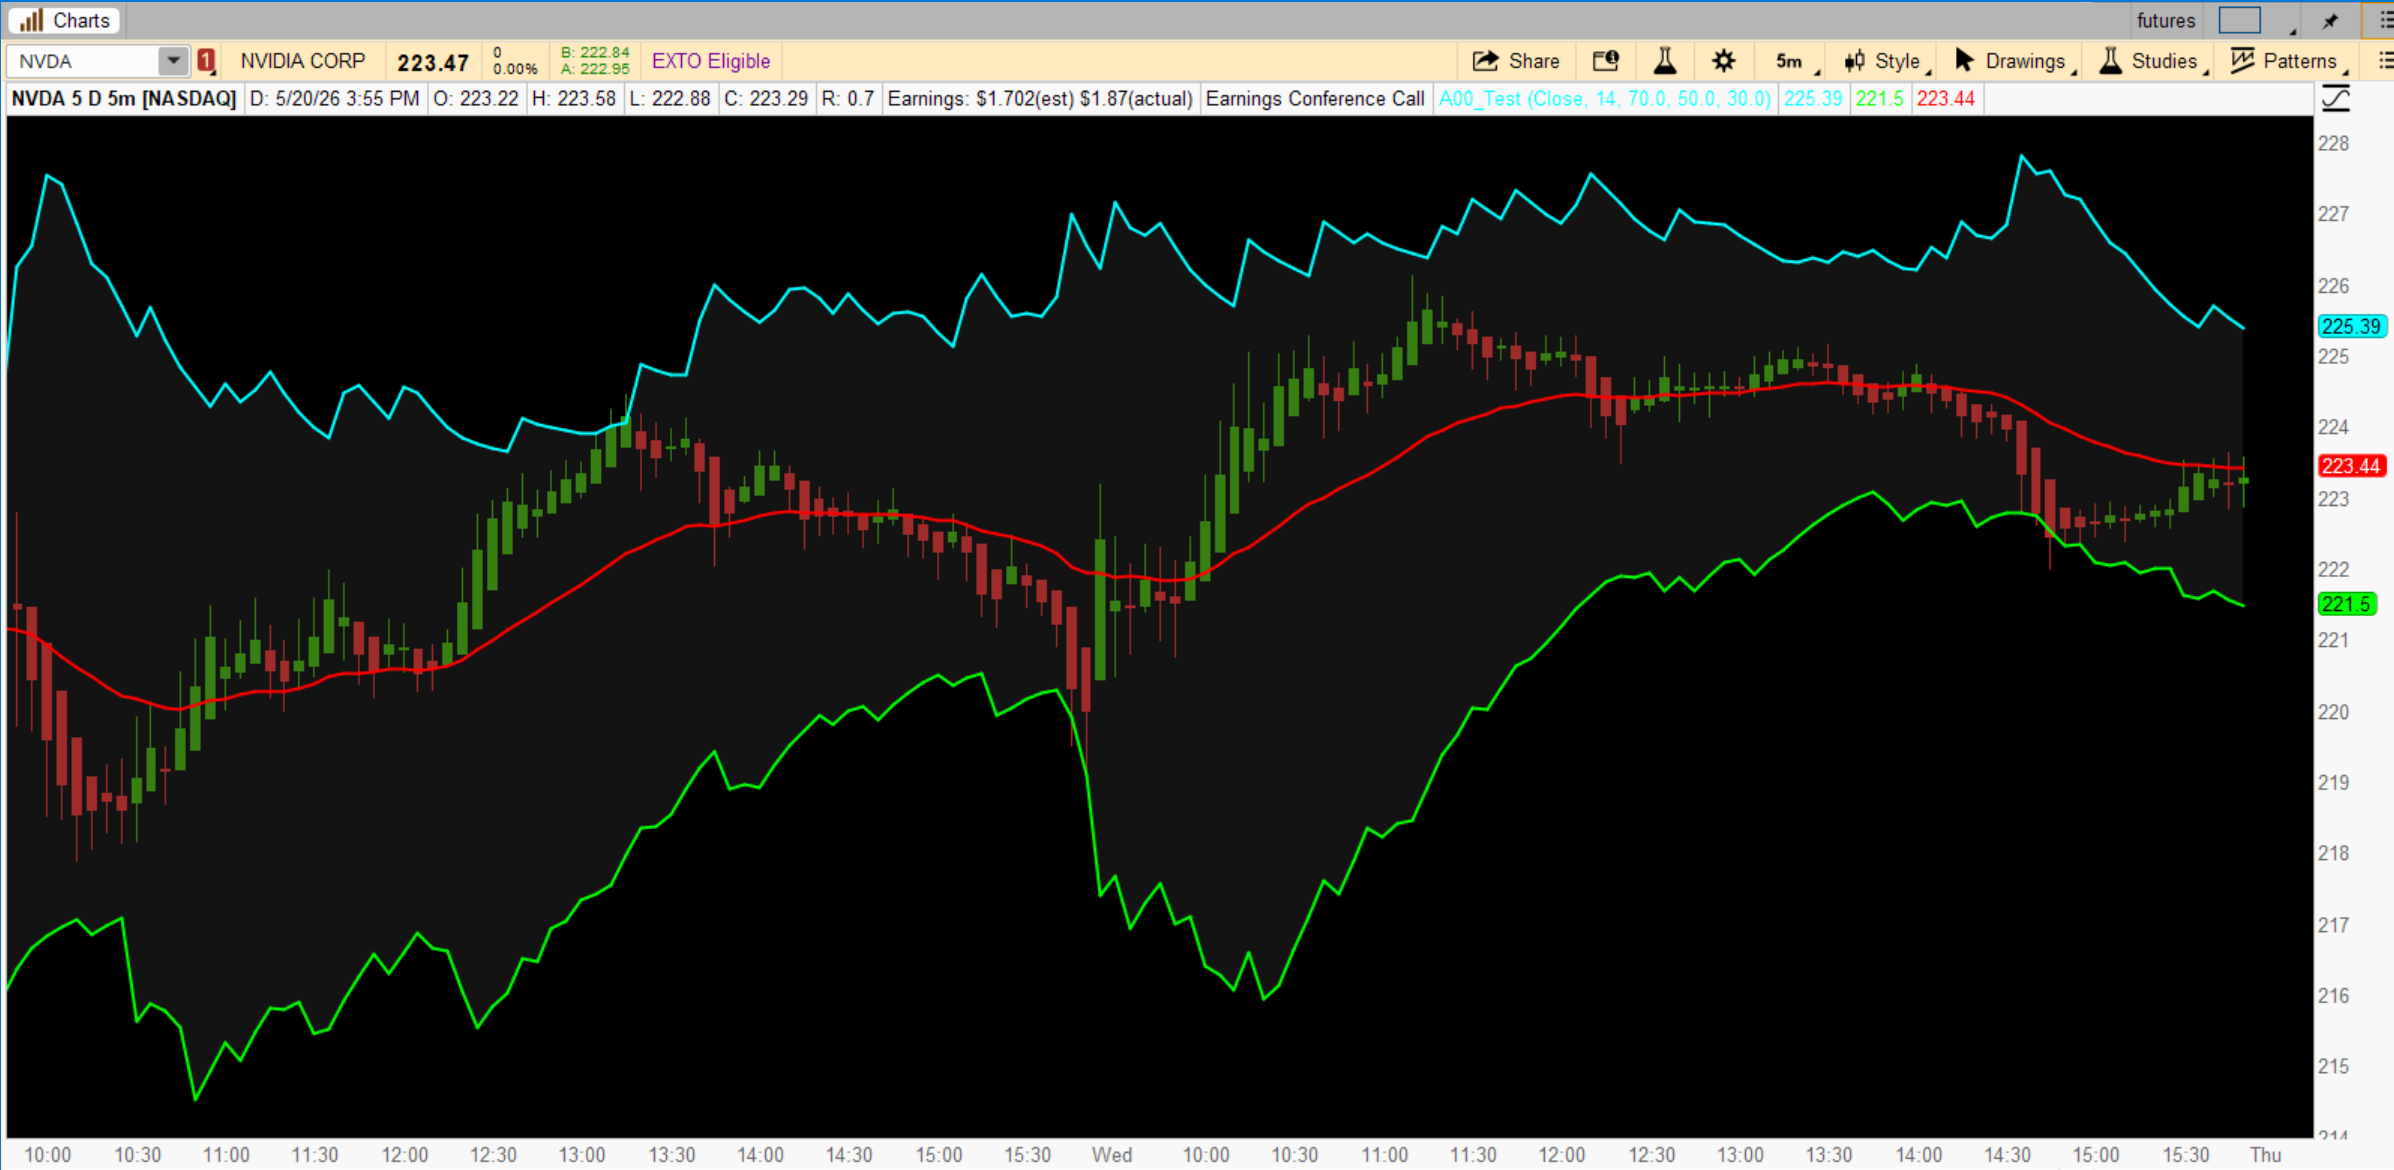
Instead of plotting RSI values in a lower panel, the indicator mathematically projects the exact price levels required for RSI to reach key thresholds such as:
RSI 70
RSI 50
RSI 30
This effectively converts momentum analysis into actionable price levels directly on the chart.
https://usethinkscript.com/threads/price-plotting-reverse-rsi-for-thinkorswim.22432/
FROM THE ARCHIVES |
Financial Fundamentals Labels
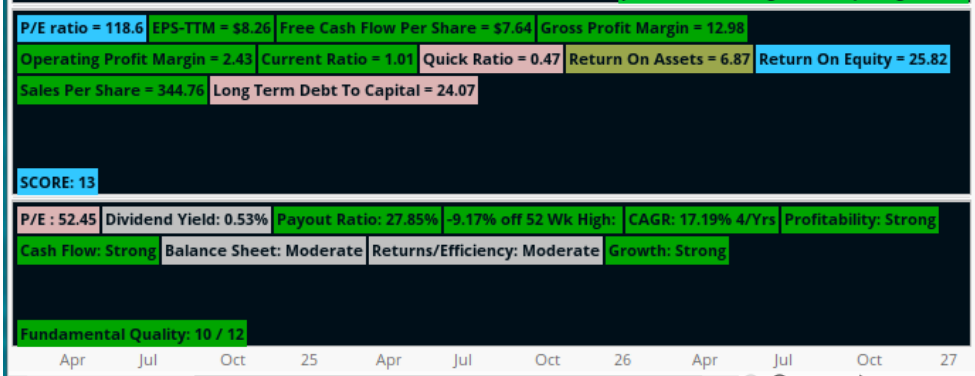
merryDay shared:For trading: the real edge with fundamentals is getting the bigger picture context.
Is this a real business with durable revenue or a story stock
Is it consistently profitable or burning cash
Is its PE overextended compared to its competitors.
You combine that context with what you see on the tape. Stocks with stable fundamentals will have more stable trends.
Fundamentals help you decide which names you focus on, how you size, and what kind of behavior to expect.
Fundamentals don’t give you entries
They keep you from treating every ticker like it’s the same kind of animal
An overall weighted Score is calculated to gauge the overall financial health.
Use on a Daily Chart. Useful for anyone interested in fundamental stock research.
Read more
https://usethinkscript.com/threads/financial-fundamentals-labels-for-thinkorswim.5308/
Last edited:

