# Mobius Supertrend Volume Waves PLUS Welkin Volume Labels
# V01.2020
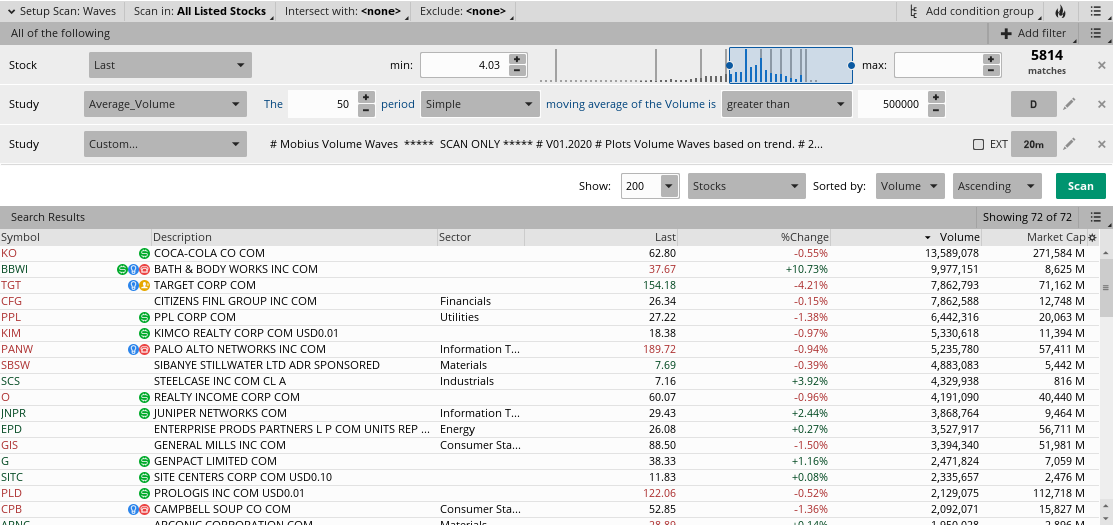
# Plots Volume Waves based on trend.
declare lower;
input n = 6;
input AvgType = AverageType.HULL;
input ATRmult = .7;
def h = high;
def l = low;
def c = close;
def v = volume;
DefineGlobalColor("Ascending", CreateColor(0, 165, 0));
DefineGlobalColor("descending", CreateColor(225, 0, 0));
DefineGlobalColor("avg", Color.CYAN);
def ATR = MovingAverage(AvgType, TrueRange(h, c, l), n);
def DN = HL2 + (AtrMult * ATR);
def UP = HL2 + (-AtrMult * ATR);
def cond = if c < cond[1]
then DN
else UP;
def accumulation = cond == UP;
def distribution = cond == DN;
def w1 = if accumulation and !accumulation[1]
then v
else if accumulation
then w1[1] + v
else Double.NaN;
def w2 = if distribution and !distribution[1]
then v
else if distribution
then w2[1] + v
else Double.NaN;
plot waves1 = w1;
waves1.SetPaintingStrategy(PaintingStrategy.HISTOGRAM);
waves1.SetDefaultColor(GlobalColor("Ascending"));
waves1.SetLineWeight(5);
plot waves2 = w2;
waves2.SetPaintingStrategy(PaintingStrategy.HISTOGRAM);
waves2.SetDefaultColor(GlobalColor("Descending"));
waves2.SetLineWeight(5);
def SD = StDevAll(v);
plot avg = (HighestAll(w1/2)+highestAll(w2/2))/n ;
avg.SetDefaultColor(GlobalColor("avg"));
avg.SetLineWeight(3);
# End Code
#Advanced Volume Study
#[email protected]
#v5.22.2020
input AvgDayVolLength = 5;
input AvgVolLength = 20;
input ShowDayVolLabel = yes;
input ShowBarVolLabel = yes;
input ShowBuySellStrength = yes;
input VolAverageType = AverageType.SIMPLE;
input RelativetoPrevVolTolerance = 1.25; #if volume is 1.25x greater than previous bar it will paint even if it is still below the average/sigma2/sigma3
def NA = Double.NaN;
def PriceRange = high - low;
def TopShadowRange = if open >= close then high - open else high - close;
def BottomShadowRange = if open <= close then open - low else close - low;
def BodyRange = PriceRange - (TopShadowRange + BottomShadowRange);
def VolumeTopShadowValue = (1 - (TopShadowRange / PriceRange)) * volume;
def VolumeBottomShadowValue = ((BottomShadowRange / PriceRange) * volume);
def BodyRangeVolValue = ((BodyRange + BottomShadowRange) / PriceRange) * volume;
def DayVolAgg = if GetAggregationPeriod() < AggregationPeriod.DAY then AggregationPeriod.DAY else GetAggregationPeriod();
def DayVol = volume("period" = DayVolAgg);
def AvgDayVol = Average(DayVol, AvgDayVolLength);
def Start = 0930;
def End = 1600;
def conf = SecondsFromTime(Start) >= 0 and SecondsFromTime(End) <= 0;
plot VolColor = NA;
VolColor.DefineColor("Bullish", Color.GREEN);
VolColor.DefineColor("Bearish", Color.RED);
VolColor.DefineColor("VolAvg", CreateColor(0, 100, 200));
VolColor.DefineColor("VolSigma2", Color.DARK_ORANGE);
VolColor.DefineColor("VolSigma3", Color.MAGENTA);
VolColor.DefineColor("Relative to Prev", Color.YELLOW);
VolColor.DefineColor("Below Average", Color.GRAY);
#Current Candle Buy and Sell Strength
def BuyStr = ((close - low) / PriceRange) * 100;
def SellStr = ((high - close) / PriceRange) * 100;
def BuyVol = (BuyStr / 100) * volume;
def SellVol = (SellStr / 100) * volume;
def Vol = volume;
def VolAvg = MovingAverage(VolAverageType, volume, AvgVolLength);
#2Sigma and 3Sigma Vol Filter
def Num_Dev1 = 2.0;
def Num_Dev2 = 3.0;
def averageType = AverageType.SIMPLE;
def sDev = StDev(data = Vol, length = AvgVolLength);
def VolSigma2 = VolAvg + Num_Dev1 * sDev;
def VolSigma3 = VolAvg + Num_Dev2 * sDev;
def RelDayVol = DayVol / AvgDayVol[1];
def RelPrevDayVol = DayVol / volume("period" = DayVolAgg)[1];
#Daily aggregation volume labels
AddLabel(if GetAggregationPeriod() >= AggregationPeriod.DAY then 0 else if ShowDayVolLabel then 1 else 0, "DayVol: " + DayVol + " / " + Round(RelDayVol, 2) + "x Avg(" + AvgDayVolLength + ") / " + Round(RelPrevDayVol, 2) + "x Prev", if DayVol > AvgDayVol then VolColor.Color("VolAvg") else VolColor.Color("Below Average"));
def RelVol = Vol / VolAvg[1];
def RelPrevVol = volume / volume[1];
#Triangle Vol Signal
def VolSignal = if Vol > VolSigma3 then volume else if Vol > VolSigma2 then volume else if Vol > VolAvg then volume else if RelPrevVol >= RelativetoPrevVolTolerance then volume else NA;
#current aggregation's volume labels
AddLabel(ShowBarVolLabel, "Vol: " + volume + " / " + Round(RelVol, 2) + "x Avg(" + AvgVolLength + ") / " + Round(RelPrevVol, 2) + "x Prev", if Vol > VolSigma3 then VolColor.Color("VolSigma3") else if Vol > VolSigma2 then VolColor.Color("VolSigma2") else if Vol > VolAvg then VolColor.Color("VolAvg") else VolColor.Color("Below Average"));
DefineGlobalColor("LabelGreen", CreateColor(0, 165, 0)) ;
#current candle Buy/Sell strength labels
AddLabel(if ShowBuySellStrength then 1 else 0, " ", Color.BLACK);
AddLabel(if ShowBuySellStrength then 1 else 0, "1", Color.GRAY);
AddLabel(if ShowBuySellStrength then 1 else 0, "Sell " + Round(SellStr, 2) + "%", if SellStr > BuyStr then Color.RED else Color.DARK_RED);
AddLabel(if ShowBuySellStrength then 1 else 0, "Buy " + Round(BuyStr, 2) + "%", if BuyStr > SellStr then GlobalColor("LabelGreen") else Color.DARK_GREEN);