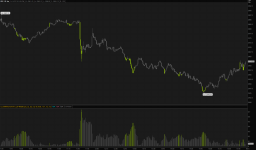
The Williams’ VIX Fix indicator helps to measure volatility for individual stocks, similar to how the VIX does for the S&P 500 Index. Williams Vix Fix also includes a 20 Bollinger Bands indicating extremes in the signal line.
Some traders believe the Vix Fix indicator can find market bottoms in all instruments.

Some traders believe the Vix Fix indicator can find market bottoms in all instruments.
thinkScript Code
Rich (BB code):
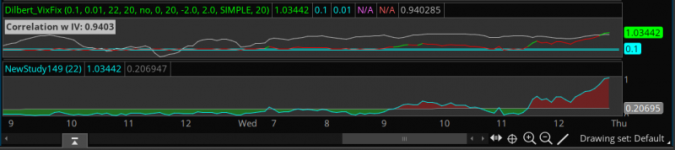
#Dilbert_VixFix
# V1.0 - 052816 - Dilbert - 1st code cut
# VixFix is a pretty close approximation to the standard VIX or implied volatility. It can be used on intraday chart aggregations, and on symbols that do not have options. When VixFIX spikes high it provides some pretty good buy signals.
input OverSold = .1; # .1 good for SPY 1 day 1 minute chart
input OverBought = .01; # .01 good for SPY 1 day 1 minute chart
input LengthVF = 22;
input LengthMA = 20;
declare lower;
def C = close;
def L = low;
plot VixFix = (Highest (C, LengthVF) - L) / (Highest (C, LengthVF)) * 100;
#VixFix.AssignValueColor(Color.GREEN);
plot OS = OverSold;
OS.AssignValueColor(Color.CYAN);
plot OB = OverBought;
OB.AssignValueColor(Color.CYAN);
Alert(VixFix crosses above OverSold, "VixFIX crosses above OverSold", Alert.Bar, Sound.Ring);
#Alert(VixFix > OverSold, "VixFIX > OverSold", Alert.TICK, Sound.Ring);
# BollingerBands code
input ShowBollingerBands = No;
input displace = 0;
input BBlength = 20;
input Num_Dev_Dn = -2.0;
input Num_Dev_up = 2.0;
input averageType = AverageType.Simple;
def sDev = stdev(data = VixFix[-displace], length = BBlength);
def MidLine = MovingAverage(averageType, data = VixFix[-displace], length = BBlength);
def LowerBand = MidLine + num_Dev_Dn * sDev;
def UpperBand = MidLine + num_Dev_Up * sDev;
plot LB = if ShowBollingerBands then LowerBand else Double.NaN;
plot UB = if ShowBollingerBands then UpperBand else Double.NaN;
LB.SetDefaultColor(GetColor(0));
UB.SetDefaultColor(GetColor(5));
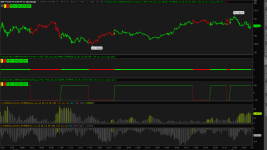
VixFix.AssignValueColor(if VixFix > UpperBand then Color.Green else Color.Red);
input corrLength = 20;
def correlationWith = ImpVolatility();
plot CorrelationIV = correlation(VixFix, correlationWith, corrLength);
CorrelationIV.SetDefaultColor(color.light_gray);
addlabel(yes, "Correlation w IV: "+ correlationIV,color.light_gray);Shareable Link
https://tos.mx/yAq7s5thinkScript Code (Mobius)
Rich (BB code):
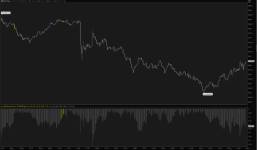
# Williams_Vix_Fix
# Mobius
# Addition of mean for easier reading.
# V01.2016
declare lower;

input n = 22;
plot WVF = (Highest (Close, n) - Low) / (Highest(Close, n)) * 100;
     WVF.SetDefaultColor(Color.Cyan);

plot mean = inertiaAll(WVF);
     mean.SetDefaultColor(Color.Gray);

addCloud(mean, WVF, color.green, color.red);

# End Code Williams Vix Fix
Shareable Link
https://tos.mx/5HigXDAttachments
Last edited:
")