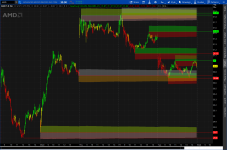
This Support/Resistance study is based on pivots and ATR.
The Average True Range is a practical tool for drawing lines in order to obtain better orientation in intraday charts.
The combination of the ATR levels with the pivot lines often shows that the lines coincide.
Change the n to get zones for the time you wish.
Update: ATR is now straight lines and user can input ATR multiple.
New share: https://tos.mx/Lv0FsZi

https://tos.mx/VeGhwv
The Average True Range is a practical tool for drawing lines in order to obtain better orientation in intraday charts.
The combination of the ATR levels with the pivot lines often shows that the lines coincide.
Change the n to get zones for the time you wish.
Update: ATR is now straight lines and user can input ATR multiple.
New share: https://tos.mx/Lv0FsZi
https://tos.mx/VeGhwv
Code:
# Support/Resistance Zones around pivot S/R points.
#Added the zones using ATR to the Theotrade Pivots study.
#Additions by Horserider 9/30/2019

input length = 252;
input averageType = AverageType.WILDERS;

def ATR = MovingAverage(averageType, TrueRange(high, close, low), length);

# User Inputs
input n = 21; #hint n: periods used for pivot calculations.
def Num_Dev_Dn = ATR;
def Num_Dev_up = -ATR;


# Internal Script Reference
script LinePlot {
    input BarID = 0;
    input Value = 0;
    input BarOrigin = 0;
    def ThisBar = HighestAll(BarOrigin);
    def ValueLine = if BarOrigin == ThisBar
                then Value
                else Double.NaN;
    plot P = if ThisBar - BarID <= BarOrigin
             then HighestAll(ValueLine)
             else Double.NaN;
}
# Variables
def o = open;
def h = high;
def l = low;
def c = close;
def bar = BarNumber();
def BBar = bar == HighestAll(bar);
# Parent High
def ParentHigh = HighestAll(h);
def ParentHBarOrigin = if h == ParentHigh
                       then bar
                       else ParentHBarOrigin[1];
def ParentHBarID = bar - HighestAll(ParentHBarOrigin);
# R1
def hh = fold i = 1 to n + 1
         with p = 1
         while p
         do h > GetValue(h, -i);
def PivotH = if (bar > n and
                 h == Highest(h, n) and
                 hh)
            then h
            else Double.NaN;
def PHValue = if !IsNaN(PivotH)
              then PivotH
              else PHValue[1];
def PHBarOrigin = if !IsNaN(PivotH)
                  then bar
                  else PHBarOrigin[1];
def PHBarID = bar - PHBarOrigin;
# R2
def R2PHValue = if PHBarOrigin != PHBarOrigin[1]
              then PHValue[1]
              else R2PHValue[1];
def R2PHBarOrigin = if PHBarOrigin != PHBarOrigin[1]
                  then PHBarOrigin[1]
                  else R2PHBarOrigin[1];
def R2PHBarID = bar - R2PHBarOrigin;
# R3
def R3PHValue = if R2PHBarOrigin != R2PHBarOrigin[1]
              then R2PHValue[1]
              else R3PHValue[1];
def R3PHBarOrigin = if R2PHBarOrigin != R2PHBarOrigin[1]
                  then R2PHBarOrigin[1]
                  else R3PHBarOrigin[1];
def R3PHBarID = bar - R3PHBarOrigin;
# R4
def R4PHValue = if R3PHBarOrigin != R3PHBarOrigin[1]
              then R3PHValue[1]
              else R4PHValue[1];
def R4PHBarOrigin = if R3PHBarOrigin != R3PHBarOrigin[1]
                  then R3PHBarOrigin[1]
                  else R4PHBarOrigin[1];
def R4PHBarID = bar - R4PHBarOrigin;

# Parent Low
def ParentLow = LowestAll(l);
def ParentLBarOrigin = if l == ParentLow
                       then bar
                       else ParentLBarOrigin[1];
def ParentLBarID = bar - HighestAll(ParentLBarOrigin);
# S1
def ll = fold j = 1 to n + 1
         with q = 1
         while q
         do l < GetValue(l, -j);
def PivotL = if (bar > n and
                 l == Lowest(l, n) and
                 ll)
             then l
             else Double.NaN;
def PLValue = if !IsNaN(PivotL)
              then PivotL
              else PLValue[1];
def PLBarOrigin = if !IsNaN(PivotL)
                  then bar
                  else PLBarOrigin[1];
def PLBarID = bar - PLBarOrigin;
# S2
def S2PLValue = if PLBarOrigin != PLBarOrigin[1]
              then PLValue[1]
              else S2PLValue[1];
def S2PLBarOrigin = if PLBarOrigin != PLBarOrigin[1]
                  then PLBarOrigin[1]
                  else S2PLBarOrigin[1];
def S2PLBarID = bar - S2PLBarOrigin;
# S3
def S3PLValue = if S2PLBarOrigin != S2PLBarOrigin[1]
              then S2PLValue[1]
              else S3PLValue[1];
def S3PLBarOrigin = if S2PLBarOrigin != S2PLBarOrigin[1]
                  then S2PLBarOrigin[1]
                  else S3PLBarOrigin[1];
def S3PLBarID = bar - S3PLBarOrigin;
# S4
def S4PLValue = if S3PLBarOrigin != S3PLBarOrigin[1]
              then S3PLValue[1]
              else S4PLValue[1];
def S4PLBarOrigin = if S3PLBarOrigin != S3PLBarOrigin[1]
                  then S3PLBarOrigin[1]
                  else S4PLBarOrigin[1];
def S4PLBarID = bar - S4PLBarOrigin;

# Plots
plot PR1 = LinePlot(BarID = ParentHBarID,
                    Value = ParentHigh,
                    BarOrigin = HighestAll(ParentHBarOrigin));
PR1.SetDefaultColor(Color.GREEN);
#addChartBubble(Bar == HighestAll(ParentHBarOrigin), ParentHigh, "High", color.yellow, 1);
plot R1 = LinePlot(BarID = PHBarID,
                   Value = PHValue,
                   BarOrigin = PHBarOrigin);
R1.SetDefaultColor(Color.GREEN);
#AddChartBubble(bar == HighestAll(PHBarOrigin), PHValue, "R1", Color.GREEN, 1);

plot LowerBandr1 = R1 + Num_Dev_Dn ;
plot UpperBandr1 = R1 + Num_Dev_up ;
AddCloud(UpperBandr1, R1, Color.GREEN, Color.RED );
AddCloud(LowerBandr1, R1, Color.GREEN, Color.RED );
lowerbandr1.hide();
upperbandr1.hide();


plot R2 = LinePlot(BarID = R2PHBarID,
                   Value = R2PHValue,
                   BarOrigin = R2PHBarOrigin);
R2.SetDefaultColor(Color.GREEN);
#AddChartBubble(bar == HighestAll(R2PHBarOrigin), PHValue, "R2", Color.GREEN, 1);

plot LowerBandr2 = R2 + Num_Dev_Dn ;
plot UpperBandr2 = R2 + Num_Dev_up ;
AddCloud(UpperBandr2, R2, Color.GREEN, Color.RED);
AddCloud(LowerBandr2, R2, Color.GREEN, Color.RED);
lowerbandr2.hide();
upperbandr2.hide();

plot R3 = LinePlot(BarID = R3PHBarID,
                   Value = R3PHValue,
                   BarOrigin = R3PHBarOrigin);
R3.SetDefaultColor(Color.GREEN);
#AddChartBubble(bar == HighestAll(R3PHBarOrigin), PHValue, "R3", Color.GREEN, 1);

plot LowerBandr3 = R3 + Num_Dev_Dn ;
plot UpperBandr3 = R3 + Num_Dev_up ;
AddCloud(UpperBandr3, R3, Color.LIGHT_GRAY, Color.LIGHT_ORANGE);
AddCloud(LowerBandr3, R3, Color.LIGHT_GRAY, Color.LIGHT_ORANGE);
lowerbandr3.hide();
upperbandr3.hide();

plot R4 = LinePlot(BarID = R4PHBarID,
                   Value = R4PHValue,
                   BarOrigin = R4PHBarOrigin);
R4.SetDefaultColor(Color.GREEN);
#AddChartBubble(bar == HighestAll(R4PHBarOrigin), PHValue, "R4", Color.GREEN, 1);

plot LowerBandr4 = R4 + Num_Dev_Dn ;
plot UpperBandr4 = R4 + Num_Dev_up ;
AddCloud(UpperBandr4, R4, Color.LIME, Color.PINK);
AddCloud(LowerBandr4, R4, Color.LIME, Color.PINK);
lowerbandr4.hide();
upperbandr4.hide();


plot PS1 = LinePlot(BarID = ParentLBarID,
                   Value = ParentLow,
                   BarOrigin = HighestAll(ParentLBarOrigin));
PS1.SetDefaultColor(Color.RED);
#AddChartBubble(bar == HighestAll(ParentLBarOrigin), ParentLow, "Low", Color.YELLOW, 0);
plot S1 = LinePlot(BarID = PLBarID,
                   Value = PLValue,
                   BarOrigin = PLBarOrigin);
S1.SetDefaultColor(Color.RED);
#AddChartBubble(bar == HighestAll(PLBarOrigin), PLValue, "S1", Color.RED, 0);

plot LowerBands1 = S1 + Num_Dev_Dn ;
plot UpperBands1 = S1 + Num_Dev_up ;
AddCloud(UpperBands1, S1, Color.GREEN, Color.RED);
AddCloud(LowerBands1, S1, Color.GREEN, Color.RED);
lowerbands1.hide();
upperbands1.hide();

plot S2 = LinePlot(BarID = S2PLBarID,
                   Value = S2PLValue,
                   BarOrigin = S2PLBarOrigin);
S2.SetDefaultColor(Color.RED);
#AddChartBubble(bar == HighestAll(S2PLBarOrigin), PLValue, "S2", Color.RED, 0);

plot LowerBands2 = S2 + Num_Dev_Dn ;
plot UpperBands2 = S2 + Num_Dev_up ;
AddCloud(UpperBands2, S2, Color.GREEN, Color.RED);
AddCloud(LowerBands2, S2, Color.GREEN, Color.RED);
lowerbands2.hide();
upperbands2.hide();

plot S3 = LinePlot(BarID = S3PLBarID,
                   Value = S3PLValue,
                   BarOrigin = S3PLBarOrigin);
S3.SetDefaultColor(Color.RED);
#AddChartBubble(bar == HighestAll(S3PLBarOrigin), PLValue, "S3", Color.RED, 0);

plot LowerBands3 = S3 + Num_Dev_Dn ;
plot UpperBands3 = S3 + Num_Dev_up ;
AddCloud(UpperBands3, S3, Color.LIGHT_GRAY, Color.LIGHT_ORANGE);
AddCloud(LowerBands3, S3, Color.LIGHT_GRAY, Color.LIGHT_ORANGE);
lowerbands3.hide();
upperbands3.hide();


plot S4 = LinePlot(BarID = S4PLBarID,
                   Value = S4PLValue,
                   BarOrigin = S4PLBarOrigin);
S4.SetDefaultColor(Color.RED);
#AddChartBubble(bar == HighestAll(S4PLBarOrigin), PLValue, "S4", Color.RED, 0);

plot LowerBands4 = S4 + Num_Dev_Dn ;
plot UpperBands4 = S4 + Num_Dev_up ;
AddCloud(UpperBands4, S4, Color.LIME, Color.PINK);
AddCloud(LowerBands4, S4, Color.LIME, Color.PINK);
lowerbands4.hide();
upperbands4.hide();

plot BearScan = if (close crosses below S1) or
                   (close crosses below S2)
                then close
                else Double.NaN;
plot BullScan = if (close crosses above R1) or
                   (close crosses above R2)
                then close
                else Double.NaN;
# End Code Fractal Array
Attachments

Last edited by a moderator: